Introduction
Being a common mental health disorder, major depression disorder (MDD) is characterized by a negative impact on emotions, thinking, and behavior, and results in severe impairments of psychosocial functioning and poor quality of life (Malhi & Mann, Reference Malhi and Mann2018). Due to its prevalence, high recurrence rates, chronicity, and comorbidity, MDD is the leading driver of the disease-related burden of poor mental health worldwide (de la Salud, Reference de la Salud2017). Regrettably, the neurobiological pathogenesis underlying MDD remains largely controversial.
Though, over the past several decades, with the advancement of neuroimaging methodologies, substantial psychoradiological evidence on MDD brought to light both widespread morphological and functional brain abnormalities (Gong & He, Reference Gong and He2015; Gray, Müller, Eickhoff, & Fox, Reference Gray, Müller, Eickhoff and Fox2020; Sha et al., Reference Sha, Xia, Lin, Cao, Tang, Xu and He2018). It has been challenging to reproduce the patterns of the brain's dysfunction in MDD owing to the limited statistical power of small sample sizes and the diversity of data analysis processes including preprocessing procedures and functional brain measures (Botvinik-Nezer et al., Reference Botvinik-Nezer, Holzmeister, Camerer, Dreber, Huber, Johannesson and Schonberg2020; Gong & He, Reference Gong and He2015; Winter et al., Reference Winter, Leenings, Ernsting, Sarink, Fisch, Emden and Hahn2022). Larger samples (Libedinsky et al., Reference Libedinsky, Helwegen, Dannlowski, Fornito, Repple, Zalesky and van den Heuvel2022; Marek et al., Reference Marek, Tervo-Clemmens, Calabro, Montez, Kay, Hatoum and Dosenbach2022), meta- and mega-analyses analytic approaches (Button et al., Reference Button, Ioannidis, Mokrysz, Nosek, Flint, Robinson and Munafò2013) represent effective approaches for obtaining reliable and reproducible psychoradiological findings. Notably, the Enhancing Neuro Imaging Genetics Through Meta-Analysis (ENIGMA) MDD working group performed individual participant data-based meta-analyses on thousands of structural magnetic resonance imaging (MRI) scans and the results showed slight albeit robust abnormalities including lower hippocampal volumes (Schmaal et al., Reference Schmaal, Veltman, Van Erp, Smann, Frodl, Jahanshad and Hibar2016), thinner cortical thickness of the orbitofrontal cortex, anterior and posterior cingulate, insula and temporal lobes (Schmaal et al., Reference Schmaal, Hibar, Sämann, Hall, Baune, Jahanshad and Veltman2017), lower fractional anisotropy in widespread white matter tracts, particularly in the corpus callosum and corona radiata (van Velzen et al., Reference van Velzen, Kelly, Isaev, Aleman, Aftanas, Bauer and Schmaal2020) in individuals with MDD compared to healthy controls (HCs; Schmaal et al., Reference Schmaal, Pozzi, C Ho, van Velzen, Veer, Opel and Veltman2020). These works have provided better understanding of brain abnormalities associated with MDD. However, as previously shown, the brain function and cognition may be determined by the connections between brain regions (Thiebaut de Schotten & Forkel, Reference Thiebaut de Schotten and Forkel2022). Hence, the critical contribution of brain connections to the neurobiology of MDD needs to be considered.
To address this critical issue, the Depression Imaging REsearch ConsorTium (DIRECT) (Chen et al., Reference Chen, Lu, Li, Li, Wang, Castellanos and Yan2022b), which comprised 1300 patients with MDD and 1128 HCs from 25 research cohorts at 17 partnering hospitals in China, has concentrated on patterns of brain functional connectivity (FC) in individuals suffering from MDD. As reported by Yan et al.'s mega-analysis on individual-level measures across multiple sites (Yan et al., Reference Yan, Chen, Li, Castellanos, Bai, Bo and Zang2019), the individuals with MDD showed a general although slight decline in FC within the default mode network. Subsequently, Yang et al. (Reference Yang, Chen, Chen, Li, Li, Castellanos and Yan2021) revealed both remarkably lower global and local efficiency in MDD patients when compared to HCs via topological analysis based on individual-level functional brain networks data from the DIRECT. Furthermore, Xia et al. analyzed multi-site functional MRI data and found that compared to the control group, individuals with MDD exhibited notable hypoactivity in the orbitofrontal, somatosensory, and visual cortices, as well as hyperactivity in the frontal–parietal cortices (Xia et al., Reference Xia, Si, Sun, Ma, Liu, Wang and He2019). Although structural and functional connectivity is closely relevant, the correspondence is not perfect because of inconsistencies between structural and functional configurations (Suárez, Markello, Betzel, & Misic, Reference Suárez, Markello, Betzel and Misic2020). Therefore, further investigations of structural connectivity can provide a more comprehensive biological interpretation of the multi-causal nature of depression.
To date, the structural covariance network (SCN) has been commonly used to characterize the structural connectivity of gray matter morphology. Technically, traditional SCN, which was constructed from structural MRI by calculating interregional morphological similarity across a cohort of participants at the group level in a certain brain morphological measure, such as gray matter volume (GMV; Yao et al., Reference Yao, Zhang, Lin, Zhou, Xu and Jiang2010) or cortical thickness (He, Chen, & Evans, Reference He, Chen and Evans2007), has been applied to identify abnormal alterations in the topological organization of the structural networks in MDD patients (Chen et al., Reference Chen, Liu, Xi, Tan, Fan, Cheng and Yang2022a; Singh et al., Reference Singh, Kesler, Hadi Hosseini, Kelley, Amatya, Hamilton and Gotlib2013; Xiong et al., Reference Xiong, Dong, Cheng, Jiang, Sun, He and Yao2021). Nevertheless, the population-based SCN not only neglects interindividual variability but cannot reveal the correlation between brain phenotype with clinical symptoms. Accordingly, several methodologies for mapping the individualized SCN have been established based solely on T1-weighted images. One of the alternative strategies estimates interregional single or multiple morphological measures or radiomics similarity by computing correlation coefficients in different regions (Li et al., Reference Li, Yang, Shi, Wu, Wang, Nie and Zhang2017; Seidlitz et al., Reference Seidlitz, Váša, Shinn, Romero-Garcia, Whitaker, Vértes and Bullmore2018). The other estimates the similarity of intraregional morphological distributions for the reconstruction of individual-level connectome maps (Li et al., Reference Li, Wang, Wang, Lv, Zou and Wang2021c; Tijms, Seris, Willshaw, & Lawrie, Reference Tijms, Seris, Willshaw and Lawrie2012; Wang, Jin, Zhang, & Wang, Reference Wang, Jin, Zhang and Wang2016; Yu et al., Reference Yu, Wang, Li, Zhang, Li and Li2018). Using these methods, some studies provide new insights for further understanding the pathogenesis of depression at the level of individual structural networks (Chen et al., Reference Chen, Kendrick, Wang, Wu, Li, Huang and Gong2017; Li et al., Reference Li, Yang, Yin, Zhang, Zhang, Chen and Gong2021a, Reference Li, Seidlitz, Suckling, Fan, Ji, Meng and Liao2021b), but the results have been inconsistent. Specifically, Chen et al. found MDD patients exhibited increased segregation of morphological brain networks compared with HCs (Chen et al., Reference Chen, Kendrick, Wang, Wu, Li, Huang and Gong2017). However, another study have reported deficient segregation of functional neural processing in MDD patients (Li et al., Reference Li, Yang, Yin, Zhang, Zhang, Chen and Gong2021a). Such inconsistent findings might be attributed to limited sample sizes, variable analytical strategies, and/or the high heterogeneity of depression. Therefore, investigations regarding the altered topological architecture of individualized SCN in MDD based on large multi-site samples and standardized pre-processing and analysis procedures are highly warranted.
In this work, we first used a novel approach (Huang, Hsu, Lin, & Hsiao, Reference Huang, Hsu, Lin and Hsiao2020), which can quantify the degree to which structural heterogeneity of individual subjects' brain deviates from the mean HCs, to obtain individual SCN based solely on structural MRI data from 20 datasets (1173 MDD patients with MDD and 1019 HCs) that come from the DIRECT. Building on this foundation, we investigated individualized topological measures in MDD. This was followed by an investigation of whether episode type and medication status resulted in abnormalities.
Methods
Participants
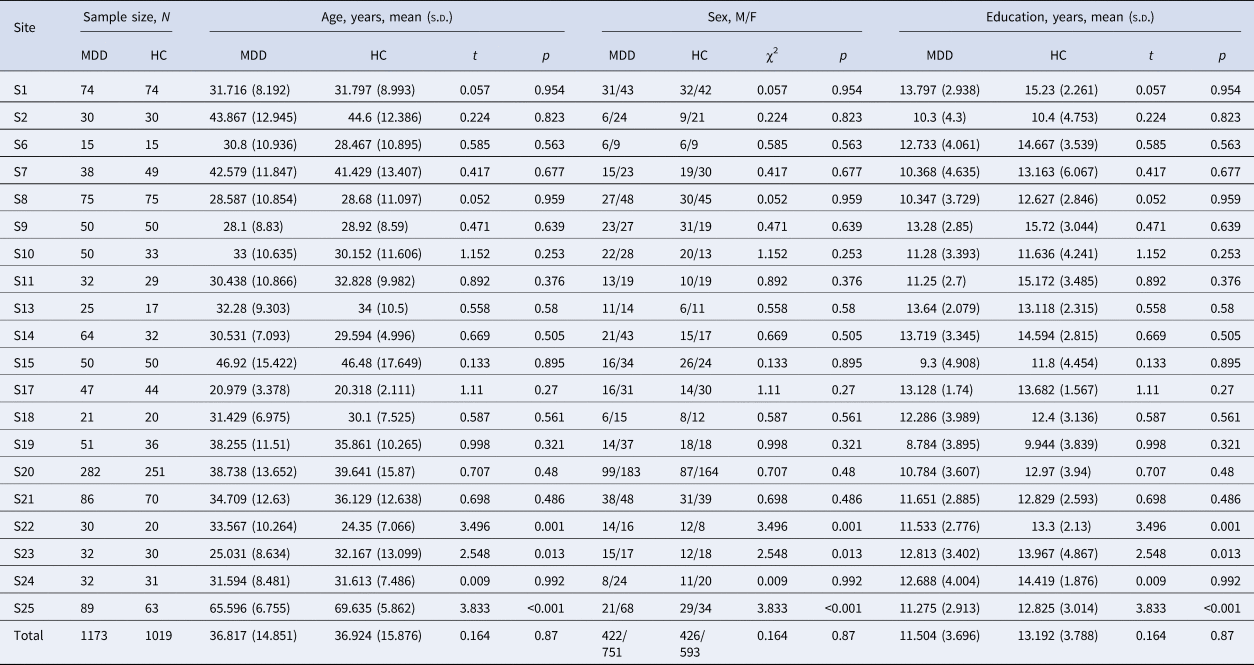
The dataset used in our study is obtained from the DIRECT (approval ID: U0200) (Yan et al., Reference Yan, Chen, Li, Castellanos, Bai, Bo and Zang2019). In the current study, we excluded data for the following exclusion criteria: (1) with incomplete information on sex, age, and education (site 3, 5, 16), (2) sites with fewer than 10 participants with MDD or HCs in either group (site 12), (3) site 4 (including 18 patients with MDD and 23 HCs) was excluded because it was a duplicate of site 14. Finally, the sample consisted of 2192 participants (1127 adult and 46 minor patients with MDD, 999 adult and 20 minor HCs, aged 12–82 years old) from 20 datasets. The study was approved by the local institutional review boards and ethics committees of each site and all participants signed written informed consent. Demographic and clinical characteristics of patients with MDD and HCs are summarized in Table 1.
Sample characteristics of 1173 depressive patients and 1019 healthy controls for each site in the present study

Note: MDD, major depressive disorder; HC, healthy controls; M, male; F, female; s.d., standard deviation; N, number.
Image acquisition and preprocessing
All 3D T1-weighted structural MRI scans were obtained and preprocessed at each local site using a standardized DPARSF methodology to address the analytic heterogeneity (Yan & Zang, Reference Yan and Zang2010) as previously described (Gao et al., Reference Gao, Chen, Xiao, Li, Zhu, Li and Wang2022; Li et al., Reference Li, Wang, Wang, Lv, Zou and Wang2021c). During the preprocessing pipeline, individuals with large head movements, incomplete coverage, and other artifacts were excluded via manual quality control to ensure the quality of T1 images. The detailed data acquisition parameters for each research center can be found in the corresponding article (Yan et al., Reference Yan, Chen, Li, Castellanos, Bai, Bo and Zang2019). More information on MRI processing can be found in online Supplementary Methods. Finally, the automated anatomical labeling2 (AAL2) atlas, which divided the brain into 120 regions, was employed to extract the regional GMV values for each subject (Rolls, Joliot, & Tzourio-Mazoyer, Reference Rolls, Joliot and Tzourio-Mazoyer2015).
Constructing individual structural covariance networks
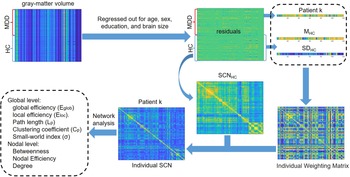
As the traditional group-level SCN lost the individual network information, here we adapted a recently established approach based on the inter-regional effect size difference (ESD) (Huang et al., Reference Huang, Hsu, Lin and Hsiao2020) to obtain individual SCN for our case–control study. As shown in Fig. 1, within each cohort, the main steps for constructing the individual SCN for each participant are as follows: (1) The regional GMV values of each region of interest were adjusted for covariates (e.g. age, gender, education, and total intracranial volume); and then we extracted the resulting regional GMV residuals. (2) A group-based SCN (SCNHC) was constructed across the entire control group by calculating the Pearson correlation coefficient between regional GMV residuals for each pair of brain regions. (3) We calculated the mean (MHC) and standard deviation (SDHC) values of each brain region from HCs. (4) The individual weight matrix (W) was yielded based on the inter-regional ESD between a single subject and average HCs group. (5) The final individual correlation coefficient matrix for a single subject can then be computed by element-by-element multiplication between W and SCNHC. See online Supplementary Methods for a more detailed description. Using the approach described above, for each subject, a 120 × 120 connection matrix consisting of 7140 edges between 120 nodes in the AAL2 brain atlas was obtained.
Schematic workflow of the current study. We first constructed intra-individual brain structural covariance networks in each dataset using regional gray matter volumes data. Then, for each individual, we computed graph theory metrics at the global and nodal levels using the intra-individual brain structural covariance networks. MDD, major depressive disorder; HC, healthy control; L, left; M, mean; SD, standard deviation; SCN, structural covariance networks.

Network analysis
A wide range of sparsity thresholds (K = 0.14–0.50; with a step of 0.01) was selected to binarize the individual SCN and used for the case–control comparison of global and nodal network topologies. According to previous research (Jiang et al., Reference Jiang, Yao, Zhou, Tan, Huang, Wang and Luo2022; Yun et al., Reference Yun, Boedhoe, Vriend, Jahanshad, Abe, Ameis and Kwon2020), the range of the sparsity threshold was defined as follows: (i) >90% of nodes remain connected to other nodes within the network; (ii) small-world index >1 was satisfied for >95% of the intra-individual SCN comprising each dataset. Five global network metrics (small-world index, global efficiency, local efficiency, path length, clustering coefficient), as well as three regional topological measures(nodal degree, nodal efficiency, nodal betweenness), were calculated for these thresholded and binarized networks at each sparsity threshold with the Brain Connectivity Toolbox (BCT) (Rubinov & Sporns, Reference Rubinov and Sporns2010). For each network measurement, the area under the curve (AUC) throughout the sparsity range (K = 0.14–0.50) was estimated and utilized for quantitative research.
Statistical analysis
To account for site effects, a linear mixed effects (LME) model was employed for this investigation to estimate the AUC of each global and nodal measure over 120 nodes, which can be expressed as: y ~ 1 + group + (1|site) + (group|site). By utilizing the FDR correction, multiple comparisons were taken into account. In each corresponding pair of subgroup analyses [e.g. first-episode drug naïve (FEDN) MDD patients v. HCs, recurrent MDD patients v. HCs, recurrent MDD patients v. HCs], the aforementioned network metrics are also contrasted involving the LME model. Besides, the association between network metrics and symptom severity was also investigated by replacement with the 17-item Hamilton Depression Rating Scale (HAMD) scores as the group variable in the LME model (excluding 93 patients in clinical remission with HAMD scores ⩽7).
Group- and site-specific SCN analysis
In line with previous study (Larivière et al., Reference Larivière, Royer, Rodríguez-Cruces, Paquola, Caligiuri, Gambardella and Bernhardt2022), in this study, we also constructed group- and site-specific SCN by calculating the Pearson correlation coefficient between regional GMV residuals for each pair of brain regions across per group, resulting in a 120 × 120 correlation symmetric matrix for each diagnostic group of each site. All global and regional nodal network metrics were assessed using an approach similar to the individual SCN analysis.
Validation analysis
We explored the replicability of our results through several strategies. (1) To identify whether particular sites might have an impact on our primary findings, we employed a leave one site out cross-validation methodology. Specifically, we excluded one site at a time and repeated the comparison between groups of the remaining data. (2) Using an inverse variance-weighted random-effect meta-analysis approach in R (metafor package, version 3.8-1), we verified our main findings. (3) We conducted the statistical analysis again for participants who were at least 18 years old to take into consideration the variations in brain development across the groups. BrainNet Viewer was used to visualize nodal-level alterations on the brain (Xia, Wang, & He, Reference Xia, Wang and He2013).
Results
A total of 2192 subjects from 20 cohorts were included in the primary analysis. Each site contributed an average of 58.65 ± 56.74 patients with MDD (range 15–282), and 50.95 ± 50.64 HCs (range 15–251). Detailed demographic information and clinical characteristics for all sites and subgroup analysis are provided in Table 1 and online Supplementary Table S1. HAMD scores (range 0–47, mean ± standard deviation = 20.36 ± 7.80) were available for 1070 of 1173 MDD individuals, and 93 patients had HAMD scores below 7.
Alteration in global network topologies in MDD patients
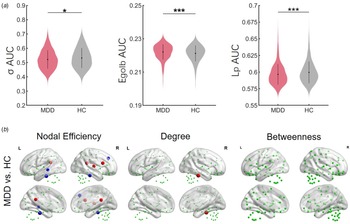
Between-group statistical comparisons revealed alterations in network properties. The MDD patients showed significantly lower small-world index (t = −2.538, p = 0.011) and path length (t = − 4.025, p < 0.001) but higher global efficiency (t = 3.938, p < 0.001) values than the HCs group (Fig. 2 and online Supplementary Table S1).
Group differences in network topological properties between major depressive disorder (MDD) patients and health controls (HCs). (a) Violin plots illustrating the area under the curve (AUC) parameters of the global topological metrics for MDD patients and HCs. Means and standard deviations are depicted. (b) Group differences in the nodal topological metrics between MDD patients and HCs. Insignificant nodes are shown as green spheres, whereas blue (MDD < HC) and red (MDD > HC) spheres denote significant differences after FDR correction. The size of the significant nodes reflects the effect sizes of group differences. Green spheres that are outside the brain indicate the nodes of cerebellum. *p < 0.05, ***p < 0.001.

Alteration in regional network topologies in MDD patients
Patients with MDD had an increased nodal degree in the right inferior temporal gyrus (ITG). We also found increased nodal efficiency in the bilateral posterior cingulate gyrus (PCG), right opercular part of inferior frontal gyrus (IFGoperc), and right Heschel gyrus (HG), as well as decreased nodal efficiency in bilateral ITG and left middle temporal gyrus (MTG) and right dorsolateral superior frontal gyrus (SFGdor) in patients compared with HCs (Fig. 2).
Influence of disease status
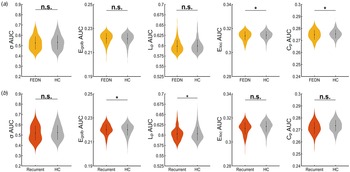
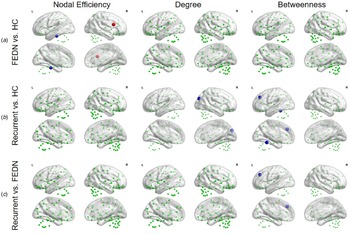
According to the disease status, we further classified the patients into different subgroups. After sample selection, we compared the remaining 268 FEDN patients with 438 HCs from five research groups (site 8, 9, 14, 20, and 23). Compared with HCs, we found significantly decreased local efficiency (t = −2.359, p = 0.019) and clustering coefficient (t = −2.330, p = 0.020) in FEDN patients, and small-world index (t = −1.190, p = 0.057) values showed a decreasing trend. We also found significantly increased global efficiency (t = 2.274, p = 0.023) and decreased path length (t = −2.249, p = 0.025) values in 261 recurrent patients compared with 545 HCs from eight sites (site 2, 7, 9, 11, 19, 20, 21, and 23). No significant differences in global network characteristics were found between patients with 79 recurrent MDD and 148 FEDN patients from three sites (site 9, 20, and 23) (see Fig. 3 and online Supplementary Table S2). There were no statistically significant between-subgroup differences in any regional nodal metrics after correcting for FDR multiple comparisons. As shown in Fig. 4, at uncorrected level (p uncorr < 0.01), we found nodal efficiency in FEDN MDD patients was decreased in left ITG but increased in right SFGdor. Meanwhile, compared with HCs, patients with recurrent MDD showed decreased nodal degrees in the right superior occipital gyrus (SCG), and decreased nodal betweenness in the right SFGdor and left lobule IV, V of cerebellar. Furthermore, patients with recurrent MDD exhibited reduced nodal betweenness in the left SFGdor compared to FEDN patients.
Violin figures depicting the results of global topological metrics in subgroup analysis of MDD patients in different stages. Distributions of areas under curve (AUCs) are depicted. (a) First-episode drug naïve (FEDN) major depressive disorder (MDD) patients v. health controls (HCs). (b) Recurrent patients with MDD v. HCs. *p < 0.05.

Subgroup differences in the nodal topological metrics, uncorrected at p < 0.01. Nonsignificant nodes are shown as green spheres. Blue (a: FEDN < HC; b: recurrent MDD < HC; c: recurrent MDD < FEDN) and red (a: FEDN > HC; b: recurrent MDD > HC; c: recurrent MDD > FEDN) spheres denote significant differences. The sizes of the significant nodes reflect the effect sizes of group differences. Green spheres that are outside the brain indicate the nodes of cerebellum. HC, health control; FEDN, first-episode drug naïve.

Influence of medication and illness duration
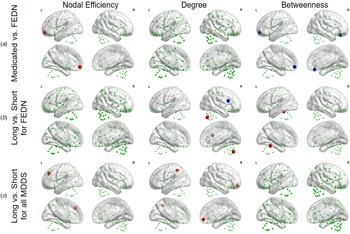
To further investigate the effects of medication treatment and illness on the network metrics, we classified the patients into different pairs of subgroups according to the strategy in the previous study (Yan et al., Reference Yan, Chen, Li, Castellanos, Bai, Bo and Zang2019), including medicated MDDs (n = 149) v. FEDN MDDs (n = 181) from three sites (site 8, 20, and 23), patients with longest illness duration (⩾12 months, n = 88) v. shortest illness duration (⩽3 months, n = 66) in FEDN MDDs, patients with longest illness duration (⩾24 months, n = 267) v. shortest illness duration (⩽6 months, 191 MDDs) in the entire sample. No significant differences in global network characteristics were found between each corresponding pair of subgroups (online Supplementary Table S3). There also was no statistically significant difference on any regional network metrics after multiple comparison corrections. At uncorrected level (p uncorr < 0.01), compared with FEDN MDDs, we found that medicated MDDs showed increased nodal efficiency in the left medial orbital of superior frontal gyrus (PFCventmed) and decreased nodal betweenness in left PFCventmed and right gyrus rectus (REC) (Fig. 5a). Meanwhile, within FEDN MDDs, patients with longest illness duration showed decreased nodal degrees in the cerebellum (right Crus II of the cerebellar hemisphere) but increased nodal degrees in right IFGoperc, and decreased nodal betweenness in the cerebellum (left lobule IV, V of cerebellar) compared with patients with shortest illness duration (Fig. 5b). Furthermore, in the entire sample, patients with longest illness duration showed increased nodal efficiency in left SFGdor and increased nodal degrees in left inferior parietal gyrus and right PFCventmed (Fig. 5c).
The effects of medication status and illness duration in MDD patients on the nodal topological metrics, uncorrected at p < 0.01. Nonsignificant nodes are shown as green spheres. Blue and red spheres indicate significant differences in decrease and increase, respectively. The sizes of the significant nodes reflect the effect sizes of group differences. Green spheres that are outside the brain indicate the nodes of cerebellum. (a) For first-episode MDD patients with v. without medication usage. (b) For FEDN MDD patients with long v. short illness duration. (c) For all MDD patients with long v. short illness duration. FEDN, first-episode drug naïve.

Correlations between symptom severity and network metrics
After multiple comparison corrections, the correlation results between symptom severity and any of the network metrics were nonsignificant.
Group- and site-specific SCN analysis
Comparing patients with MDD to controls, no significant differences in any global and regional nodal network metrics were found at group-level SCN (all p > 0.05) (online Supplementary Table S4).
Validation analyses
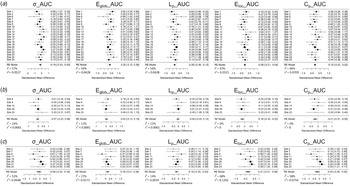
Consequently, the MDD-related alterations in network metrics across the various validation procedures were remarkably consistent with our main results that the patients with MDD showed a shift toward randomization in structural brain networks compared to HCs. For patients in different stages, individuals with recurrent MDD showed increased integration, whereas the FEDN patients exhibited decreased segregation (Fig. 6, online Supplementary Figs S1, S2 and Tables S5, S6).
Forest plots of effect size of each site generated by the meta-model in reproducibility analysis of global topological metrics. (a) MDD group v. HC group. (b) First-episode drug naïve (FEDN) MDD group v. HC group. (c) Recurrent MDD group v. HC group. Of note, for each comparison, only sites with sample size larger than 10 in each group were included.

Discussion
In the present study, we demonstrated differences in topological network properties in individuals with MDD and unaffected controls across 20 datasets of the DIRECT through a brain-wide, graph theory-based network analytical approach. Specifically, based on the analysis of individual SCN, we found significantly decreased small-world index and path length, as well as increased global efficiency in the MDD group compared to the HCs group. Of greater interest, the recurrent MDD showed increased global efficiency and reduced path length that were similar to those of the MDD and HCs group, whereas FEDN patients showed statistically lower local efficiency and clustering coefficients. In addition, we identified altered nodal efficiency and nodal degrees in some regions mainly associated with emotion regulation. In the analysis of group-level SCN, we did not detect any significant differences in inter-group comparisons.
Despite prior investigations indicating group-level differences in structural covariance aberrance (Chen et al., Reference Chen, Liu, Xi, Tan, Fan, Cheng and Yang2022a; Neufeld et al., Reference Neufeld, Kaczkurkin, Sotiras, Mulsant, Dickie, Flint and Voineskos2020; Singh et al., Reference Singh, Kesler, Hadi Hosseini, Kelley, Amatya, Hamilton and Gotlib2013; Watanabe et al., Reference Watanabe, Kakeda, Katsuki, Ueda, Ikenouchi, Yoshimura and Korogi2020; Xiong et al., Reference Xiong, Dong, Cheng, Jiang, Sun, He and Yao2021; Yun & Kim, Reference Yun and Kim2021), our current study did not reveal any significant differences between patients with MDD and HCs. The inconsistent findings across studies may be attributed to factors such as small sample sizes in previous single-center investigations, comorbidities, medication, age of onset (Han et al., Reference Han, Chen, Zheng, Li, Jiang, Wang and Cheng2021; Schmaal et al., Reference Schmaal, Hibar, Sämann, Hall, Baune, Jahanshad and Veltman2017). In contrast to group-level SCN that ignore inter-individual variability, the individual-based SCN method utilized in this study enables the quantification of individual deviations from the healthy reference cohort in each brain regional morphological features. Notably, the results derived from individual SCN highlight the practicality and effectiveness of employing the normative model framework in neuroimaging research (Han et al., Reference Han, Xue, Chen, Xu, Li, Song and Cheng2023; Liu et al., Reference Liu, Palaniyappan, Wu, Zhang, Du, Zhao and Feng2021).
Previous connectome studies in neuroscience have shown that both the structural and functional networks of the human brain follow small-world topology (Barbey, Reference Barbey2018; Liao, Vasilakos, & He, Reference Liao, Vasilakos and He2017), which represents an optimal balance between information segregation (e.g. clustering coefficient and local efficiency) and integration (e.g. path length and global efficiency). As clearly defined by Suo et al. (Reference Suo, Lei, Li, Li, Dai, Wang and Gong2018), there were four patterns of significant changes in the global topology of brain networks in patients with major psychiatric disorders (including regularization, randomization, stronger small-worldization, and weaker small-worldization). In the current study, we found significantly lower small-world index in MDD, implying an imbalance of information separation and integration in the brain structural network. Specifically, the gray matter networks in patients with MDD showed increased integration characterized by increased global efficiency and decreased path length, suggesting a shift toward randomization. Surprisingly, consistent with two previous studies based on this multisite dataset (Yan et al., Reference Yan, Chen, Li, Castellanos, Bai, Bo and Zang2019; Yang et al., Reference Yang, Chen, Chen, Li, Li, Castellanos and Yan2021), further subgroup analysis revealed that this randomization pattern (increased global efficiency and decreased path length) was also observed in patients with recurrent MDD. Also of interest, distinct from the above-mentioned, the brain networks of FEDN patients showed a randomization pattern with decreased segregation including decreased local efficiency and clustering coefficient. It is well-known that stress is a major contributing factor for the onset of depression (LeMoult et al., Reference LeMoult, Battaglini, Grocott, Jopling, Rnic and Yang2022). Additionally, stress-sensitization models of recurrence in MDD propose that individuals with recurrent episodes of depression become more vulnerable to stress and consequently more susceptible to trigger recurrences (Stroud, Davila, Hammen, & Vrshek-Schallhorn, Reference Stroud, Davila, Hammen and Vrshek-Schallhorn2011). Consistent with stress-sensitization models, a prior morphometric study has reported individuals with reduced volume in the dentate gyrus and thinner cortical thickness medial prefrontal cortex showed greater number of prior depressive episodes despite lower level of recent stress (Treadway et al., Reference Treadway, Waskom, Dillon, Holmes, Park, Chakravarty and Pizzagalli2015). Recent findings also suggested functional brain networks tend to shift into a more integrated and less segregated state to enable efficient coping with acute stress (Wang, Zhen, Zhou, & Yu, Reference Wang, Zhen, Zhou and Yu2022). Thus, we speculate that the different patterns of topological alterations may be biological diathesis in structural brain networks for depressive episodes. Specifically, more integration and less segregation of the brain structural network may reflect the deterioration of network structure/architecture, or the loss of network specialization with disease progression. Unfortunately, the cross-sectional nature of our study precludes definitive causal inference. It is important to note that further research utilizing longitudinal designs may be necessary in order to establish the direction of causality. In addition, with medication usage as a covariate, small-world properties showed a more significant shift toward randomization in MDD (online Supplementary Table S7), including not only abnormal integration (increased global efficiency and decreased path length) but also separation (decreased local efficiency and clustering coefficient). Several previous investigations have found that specific areas of brain gray structural morphology may be relevant to antidepressant medication (Bartlett et al., Reference Bartlett, DeLorenzo, Sharma, Yang, Zhang, Petkova and Parsey2018; Enneking, Leehr, Dannlowski, & Redlich, Reference Enneking, Leehr, Dannlowski and Redlich2019; Kang & Cho, Reference Kang and Cho2020; Nogovitsyn et al., Reference Nogovitsyn, Muller, Souza, Hassel, Arnott, Davis and MacQueen2020). This medication effect may underlie the shift from impaired information separation toward impaired integration of information in the brain networks of patients with depression. Given the missing information on drug class, dose, and duration of use, future research focusing on utilizing longitudinal follow-up to further confirm medication effects is essentially important.
Furthermore, at the nodal level, compared with HCs, patients with MDD exhibited altered nodal properties in many brain regions including ITG, PCG, IFGoperc, HG, MTG, and SFGdor. This phenomenon is comparable to previous findings from connectome studies in MDD. Of highest concern was the ITG, which was not influenced by any specific site. With an expanding knowledge of the temporal lobe, as a hub implicated in important features of human cognition, its role in multiple cognitive, affective, and sensory processes has become more apparent (Vos De Wael et al., Reference Vos De Wael, Royer, Tavakol, Wang, Paquola, Benkarim and Bernhardt2021). Moreover, ITG is connected to the rest of brain areas, including the frontal and parietal lobes, other regions of the temporal lobe, the occipital lobe, and the limbic lobe, via distinct white matter pathways, and plays a key role in visual object recognition, language comprehension, and emotion regulation (Lin et al., Reference Lin, Young, Conner, Glenn, Chakraborty, Nix and Sughrue2020). Previous studies have demonstrated structural abnormalities in the temporal lobes in MDD patients, including the middle and inferior temporal gyri (Koutsouleris et al., Reference Koutsouleris, Kambeitz-Ilankovic, Ruhrmann, Rosen, Ruef, Dwyer and Borgwardt2018; Neufeld et al., Reference Neufeld, Kaczkurkin, Sotiras, Mulsant, Dickie, Flint and Voineskos2020; Schmaal et al., Reference Schmaal, Hibar, Sämann, Hall, Baune, Jahanshad and Veltman2017). A recent study further provides support for the association between the left ITG covariate network and cognitive deficits (Yang et al., Reference Yang, Chen, Sang, Zhao, Wang, Li and Zhang2022). Collectively, these abnormal findings in ITG could be explained as the neural basis contributing to the broad spectrum of emotion-related disturbances and cognitive deficits observed in subjects with depression.
Online Supplementary subgroup analysis of different disease stages revealed nodal efficiency in several brain regions including left ITG and right SFGdor (part of dorsolateral prefrontal cortex, dlPFC) was observed to be evident abnormal in the FEDN but not found in recurrent patients with MDD. Evidence from previous neuroimaging studies supports the hypothesis of imbalanced activity in bilateral dlPFC in MDD (Grimm et al., Reference Grimm, Beck, Schuepbach, Hell, Boesiger, Bermpohl and Northoff2008), postulating a relative hypoactivity in the left dlPFC and a relative hyperactivity of the right dlPFC. It has also been shown that an imbalance in the gray matter morphology of dlPFC is associated with symptoms and the recurrence of MDD (Lemke et al., Reference Lemke, Klute, Skupski, Thiel, Waltemate, Winter and Dannlowski2022; Liu et al., Reference Liu, Mao, Wei, Yang, Du, Xie and Qiu2016; Zaremba et al., Reference Zaremba, Dohm, Redlich, Grotegerd, Strojny, Meinert and Dannlowski2018). Therefore, we speculate that the increased nodal efficiency in left SFGdor may be linked to stronger negative emotions and lead to depressive symptoms.
No substantial anomalies in nodal efficiency in recurrent MDD might be due to medication history or illness duration. In our study, we found no significant illness duration effects on nodal efficiency within FEDN MDDs. This phenomenon seems to suggest that the length of illness duration is not important. Nevertheless, within the whole group, we found increased nodal efficiency in left SFGdor in long–short illness duration contrast. Meanwhile, another notable finding is that medicated MDDs had increased nodal efficiency in the left PFCventmed (part of the anterior ventromedial prefrontal cortex, vmPFC) compared with FEDN MDDs. The considerable body of evidence for the vmPFC has highlighted the multifaceted role in emotion, decision-making, and social cognition that are commonly disrupted in MDD (Hiser & Koenigs, Reference Hiser and Koenigs2018). There was also evidence that the anterior vmPFC regions were associated with positive emotions and the posterior vmPFC regions were associated with negative valence (Hiser & Koenigs, Reference Hiser and Koenigs2018; Ma, Reference Ma2015). Moreover, consistent with the current findings, a prior meta-analysis of antidepressant effects has demonstrated increased activity in anterior vmPFC related to positive emotions and increased activity in the dlPFC to normalize abnormal neural responses in depressed patients (Ma, Reference Ma2015). Building on the above evidence, we hypothesize that antidepressants may more directly act to modulate adaptive neural processes in MDD through modifying nodal properties of regions that play a key role in both emotion regulation and executive control rather than global properties. We are now unable to confirm this hypothesis further owing to the fact that recurrent patients have a longer illness duration than first-episode patients in our data, as well as the lack of information on treatment duration and whether currently unmedicated recurrent MDDs had been previously treated with antidepressants. If this is the case, future longitudinal research with medication follow-up focusing on testing this hypothesis is essentially important. Since this alteration was defined at an uncorrected level, caution should be taken in interpreting the results.
Limitations and future directions
Several limitations of our study need to be considered. First, while our project included a highly powered sample with a standardized preprocessing pipeline across all sites, all participants were from different area with different social-cultural backgrounds. Future study with more homogeneous samples would be beneficial to further address the heterogeneity. Next, previous works have well-documented widespread deficits in the white matter fiber tracts of MDD patients (Shen et al., Reference Shen, Reus, Cox, Adams, Liewald, Bastin and McIntosh2017; van Velzen et al., Reference van Velzen, Kelly, Isaev, Aleman, Aftanas, Bauer and Schmaal2020). Future studies incorporating multimodal neuroimaging data will serve to advance our knowledge of the biological mechanisms of MDD. Another limitation is that the study datasets were cross-sectional. It will be crucial for future research, including longitudinal neuroimaging data, to examine the reproducibility of investigating the processes underlying the development of depression in the brain. Furthermore, it is worth noting that our study solely relied on the AAL 120 atlas to define network nodes and characterize network properties. Thus, it is imperative to ascertain the generalizability of these findings by employing other well-established parcellation schemes in future studies. Finally, the individual SCN was constructed solely based on GMV. Alternatively, other gray matter morphological indicators (e.g. cortical thickness, surface area, and gyrification) could be adapted as well.
Conclusions
To conclude, our study has unveiled marked alterations of the topological architecture in MDD of individual SCN. Notably, these changes manifest as increased integration in the structural brain networks of individuals with MDD during illness progression. These findings offer valuable insights and enrich our understanding of the pathophysiology of MDD. Importantly, the potential implications of our findings lie in guiding future prognosis and maintenance therapies for individuals with MDD.
Supplementary material
The supplementary material for this article can be found at https://doi.org/10.1017/S003329172300168X
Data and code availability statement
Data of the DIRECT project are available from the Rest-meta-MDD consortium (http://rfmri.org/REST-meta-MDD). This study used openly available BCT software and codes (https://www.nitrc.org/projects/bct).
Acknowledgments
We would really like to appreciate the collaborative members of the REST-meta-MDD consortium for sharing the data.
Financial support
This work was funded by the Natural Science Foundation of Xiamen, China (No.3502Z20227151, No.3502Z20227417), the National Natural Science Foundation of China (No. 82060259), the Xiamen Medical and Health Guidance Project (No.3502Z20224ZD1312), Fujian provincial health technology project (No. 2022QNB030).
Competing interest
All authors declare that they have no biomedical financial interests or potential conflicts of interest.