1. Introduction
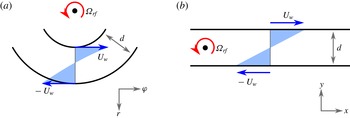
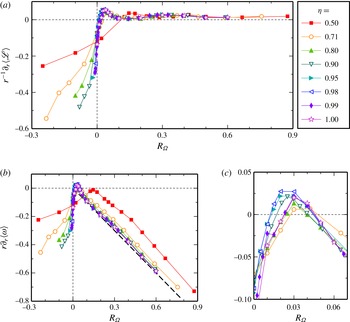
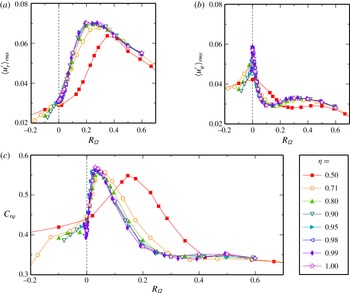
The motion of a fluid between two independently rotating concentric cylinders, denoted Taylor–Couette flow (TCF), serves as a fundamental model system to study the influence of rotation on turbulence. The two main control parameters of the system, the rotation rates of both cylinders, can be combined into two parameters that capture the key physical processes. The differential rotation of the cylinders results in a shear gradient driving the flow, and the average of inner and outer cylinder rotation (denoted the mean system rotation) defines the magnitude of rotational influences which can either enhance or attenuate the fluid motion, depending on the rotation direction. This decomposition into differential and mean rotation is depicted in figure 1(a). Depending on the system rotation, the laminar state becomes unstable due to a centrifugal instability (Rayleigh Reference Rayleigh1917; Taylor Reference Taylor1923) or without a linear instability via a subcritical transition (Wendt Reference Wendt1933; Taylor Reference Taylor1936; Burin & Czarnocki Reference Burin and Czarnocki2012; Deguchi, Meseguer & Mellibovsky Reference Deguchi, Meseguer and Mellibovsky2014) similar to the transition in other wall-bounded shear flows. Beyond the laminar regime, different combinations of shear and system rotation result in a multitude of distinct flow states (Coles Reference Coles1965; Andereck, Liu & Swinney Reference Andereck, Liu and Swinney1986) that continue to shape the turbulence up to high cylinder speeds (Ravelet, Delfos & Westerweel Reference Ravelet, Delfos and Westerweel2010; Huisman et al. Reference Huisman, van der Veen, Sun and Lohse2014; Ostilla-Mónico et al. Reference Ostilla-Mónico, van der Poel, Verzicco, Grossmann and Lohse2014b ).
The influence of the curvature of the cylinder walls can be captured by the ratio of the radii of the inner and outer cylinders,
 ${\it\eta}=r_{i}/r_{o}$
, as a third control parameter. If the radius ratio
 ${\it\eta}$
falls considerably below 1, the curvature influence on the fluid motion becomes important. Conversely, the system curvature becomes small when
 ${\it\eta}$
approaches 1 while keeping the gap width
 $r_{o}-r_{i}$
constant, since the cylinder radii diverge in this limit. Then, the Taylor–Couette (TC) system approximates plane Couette flow subject to spanwise system rotation, cf. figure 1(b), commonly called rotating plane Couette flow (RPCF). This RPCF-limit of TCF is relevant for rotating astrophysical and geophysical flows, as the radii in these systems are often much larger than the flow structures so that the curvature becomes small (Dubrulle et al.
Reference Dubrulle, Dauchot, Daviaud, Longaretti, Richard and Zahn2005; Hersant, Dubrulle & Huré Reference Hersant, Dubrulle and Huré2005; Rincon, Ogilvie & Cossu Reference Rincon, Ogilvie and Cossu2007). We here study the limiting process of vanishing curvature for turbulent TCF and its dependence on system rotation. For this purpose, we performed direct numerical simulations (DNS) of TCF for seven values of
 ${\it\eta}$
ranging between
 $0.5$
and
 $0.99$
. For each radius ratio, three turbulent shear rates and various mean rotation states were realised. We complemented these TC simulations with analogous DNS of RPCF to compare directly to the curvature-free limit.
Schematic representations of the two flows. (a) TC system seen from above in the reference frame rotating with
 ${\it\Omega}_{rf}$
. Only one third of the azimuthal circumference is shown, reflecting the actual computational domain for
 ${\it\eta}=0.5$
. (b) RPCF, as obtained from (a) for vanishing curvature, i.e. when
 ${\it\eta}\rightarrow 1$
for a constant gap width
 $d$
. While the spanwise
 $z$
-coordinate points out of the paper in both systems, the wall-normal coordinates
 $r$
and
 $y$
are antiparallel.

An important physical quantity in turbulent TCF is the torque needed to drive the cylinders, which is connected to a radial transport of angular momentum by the fluid motion (Marcus Reference Marcus1984; Dubrulle & Hersant Reference Dubrulle and Hersant2002; Eckhardt, Grossmann & Lohse Reference Eckhardt, Grossmann and Lohse2007b
). In the turbulent regime, the torque can be characterised by its scaling with the shear strength modulated by a function that depends on the system rotation (Dubrulle et al.
Reference Dubrulle, Dauchot, Daviaud, Longaretti, Richard and Zahn2005). This rotation dependence of the torque features a maximum for counter-rotating cylinders, as measured and calculated for
 ${\it\eta}=0.7$
(Paoletti & Lathrop Reference Paoletti and Lathrop2011; van Gils et al.
Reference van Gils, Huisman, Bruggert, Sun and Lohse2011; Brauckmann & Eckhardt Reference Brauckmann and Eckhardt2013a
; Ostilla et al.
Reference Ostilla, Stevens, Grossmann, Verzicco and Lohse2013) and for
 ${\it\eta}=0.5$
(Merbold, Brauckmann & Egbers Reference Merbold, Brauckmann and Egbers2013). The torque-maximizing rotation state has been linked to the occurrence of intermittent turbulence near the outer cylinder that decreases the momentum transport efficiency (van Gils et al.
Reference van Gils, Huisman, Grossmann, Sun and Lohse2012; Brauckmann & Eckhardt Reference Brauckmann and Eckhardt2013b
) and results from the stabilisation of the outer flow region for counter-rotating cylinders. At the same time, the flow near the inner cylinder remains centrifugally unstable. Since the curvature that causes this difference in stability between the inner and outer region vanishes for
 ${\it\eta}\rightarrow 1$
, we also expect the rotation influence on the torque to change. Evidence for such deviations in behaviour between cases with
 ${\it\eta}<0.9$
and larger
 ${\it\eta}$
have also been noted in experiments with
 ${\it\eta}\approx 0.9$
(Ravelet et al.
Reference Ravelet, Delfos and Westerweel2010; Ostilla-Mónico et al.
Reference Ostilla-Mónico, Huisman, Jannink, Van Gils, Verzicco, Grossmann, Sun and Lohse2014a
). However, the rotation dependence in TC systems with a radius ratio significantly larger than
 $0.9$
has not yet been explored, and represents one of the main objectives of the present study. Moreover, we will study how turbulent characteristics, such as torques, mean profiles and fluctuations, change during the transition from TCF to RPCF and how TCF turns into RPCF.
In the context of the transition to turbulence, the RPCF-limit of the TC system has already been studied in an approximation where certain curvature terms in the equations of motion have been neglected (Nagata Reference Nagata1986, Reference Nagata1990; Demay, Iooss & Laure Reference Demay, Iooss and Laure1992). Nagata found that wavy vortices, which develop as an instability of streamwise-invariant Taylor vortices, can be continued to non-rotating plane Couette flow where they form finite-amplitude solutions. Such wavy roll cells were also observed experimentally in RPCF at low shear rates (Hiwatashi et al.
Reference Hiwatashi, Alfredsson, Tillmark and Nagata2007). Moreover, by considering the full equations of motion, Faisst & Eckhardt (Reference Faisst and Eckhardt2000) were able to continuously study the transition from TC to plane Couette flow and found that, already for radius ratios
 ${\it\eta}$
below 1, some characteristics of plane Couette flow can be observed. Furthermore, Dubrulle et al. (Reference Dubrulle, Dauchot, Daviaud, Longaretti, Richard and Zahn2005) noted that also the linear stability criterion for the laminar state in RPCF (Lezius & Johnston Reference Lezius and Johnston1976) is approximated by the stability boundary of TCF (Esser & Grossmann Reference Esser and Grossmann1996) when the radius ratio
 ${\it\eta}$
tends to 1. Beyond the first bifurcation towards turbulence, further transitions create a rich set of flow states also in RPCF (Tsukahara, Tillmark & Alfredsson Reference Tsukahara, Tillmark and Alfredsson2010; Daly et al.
Reference Daly, Schneider, Schlatter and Peake2014), reminiscent of the states described by Andereck et al. (Reference Andereck, Liu and Swinney1986) in TCF. In an extension of these bifurcation studies at low Reynolds numbers that revealed a number of similarities between the two systems, we here investigate the continuous transition of TCF to RPCF in the turbulent regime.
In plane Couette flow, the effect of rotation depends on the relative orientation of rotation and vorticity. Cyclonic spanwise rotation, i.e. when the rotation vector is parallel to the vorticity of the laminar base flow, was found to have a stabilising effect on the turbulence (Komminaho, Lundbladh & Johansson Reference Komminaho, Lundbladh and Johansson1996) and to generate a striped pattern of coexisting laminar and turbulent regions (Tsukahara Reference Tsukahara2011). Similar turbulent–laminar patterns were also observed at much higher shear rates by increasing the cyclonic rotation (Brethouwer, Duguet & Schlatter Reference Brethouwer, Duguet and Schlatter2012). On the contrary, anticyclonic spanwise rotation, where the rotation is antiparallel to the base-flow vorticity, has a destabilizing effect and was found to drive vortices reminiscent of turbulent Taylor vortices (Bech & Andersson Reference Bech and Andersson1997; Barri & Andersson Reference Barri and Andersson2010; Tsukahara Reference Tsukahara2011). For strong anticyclonic rotations, these vortices break up again and become disorganised. The influence of rotation on the strength of vortices is of substantial interest also in the present study since such vortices can enhance the momentum transport and, therefore, contribute to the formation of torque maxima, as demonstrated by Brauckmann & Eckhardt (Reference Brauckmann and Eckhardt2013b ).
Investigations of RPCF for anticyclonic rotation furthermore revealed that the mean downstream velocity profile exhibits a linear section in the centre of the gap. In this region, which can extend over a considerable fraction of the gap, the vorticity of the mean profile compensates the imposed vorticity of the spanwise rotation (Bech & Andersson Reference Bech and Andersson1997; Barri & Andersson Reference Barri and Andersson2010; Suryadi, Segalini & Alfredsson Reference Suryadi, Segalini and Alfredsson2014). As a consequence, in the central region, the gradient of the profile increases linearly with the imposed rotation rate. A physical explanation for these profile shapes in the central region comes from the observation that mean profiles of zero absolute vorticity comply with neutral stability in RPCF (Barri & Andersson Reference Barri and Andersson2010; Suryadi et al.
Reference Suryadi, Segalini and Alfredsson2014). Such prominent changes of the profile gradient with varying system rotation were also observed for the angular velocity in TCF (Wendt Reference Wendt1933; van Gils et al.
Reference van Gils, Huisman, Grossmann, Sun and Lohse2012; Brauckmann & Eckhardt Reference Brauckmann and Eckhardt2013a
; Ostilla et al.
Reference Ostilla, Stevens, Grossmann, Verzicco and Lohse2013; Ostilla-Mónico et al.
Reference Ostilla-Mónico, Huisman, Jannink, Van Gils, Verzicco, Grossmann, Sun and Lohse2014a
). However, it remains unclear how the mean profiles in TCF compare to those in RPCF and whether they converge in the limit of vanishing curvature (
 ${\it\eta}\rightarrow 1$
).
The purpose of the present study is to examine the continuous transition from TCF to RPCF and to compare turbulent characteristics between both systems taking into account the following aspects. First, we quantify the effect of the vanishing curvature, when
 ${\it\eta}$
tends to unity, by the decreasing strength of intermittent fluctuations near the outer cylinder and by the local stability for counter-rotating cylinders. Second, we show that as these intermittent fluctuations disappear, the rotation dependence of the torque also changes. Third, we look for flow characteristics that prove the convergence of TCF to RPCF and seek the
 ${\it\eta}$
range in which the convergence can be observed. Fourth, the magnitudes of the momentum transport by coherent vortices are analysed to assess their importance for the formation of torque maxima. In addition, we evaluate the effect of turbulent fluctuations on the momentum transport. Finally, we look for a convergence of streamwise velocity profiles and introduce a unified description of profile gradients in the central region in TCF and RPCF.
The paper is structured as follows. In § 2 we describe the unified framework in which we study TCF and RPCF, including the equations of motion, common control parameters and their ranges and the momentum transport equations and numerical aspects. The vanishing of curvature effects is studied in § 3, followed in § 4 by an analysis of the total momentum transport as well as the vortex-induced momentum transport. Finally, we discuss the rotation dependence of velocity profiles and of turbulent fluctuations contributing to the momentum transport in § 5. We close with a summary and some concluding remarks.
2. Definitions and numerical methods
Since several different combinations of parameters are used in TCF, we begin by discussing the limiting case of RPCF, so that we can then chose parameters that correspond to the ones in RPCF. As usual, RPCF refers to the flow between two parallel walls that move in opposite directions and are subject to system rotation in the spanwise direction. We describe this system in Cartesian coordinates
 $(x,y,z)$
with the velocity field
 $\boldsymbol{u}=(u_{x},u_{y},u_{z})$
and the walls at
 $y=-h$
and
 $y=h$
moving in the
 $x$
-direction with velocities
 $-U_{w}$
and
 $U_{w}$
, respectively. The entire system rotates with angular velocity
 ${\it\bf\Omega}={\it\Omega}_{rf}\boldsymbol{e}_{z}$
around the spanwise axis as depicted in figure 1(b). We chose
 $d=2h$
and
 $U_{0}=2U_{w}$
as characteristic scales for all lengths and velocities. In these units and in a reference frame rotating with
 ${\it\Omega}_{rf}$
, the Navier–Stokes equation and incompressibility condition become
 $$\begin{eqnarray}\partial _{t}\boldsymbol{u}+(\boldsymbol{u}\boldsymbol{\cdot }\boldsymbol{{\rm\nabla}})\boldsymbol{u}=-\boldsymbol{{\rm\nabla}}p-R_{{\it\Omega}}\,\boldsymbol{e}_{z}\times \boldsymbol{u}+{\displaystyle \frac{1}{Re_{S}}}{\rm\Delta}\boldsymbol{u},\quad \boldsymbol{{\rm\nabla}}\boldsymbol{\cdot }\boldsymbol{u}=0,\end{eqnarray}$$
where
 $p$
denotes the non-dimensionalized pressure; the centrifugal force has been absorbed into the pressure. The motion is characterised by two dimensionless parameters, the shear Reynolds number
 $Re_{S}$
and the rotation number
 $R_{{\it\Omega}}$
which measures the ratio between system rotation and shear,
 $$\begin{eqnarray}Re_{S}={\displaystyle \frac{U_{0}\,d}{{\it\nu}}},\quad R_{{\it\Omega}}={\displaystyle \frac{2{\it\Omega}_{rf}\,d}{U_{0}}},\end{eqnarray}$$
where
 ${\it\nu}$
denotes the kinematic viscosity of the fluid. In contrast to the often used plane Couette flow Reynolds number
 $Re=U_{w}h/{\it\nu}$
, the definition of the shear Reynolds number
 $Re_{S}$
is based on the full velocity difference and wall distance, so that
 $Re_{S}=4Re$
.
TCF is the motion of a fluid between independently-rotating concentric cylinders. Its geometric parameters are the inner and outer cylinder radii
 $r_{i}$
and
 $r_{o}$
and the axial height
 $L_{z}$
. The radius ratio, defined as
 ${\it\eta}=r_{i}/r_{o}$
, determines the curvature; it is thus the parameter that controls the transition to RPCF (which emerges for
 ${\it\eta}\rightarrow 1$
). The inner and outer cylinders rotate with angular velocities
 ${\it\omega}_{i}$
and
 ${\it\omega}_{o}$
, respectively, and their ratio
 ${\it\mu}={\it\omega}_{o}/{\it\omega}_{i}$
or its negative,
 $a=-{\it\mu}$
, (van Gils et al.
Reference van Gils, Huisman, Bruggert, Sun and Lohse2011; Brauckmann & Eckhardt Reference Brauckmann and Eckhardt2013a
; Ostilla et al.
Reference Ostilla, Stevens, Grossmann, Verzicco and Lohse2013) is often used to define the rotation state of the system. In order to study TCF in the same framework as RPCF, we follow the analysis of Dubrulle et al. (Reference Dubrulle, Dauchot, Daviaud, Longaretti, Richard and Zahn2005) and describe the flow in a reference frame that rotates with the angular velocity
 ${\it\Omega}_{rf}$
. We make use of the cylindrical symmetry and introduce coordinates
 $(r,{\it\varphi},z)$
with velocities
 $\boldsymbol{u}=(u_{r},u_{{\it\varphi}},u_{z})$
. In analogy to RPCF, we choose
 ${\it\Omega}_{rf}$
such that the cylinder walls move symmetrically in opposite directions in the rotating reference frame, i.e. such that the condition
 $u_{{\it\varphi}}(r_{i})=-u_{{\it\varphi}}(r_{o})\equiv U_{w}$
is fulfilled as depicted in figure 1(a). This gives
 $$\begin{eqnarray}r_{i}({\it\omega}_{i}-{\it\Omega}_{rf})=-r_{o}({\it\omega}_{o}-{\it\Omega}_{rf})\quad \Leftrightarrow \quad {\it\Omega}_{rf}={\displaystyle \frac{r_{i}{\it\omega}_{i}+r_{o}{\it\omega}_{o}}{r_{i}+r_{o}}}.\end{eqnarray}$$
As the characteristic velocity scale
 $U_{0}$
, we choose the velocity difference between the cylinder walls in the rotating reference frame, i.e.
 $$\begin{eqnarray}\displaystyle U_{0} & \equiv & \displaystyle u_{{\it\varphi}}(r_{i})-u_{{\it\varphi}}(r_{o})=r_{i}{\it\omega}_{i}-r_{o}{\it\omega}_{o}+(r_{o}-r_{i}){\it\Omega}_{rf}\nonumber\\ \displaystyle & = & \displaystyle {\displaystyle \frac{2}{1+{\it\eta}}}\left(r_{i}{\it\omega}_{i}-{\it\eta}r_{o}{\it\omega}_{o}\right).\end{eqnarray}$$
The last step in (2.4) results from substituting
 ${\it\Omega}_{rf}$
from (2.3). With a view towards the variables in RPCF, we take the gap width
 $d=r_{o}-r_{i}$
as the characteristic scale to measure all lengths. Instead of the radius ratio
 ${\it\eta}$
, Dubrulle et al. (Reference Dubrulle, Dauchot, Daviaud, Longaretti, Richard and Zahn2005) specify a typical radius
 $\widetilde{r}=\sqrt{r_{i}r_{o}}/d$
and define the curvature number
 $R_{C}=1/\,\widetilde{r}$
to characterise the curvature of the system. (The relation to
 ${\it\eta}$
is given in (2.8) below, where the definitions of all parameters are collected.) Using these units, the equations of motion in cylindrical coordinates (Landau & Lifshitz Reference Landau and Lifshitz1987) transformed to the rotating reference frame can be written as
 $$\begin{eqnarray}\displaystyle \partial _{t}\boldsymbol{u}+(\boldsymbol{u}\boldsymbol{\cdot }\widetilde{\boldsymbol{{\rm\nabla}}})\boldsymbol{u} & = & \displaystyle -\widetilde{\boldsymbol{{\rm\nabla}}}p-R_{{\it\Omega}}\,\boldsymbol{e}_{z}\times \boldsymbol{u}+{\displaystyle \frac{1}{Re_{S}}}\widetilde{{\rm\Delta}}\boldsymbol{u}\nonumber\\ \displaystyle & & \displaystyle +\,R_{C}\,{\displaystyle \frac{\widetilde{r}}{r}}\left[u_{{\it\varphi}}^{2}\boldsymbol{e}_{r}-u_{r}u_{{\it\varphi}}\boldsymbol{e}_{{\it\varphi}}+{\displaystyle \frac{1}{Re_{S}}}\left(\partial _{r}\boldsymbol{u}+{\displaystyle \frac{2}{r}}\partial _{{\it\varphi}}(\boldsymbol{e}_{z}\times \boldsymbol{u})\right)\right]\nonumber\\ \displaystyle & & \displaystyle +\,{\displaystyle \frac{{R_{C}}^{\,2}}{Re_{S}}}\,{\displaystyle \frac{\widetilde{r}^{\,2}}{r^{2}}}(u_{r}\boldsymbol{e}_{r}+u_{{\it\varphi}}\boldsymbol{e}_{{\it\varphi}}),\end{eqnarray}$$
 $$\begin{eqnarray}\displaystyle \widetilde{\boldsymbol{{\rm\nabla}}}\boldsymbol{\cdot }\boldsymbol{u} & = & \displaystyle -R_{C}\,{\displaystyle \frac{\widetilde{r}}{r}}u_{r},\end{eqnarray}$$
with the modified Nabla and Laplace operators
 $$\begin{eqnarray}\widetilde{\boldsymbol{{\rm\nabla}}}=\boldsymbol{e}_{r}\partial _{r}+\boldsymbol{e}_{{\it\varphi}}{\displaystyle \frac{1}{r}}\partial _{{\it\varphi}}+\boldsymbol{e}_{z}\partial _{z},\quad \widetilde{{\it\Delta}}=\partial _{r}^{2}+{\displaystyle \frac{1}{r^{2}}}\partial _{{\it\varphi}}^{2}+\partial _{z}^{2}.\end{eqnarray}$$
Again, the centrifugal force is absorbed in a modified pressure
 $p$
. The terms in (2.5) and (2.6) are arranged in a form adapted from Faisst & Eckhardt (Reference Faisst and Eckhardt2000) in order to clarify that in the limit
 ${\it\eta}\rightarrow 1$
the equations of motion (2.5) and (2.6) indeed converge to the corresponding ones for RPCF (2.1) since the additional terms on the right-hand side vanish as
 $R_{C}\rightarrow 0$
. The transition between Cartesian coordinates in RPCF and cylindrical coordinates in TCF requires the identifications
 $x=r{\it\varphi}$
and
 $y\sim r$
.
The equations of motion show that the TC system is characterised by three dimensionless parameters (Dubrulle et al. Reference Dubrulle, Dauchot, Daviaud, Longaretti, Richard and Zahn2005),
 $$\begin{eqnarray}\displaystyle \left.\begin{array}{@{}r@{}}Re_{S}={\displaystyle \frac{U_{0}\,d}{{\it\nu}}}={\displaystyle \frac{2}{1+{\it\eta}}}\left(Re_{i}-{\it\eta}Re_{o}\right),\quad R_{{\it\Omega}}={\displaystyle \frac{2{\it\Omega}_{rf}\,d}{U_{0}}}=(1-{\it\eta}){\displaystyle \frac{Re_{i}+Re_{o}}{Re_{i}-{\it\eta}Re_{o}}},\\ R_{C}={\displaystyle \frac{1}{\widetilde{r}}}={\displaystyle \frac{1-{\it\eta}}{\sqrt{{\it\eta}}}},\end{array}\right\} & & \displaystyle\end{eqnarray}$$
that result from (2.3) and (2.4), where
 $Re_{i}=r_{i}{\it\omega}_{i}d/{\it\nu}$
and
 $Re_{o}=r_{o}{\it\omega}_{o}d/{\it\nu}$
denote the traditional Reynolds numbers that measure the dimensionless velocity of the inner and outer cylinders in the laboratory frame of reference. Note that
 $Re_{S}$
and
 $R_{{\it\Omega}}$
are defined in strict analogy to RPCF (2.2a,b
) so that
 $R_{{\it\Omega}}$
has the opposite sign to the rotation number used by Dubrulle et al. (Reference Dubrulle, Dauchot, Daviaud, Longaretti, Richard and Zahn2005), Ravelet et al. (Reference Ravelet, Delfos and Westerweel2010) and Paoletti et al. (Reference Paoletti, van Gils, Dubrulle, Sun, Lohse and Lathrop2012). Finally, in these units, the laminar angular velocity profile in the laboratory frame given by the circular Couette flow reads
 $$\begin{eqnarray}{\it\omega}_{lam}(r)={\displaystyle \frac{1}{2}}\left(R_{{\it\Omega}}-1+{\displaystyle \frac{\widetilde{r}^{\,2}}{r^{2}}}\right),\end{eqnarray}$$
with
 $r$
ranging between
 $r_{i}$
and
 $r_{o}$
.
2.1. Parameters for the limit of vanishing curvature
We are interested in the transition from TCF to RPCF, in the limit when the radius ratio
 ${\it\eta}=r_{i}/r_{o}$
approaches one. This limit is often called the small-gap limit, since it can be obtained for fixed outer radius when the radius of the inner cylinder approaches that of the outer one and the gap width
 $d=r_{o}-r_{i}$
ultimately vanishes. However, in units of the width
 $d$
, the radii increase like
 $r_{i},r_{o}\sim 1/(1-{\it\eta})$
and diverge as
 ${\it\eta}$
approaches one; this is why this situation was called the ‘limit of large radii’ in Faisst & Eckhardt (Reference Faisst and Eckhardt2000). Moreover, the curvature vanishes (
 $R_{C}\rightarrow 0$
) as
 ${\it\eta}\rightarrow 1$
, suggesting that curvature effects become less important. However, rotation effects can be maintained.
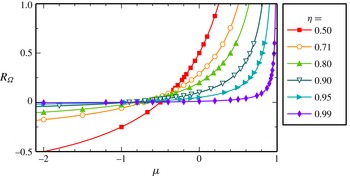
Transformation between the ratio of angular velocities
 ${\it\mu}={\it\omega}_{o}/{\it\omega}_{i}$
and the rotation number
 $R_{{\it\Omega}}$
for various radius ratios
 ${\it\eta}$
. For TC systems with vanishing curvature (
 ${\it\eta}\rightarrow 1$
), most
 ${\it\mu}$
-values result in almost no system rotation (
 $R_{{\it\Omega}}\approx 0$
) and
 $R_{{\it\Omega}}>0$
is achieved only for
 ${\it\mu}$
close to one. The symbols mark the values of
 ${\it\mu}$
and
 $R_{{\it\Omega}}$
realised by our simulations for
 $Re_{S}=2\times 10^{4}$
.

For every radius ratio
 ${\it\eta}$
, the traditional Reynolds numbers can be expressed in terms of the shear Reynolds number and the rotation number as
 $$\begin{eqnarray}Re_{i}={\displaystyle \frac{Re_{S}}{2}}+{\displaystyle \frac{{\it\eta}}{2(1-{\it\eta})}}Re_{S}\,R_{{\it\Omega}},\quad Re_{o}=-{\displaystyle \frac{Re_{S}}{2}}+{\displaystyle \frac{1}{2(1-{\it\eta})}}Re_{S}\,R_{{\it\Omega}}\end{eqnarray}$$
and more specifically as
 $Re_{i}=Re_{S}/2$
and
 $Re_{o}=-Re_{S}/2$
in the non-rotating case (
 $R_{{\it\Omega}}=0$
) independent of
 ${\it\eta}$
. In contrast, for finite rotation (
 $R_{{\it\Omega}}\neq 0$
), the cylinder Reynolds numbers
 $Re_{i}$
and
 $Re_{o}$
diverge in the vanishing-curvature limit as
 ${\it\eta}\rightarrow 1$
. As a consequence, the ratio of angular velocities,
 $$\begin{eqnarray}{\it\mu}={\it\eta}{\displaystyle \frac{Re_{o}}{Re_{i}}}={\displaystyle \frac{-{\it\eta}(1-{\it\eta})+{\it\eta}R_{{\it\Omega}}}{(1-{\it\eta})+{\it\eta}R_{{\it\Omega}}}},\end{eqnarray}$$
converges to
 ${\it\mu}=-1$
for
 $R_{{\it\Omega}}=0$
and to
 ${\it\mu}=1$
for any
 $R_{{\it\Omega}}\neq 0$
in the vanishing-curvature limit, as shown in figure 2. These limiting values illustrate that the transition between TCF and RPCF is singular in the traditional parameters,
 $Re_{i}$
,
 $Re_{o}$
and
 ${\it\mu}$
, but not in the parameters
 $Re_{S}$
and
 $R_{{\it\Omega}}$
that we will generally use here. We note that one exception to this parameter choice occurs in § 3 where the effect of curvature for counter-rotating cylinders can be characterised more adequately by the ratio of angular velocities
 ${\it\mu}$
. Furthermore, while
 $R_{C}$
measures the curvature and thus clarifies its disappearance (
 $R_{C}\rightarrow 0$
) for
 ${\it\eta}\rightarrow 1$
, we will identify the different TC geometries by the radius ratio
 ${\it\eta}$
as this parameter is more commonly used.
2.2. Momentum transport in Taylor–Couette and rotating plane Couette flow
To study the mean turbulent characteristics of the flow, we calculate wall-normal profiles of the velocity and other flow fields by averaging over surfaces parallel to the wall. The averages are denoted by
 $\langle \cdots \rangle$
. The surfaces are concentric cylinders in the case of TCF,
 $\langle \cdots \rangle (r)=\langle \cdots \rangle _{{\it\varphi}z}$
, and planes parallel to the bounding walls in the case of RPCF,
 $\langle \cdots \rangle (y)=\langle \cdots \rangle _{xz}$
. Equations for the averages follow from the Navier–Stokes equation. The average of the
 ${\it\varphi}$
-component of the equation of motion (2.5) of TCF results in the continuity equation for the specific angular momentum
 $\mathscr{L}=ru_{{\it\varphi}}$
,
 $$\begin{eqnarray}\partial _{t}\langle \mathscr{L}\rangle +r^{-1}\partial _{r}(rJ^{\mathscr{L}})=0\quad \text{with }J^{\mathscr{L}}=\langle u_{r}\mathscr{L}\rangle -Re_{S}^{-1}r^{2}\partial _{r}\langle {\it\omega}\rangle ,\end{eqnarray}$$
where
 $J^{\mathscr{L}}$
denotes the angular-momentum flux in dimensionless units (Marcus Reference Marcus1984),
 ${\it\omega}=u_{{\it\varphi}}/r$
the angular velocity and
 $r^{-1}\partial _{r}(rJ^{\mathscr{L}})$
the divergence in radial direction. In the statistically stationary state, where
 $\partial _{t}\langle \mathscr{L}\rangle =0$
, the transverse current
 $J^{{\it\omega}}=rJ^{\mathscr{L}}$
becomes independent of the radius (Eckhardt et al.
Reference Eckhardt, Grossmann and Lohse2007b
). In physical units, the torque
 $T$
needed to drive the cylinders can be calculated from the dimensionless angular-momentum flux
 $J^{\mathscr{L}}$
as
 $T={\it\rho}_{f}{\it\nu}^{2}d\,Re_{S}^{2}\,A(r)\,J^{\mathscr{L}}$
, with the dimensionless cylindrical surface area
 $A(r)=2{\rm\pi}rL_{z}$
and the mass density of the fluid
 ${\it\rho}_{f}$
. The remaining prefactors compensate for the non-dimensionalization of (2.12). We define the dimensionless torque per axial length,
 $$\begin{eqnarray}G={\displaystyle \frac{T}{2{\rm\pi}L_{z}{\it\rho}_{f}{\it\nu}^{2}d}}=Re_{S}^{2}\,rJ^{\mathscr{L}}=Re_{S}^{2}\,J^{{\it\omega}},\end{eqnarray}$$
and introduce the Nusselt number,
 $$\begin{eqnarray}Nu_{{\it\omega}}=G/G_{lam}=J^{{\it\omega}}/J_{lam}^{{\it\omega}},\end{eqnarray}$$
that measures the torque in units of the torque of the laminar profile
 $G_{lam}$
(Dubrulle & Hersant Reference Dubrulle and Hersant2002; Eckhardt, Grossmann & Lohse Reference Eckhardt, Grossmann and Lohse2007a
).
Equations corresponding to (2.12)–(2.14) can also be derived for RPCF. Averaging the downstream component of the equation of motion (2.1) results in a continuity equation for the specific momentum in the
 $x$
-direction
 $$\begin{eqnarray}\partial _{t}\langle u_{x}\rangle +\partial _{y}J^{u}=0\quad \text{with }J^{u}=\langle u_{y}u_{x}\rangle -Re_{S}^{-1}\partial _{y}\langle u_{x}\rangle\end{eqnarray}$$
(see also Pope Reference Pope2000, § 7.1), where
 $J^{u}$
denotes the momentum flux in dimensionless units. In the statistically stationary state, it is independent of the wall-normal coordinate
 $y$
. In analogy to the torque
 $T$
, the force
 $F$
needed to keep the plane walls at a constant velocity can be calculated from the momentum flux
 $J^{u}$
multiplied by the dimensionless surface area
 $A_{xz}=L_{x}L_{z}$
through which the flux passes,
 $F={\it\rho}_{f}{\it\nu}^{2}Re_{S}^{2}\,A_{xz}\,J^{u}$
. Finally, we define the Nusselt number for the momentum transport in RPCF as in (2.14),
 $$\begin{eqnarray}Nu_{u}=F/F_{lam}=J^{u}/J_{lam}^{u},\end{eqnarray}$$
that measures the force in units of the value
 $F_{lam}$
for the laminar flow.
This completes our set of relations between TCF and RPCF that we want to study here. We have identified correspondences between the continuity equations (2.12) and (2.15), the torque and the force (
 $T\leftrightarrow F$
), the angular-momentum flux and the momentum flux (
 $J^{\mathscr{L}}\leftrightarrow J^{u}$
), the Nusselt numbers (
 $Nu_{{\it\omega}}\leftrightarrow Nu_{u}$
) and the mean profiles that enter the diffusive part of the flux in (2.12) and (2.15) (
 $\langle {\it\omega}\rangle (r)\leftrightarrow \langle u_{x}\rangle (y)$
). Since we study the statistically stationary cases only, we also average in time to improve the statistics. Using the dimensionless shear Reynolds number
 $Re_{S}$
and rotation number
 $R_{{\it\Omega}}$
(2.2a,b
), we can now study the momentum transport in both systems within the same framework and in a non-singular manner.
We conclude this section by pointing out a peculiar property of the relations that we will take up again in later sections. While the equations of motion (2.1) and (2.5) depend on both driving parameters
 $Re_{S}$
and
 $R_{{\it\Omega}}$
, the momentum transport equations (2.12) and (2.15) do not explicitly depend on the rotation number
 $R_{{\it\Omega}}$
, as noted for RPCF by Salewski & Eckhardt (Reference Salewski and Eckhardt2015). The rotation only indirectly influences the momentum fluxes
 $J^{\mathscr{L}}$
and
 $J^{u}$
by changing the turbulent velocity correlations (
 $\langle u_{r}\mathscr{L}\rangle$
and
 $\langle u_{y}u_{x}\rangle$
) and the mean profiles (
 $\langle {\it\omega}\rangle$
and
 $\langle u_{x}\rangle$
), as we will discuss for the correlations in §§ 4.1.1 and 5.3 and for the profiles in § 5.2.
2.3. Investigated parameter range
Studies for different
 ${\it\eta}$
(or
 $R_{C}$
) give information on when the properties of RPCF emerge from TCF, and studies of different
 $Re_{S}$
and
 $R_{{\it\Omega}}$
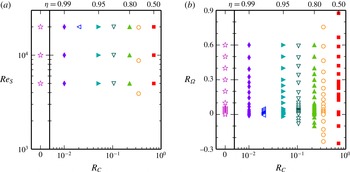
give information on the impact of shear and rotation on the turbulence. The range of parameters explored is indicated in figure 3. They were selected as follows.
Parameter space
 $(R_{C},Re_{S},R_{{\it\Omega}})$
explored by DNS of TCF and RPCF to study the limit of vanishing curvature, i.e.
 $R_{C}\rightarrow 0$
equivalent to
 ${\it\eta}\rightarrow 1$
. (a) For the shear Reynolds numbers
 $Re_{S}$
and curvature numbers
 $R_{C}$
indicated here, several simulations with
 $R_{{\it\Omega}}\in (-0.3,0.9)$
were performed. (b) The range of rotation numbers
 $R_{{\it\Omega}}$
explored is shown here for
 $Re_{S}=2\times 10^{4}$
and different curvature numbers
 $R_{C}=(1-{\it\eta})/\sqrt{{\it\eta}}$
. The curvature numbers correspond to the radius ratios
 ${\it\eta}=0.99$
,
 $0.98$
,
 $0.95$
,
 $0.90$
,
 $0.80$
,
 $0.71$
and
 $0.5$
. The extra columns for
 $R_{C}=0$
summarise our RPCF simulations.

For each curvature number
 $R_{C}$
the evolution of the rotation dependence is analysed with increasing shear, by realising various mean rotation states for three shear Reynolds numbers
 $Re_{S}=5\times 10^{3}$
,
 $1\times 10^{4}$
and
 $2\times 10^{4}$
. Since we adopt part of the results for
 ${\it\eta}=0.71$
from our previous study (Brauckmann & Eckhardt Reference Brauckmann and Eckhardt2013a
), the simulated values of
 $Re_{S}=3899$
,
 $8772$
,
 $19\,737$
deviate slightly from the target values, as indicated in figure 3(a). In the following, we will skip over these small differences in
 $Re_{S}$
, as they are not significant within statistical fluctuations. Our highest value of
 $Re_{S}$
lies in the range where the transition to the fully turbulent state was observed in experiments for
 ${\it\eta}\sim 0.7$
and stationary outer cylinder (Lathrop, Fineberg & Swinney Reference Lathrop, Fineberg and Swinney1992; Lewis & Swinney Reference Lewis and Swinney1999). We performed simulations for the range of rotation numbers
 $R_{{\it\Omega}}$
where the occurrence of a torque maximum was observed for medium radius ratios
 ${\it\eta}$
(Dubrulle et al.
Reference Dubrulle, Dauchot, Daviaud, Longaretti, Richard and Zahn2005; Paoletti & Lathrop Reference Paoletti and Lathrop2011; van Gils et al.
Reference van Gils, Huisman, Bruggert, Sun and Lohse2011; Paoletti et al.
Reference Paoletti, van Gils, Dubrulle, Sun, Lohse and Lathrop2012; Brauckmann & Eckhardt Reference Brauckmann and Eckhardt2013a
; Merbold et al.
Reference Merbold, Brauckmann and Egbers2013; Ostilla et al.
Reference Ostilla, Stevens, Grossmann, Verzicco and Lohse2013); this allowed us to extend these studies to
 ${\it\eta}$
close to one. Moreover, rotation numbers that correspond to strong counter-rotation
 ${\it\mu}<0$
were selected in order to study the fate of the turbulent intermittency in the outer region (Coughlin & Marcus Reference Coughlin and Marcus1996; van Gils et al.
Reference van Gils, Huisman, Grossmann, Sun and Lohse2012; Brauckmann & Eckhardt Reference Brauckmann and Eckhardt2013b
). Thus, the simulated rotation numbers lie mainly in the range
 $-0.1\leqslant R_{{\it\Omega}}\leqslant 0.6$
as shown in figure 3(b), except for
 $R_{C}=0.02$
(
 ${\it\eta}=0.98$
) where we focus on a narrow range in
 $R_{{\it\Omega}}$
only for a study of the intermittency for counter-rotation. The case of no system rotation, i.e.
 $R_{{\it\Omega}}=0$
, corresponds to counter-rotating cylinders with
 ${\it\omega}_{o}=-{\it\eta}{\it\omega}_{i}$
. For the highest shear Reynolds number
 $Re_{S}=2\times 10^{4}$
, the evolution of the rotation dependence is studied for seven curvature numbers
 $R_{C}>0$
(TCF) and for
 $R_{C}=0$
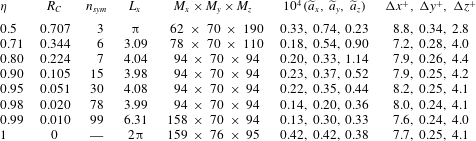
(RPCF), as listed in table 1.
Domain size and spatial resolution at the highest
 $Re_{S}=2\times 10^{4}$
for the different radius ratios
 ${\it\eta}$
and corresponding curvature numbers
 $R_{C}$
. The azimuthal periodicity
 $n_{sym}$
was introduced for the TC simulations to reduce the natural azimuthal length to
 $L_{x}=2{\rm\pi}r_{a}/n_{sym}$
with the mean radius
 $r_{a}=(r_{i}+r_{o})/2$
, while the wall-normal (radial) and spanwise (axial) lengths were kept at
 $L_{y}=1$
and
 $L_{z}=2$
.
 $M_{x}$
,
 $M_{y}$
and
 $M_{z}$
give the highest order of spectral modes in the corresponding direction. The amplitudes of the highest spectral modes
 $\widetilde{a}_{x}$
,
 $\widetilde{a}_{y}$
and
 $\widetilde{a}_{z}$
estimate the truncation error of the expansion in the corresponding direction.
 ${\rm\Delta}x^{+}$
,
 ${\rm\Delta}y^{+}$
and
 ${\rm\Delta}z^{+}$
denote the grid spacing in inner wall units
 ${\it\delta}_{{\it\nu},i}$
at the inner cylinder. We listed the maximal amplitude and grid spacing values over all
 $R_{{\it\Omega}}$
.

2.4. Numerical codes and tests of convergence
For our investigations of TCF and RPCF we perform DNS that approximate a solution to the incompressible Navier–Stokes equation (2.5)–(2.6) and (2.1), respectively. In these simulations we introduce a spanwise (axial) periodicity of length
 $L_{z}=2$
which is large enough to accommodate one pair of counter-rotating Taylor vortices. Turbulent Taylor vortices are the typical flow structures at and around the torque maximum, and they are suppressed for strongly co- or counter-rotating cylinders (Brauckmann & Eckhardt Reference Brauckmann and Eckhardt2013b
; Huisman et al.
Reference Huisman, van der Veen, Sun and Lohse2014; Ostilla-Mónico et al.
Reference Ostilla-Mónico, van der Poel, Verzicco, Grossmann and Lohse2014b
). In RPCF, and as will be shown in large radius ratio TCF, there can exist two peaks in the momentum transport, both of which show turbulent Taylor vortices (Salewski & Eckhardt Reference Salewski and Eckhardt2015). In the cases studied here, the flows near the maxima typically consist of a single vortex pair. Corresponding flow visualizations are shown in Brauckmann & Eckhardt (Reference Brauckmann and Eckhardt2013a
) for TCF and in Salewski & Eckhardt (Reference Salewski and Eckhardt2015) for RPCF with
 $L_{z}={\rm\pi}$
. In addition, a streamwise periodicity of length
 $L_{x}=2{\rm\pi}$
was assumed in the RPCF simulations while TCF is naturally periodic in this direction. However, we only simulated a domain of reduced azimuthal length
 $L_{x}$
that repeats
 $n_{sym}$
times to fill the entire cylinder circumference. For
 ${\it\eta}=0.5$
and
 ${\it\eta}=0.71$
we tested that the reduced azimuthal length does not bias the computed torques for a stationary outer cylinder. The length
 $L_{x}$
was further increased for larger radius ratios, see table 1.
As discussed in more detail in Brauckmann & Eckhardt (Reference Brauckmann and Eckhardt2013a
), simulating slightly longer or higher domains that are compatible with the natural size of vortices, set by the gap width, i.e. domains that contain more vortices of the same size, does not change the torque. The torques from our previous study (Brauckmann & Eckhardt Reference Brauckmann and Eckhardt2013b
) are compatible with results obtained in a domain that is approximately three times higher and completely winds around the cylinder (Ostilla et al.
Reference Ostilla, Stevens, Grossmann, Verzicco and Lohse2013). Also at higher
 $Re_{S}\sim 10^{5}$
, Ostilla-Mónico, Verzicco & Lohse (Reference Ostilla-Mónico, Verzicco and Lohse2015) showed that doubling the domain length or height leaves the torque and streamwise velocity profile almost unchanged. However, they noticed small differences in the velocity fluctuations, which would only slightly affect our results. The RPCF simulations with
 $L_{z}={\rm\pi}$
instead of
 $L_{z}=2$
reported in Salewski & Eckhardt (Reference Salewski and Eckhardt2015) show the same flow characteristics: two maxima in
 $Nu_{u}$
, the relevance of Taylor vortices for these maxima and a variation of the mean profile gradient with
 $R_{{\it\Omega}}$
.
For the TC simulations we employ a numerical code developed by Marc Avila and described in Meseguer et al. (Reference Meseguer, Avila, Mellibovsky and Marques2007). To accomplish large rotation numbers
 $R_{{\it\Omega}}\sim 0.6$
for radius ratios close to 1, both cylinders have to co-rotate rapidly and reach individual Reynolds numbers
 $Re_{i}$
and
 $Re_{o}$
of up to
 $6\times 10^{5}$
while maintaining the shear
 $Re_{S}=2\times 10^{4}$
. Since these high absolute velocities introduce numerical instabilities, we perform these simulation cases in a reference frame rotating with the angular velocity
 ${\it\Omega}_{rf}$
defined in (2.3). For the RPCF simulations we use Channelflow (Gibson, Halcrow & Cvitanović Reference Gibson, Halcrow and Cvitanović2008; Gibson Reference Gibson2012), a pseudospectral code developed by John F. Gibson that was modified to include the Coriolis force,
 $-R_{{\it\Omega}}\boldsymbol{e}_{z}\times \boldsymbol{u}$
. Both numerical codes use an expansion of the velocity field in Fourier modes in the two periodic directions and in Chebyshev polynomials in the wall-normal direction, and employ a semi-implicit scheme for the time stepping. We denote the highest order of modes employed in the streamwise, wall-normal and spanwise directions by
 $M_{x}$
,
 $M_{y}$
and
 $M_{z}$
, respectively.
The truncation error of the expansions can be assessed by the amplitudes of the highest modes
 $\widetilde{a}_{x}$
,
 $\widetilde{a}_{y}$
and
 $\widetilde{a}_{z}$
which are normalised by the globally strongest mode. Our resolution tests in Brauckmann & Eckhardt (Reference Brauckmann and Eckhardt2013a
) revealed that these amplitudes have to drop to
 ${\sim}\!10^{-4}$
for the Reynolds numbers
 $Re_{S}\sim 10^{4}$
simulated here, in order to reach a converged torque computation. All present simulations fulfil this criterion. It turned out that the resolution in the axial direction could be reduced for larger
 ${\it\eta}$
while maintaining
 $\widetilde{a}_{z}\lesssim 10^{-4}$
, cf. table 1. This seems plausible since the angular velocity gradients near the inner cylinder are steeper for small
 ${\it\eta}$
(Eckhardt et al.
Reference Eckhardt, Grossmann and Lohse2007b
) and thus require a higher resolution. Consequently, the viscous length scale at the inner cylinder
 ${\it\delta}_{{\it\nu},i}={\it\nu}/u_{{\it\tau},i}=\sqrt{{\it\eta}/(Re_{S}\,Nu_{{\it\omega}})}$
increases with
 ${\it\eta}$
so that the axial grid spacing in units of
 ${\it\delta}_{{\it\nu},i}$
remains at
 ${\rm\Delta}z^{+}\approx 4$
for the maximal
 $Nu_{{\it\omega}}$
-value at
 $Re_{S}=2\times 10^{4}$
. Nevertheless, we did not reduce the resolution in the radial direction for large
 ${\it\eta}$
so that the wall-normal grid spacing at the inner cylinder (
 ${\rm\Delta}y^{+}$
) decreases. Because of the non-uniform distribution of Chebyshev grid points, the wall-normal grid spacing at the centre increases by a factor of
 $49$
compared to the grid spacing at the inner cylinder (cf. table 1). The maximal streamwise grid spacing remains at
 ${\rm\Delta}x^{+}\approx 8$
. Overall, our spacings
 $({\rm\Delta}x^{+},{\rm\Delta}y^{+},{\rm\Delta}z^{+})$
at the inner cylinder are comparable to the ones used in other DNS of turbulent TCF (Bilson & Bremhorst Reference Bilson and Bremhorst2007; Pirrò & Quadrio Reference Pirrò and Quadrio2008). We furthermore note that the grid spacing measured in outer wall units
 ${\it\delta}_{{\it\nu},o}={\it\delta}_{{\it\nu},i}/{\it\eta}$
is
 ${\it\eta}$
-times smaller. Moreover, our simulations satisfy two additional convergence criteria described by Brauckmann & Eckhardt (Reference Brauckmann and Eckhardt2013a
): agreement of the torques computed at the inner and outer cylinder to within
 $0.5\,\%$
and agreement of the energy dissipation estimated from the torque and from the volume-averaged energy dissipation rate to within
 $1\,\%$
.
Similar to the difference between inner and outer wall units, the friction Reynolds numbers at the inner wall
 $Re_{{\it\tau},i}=u_{{\it\tau},i}d/(2{\it\nu})=\sqrt{{\it\eta}^{-1}Re_{S}\,Nu_{{\it\omega}}}/2$
and at the outer wall
 $Re_{{\it\tau},o}={\it\eta}Re_{{\it\tau},i}$
differ. The simulations for
 ${\it\eta}=0.5$
maximally reach
 $Re_{{\it\tau},i}=403$
and
 $Re_{{\it\tau},o}=201$
, while in our RPCF simulations the maximal friction Reynolds number is
 $Re_{{\it\tau}}=291$
at both walls.
3. Curvature effects and the radial structure of the flow
The first linear instability of TCF with counter-rotating cylinders is known to develop only in an annular region close to the inner cylinder while the outer region remains stable (Taylor Reference Taylor1923). Inviscid calculations predict that the boundary between these two regions is given by the neutral surface at the radius
 $r_{n}$
where the laminar Couette profile passes through
 $u_{{\it\varphi}}=0$
(Chandrasekhar Reference Chandrasekhar1961). However, already the observations by Taylor (Reference Taylor1923) as well as viscous calculations suggest that the structures from the inner region protrude beyond
 $r_{n}$
by a factor
 $a({\it\eta})$
. Esser & Grossmann (Reference Esser and Grossmann1996) found it to be in the range between
 $1.4$
and
 $1.6$
. Beyond the first instabilities, the initially stable outer region becomes susceptible to turbulent bursts at higher
 $Re_{S}\sim 2\times 10^{3}$
(Coughlin & Marcus Reference Coughlin and Marcus1996) which give rise to a radial partitioning of the turbulent flow that persists for much higher
 $Re_{S}$
: the coexistence of permanent turbulence in the inner region and intermittent turbulence in the outer one was observed for
 $Re_{S}\sim 10^{6}$
(van Gils et al.
Reference van Gils, Huisman, Grossmann, Sun and Lohse2012).
In Brauckmann & Eckhardt (Reference Brauckmann and Eckhardt2013b ) we argued that the intermittency in the outer region can only occur when the extended inner unstable region does not cover the entire gap. This resulted in the prediction
 $$\begin{eqnarray}{\it\mu}_{p}({\it\eta})=-{\it\eta}^{2}\,{\displaystyle \frac{(a-1)^{2}{\it\eta}+a^{2}-1}{(2a-1){\it\eta}+1}}\quad \text{with }a({\it\eta})=(1-{\it\eta})\left[\sqrt{{\displaystyle \frac{(1+{\it\eta})^{3}}{2(1+3{\it\eta})}}}-{\it\eta}\right]^{-1}\end{eqnarray}$$
for the critical rotation ratio,
 ${\it\mu}_{c}$
, so that flow partitioning occurs for
 ${\it\mu}<{\it\mu}_{c}<0$
. The intermittent dynamics in the outer region comes with a reduction in momentum transport and the formation of a maximum in torque as a function of
 ${\it\mu}$
. However, we already noted in our previous study that the bursting behaviour in the outer region is a curvature effect that will not appear for
 ${\it\eta}\rightarrow 1$
and, consequently, (3.1) will become invalid in this limit.
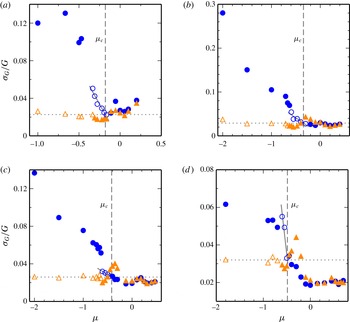
Standard deviation
 ${\it\sigma}_{G}$
(divided by the mean
 $G$
) of temporal torque fluctuations calculated at the outer cylinder (●, ○) and inner cylinder (▴, ▵) for a constant shear
 $Re_{S}=2\times 10^{4}$
and varying rotation ratio
 ${\it\mu}$
. The dotted line marks the base level for the fluctuations at the inner cylinder for strong counter-rotation (average of open triangles). The solid line is a linear fit to 6 points in (a), to 5 points in (b), to 4 points in (c) and to 3 points in (d) which are marked as open circles. The vertical dashed line indicates the intersection point
 ${\it\mu}_{c}$
that defines the onset of enhanced outer fluctuations. (a)
 ${\it\eta}=0.5$
; (b)
 ${\it\eta}=0.71$
; (c)
 ${\it\eta}=0.8$
; (d)
 ${\it\eta}=0.9$
.

In order to study what happens to the intermittency and the torque maximum, we characterize the stronger intermittent fluctuations in the outer region by the standard deviation
 ${\it\sigma}_{G}$
of the temporal torque fluctuations at the inner and outer cylinder for
 $Re_{S}=2\times 10^{4}$
. This previously enabled us to identify the onset of enhanced outer fluctuations as a function of
 ${\it\mu}$
for
 ${\it\eta}=0.5$
and
 $0.71$
(Brauckmann & Eckhardt Reference Brauckmann and Eckhardt2013b
). We here extend the analysis to
 ${\it\eta}=0.8$
and
 $0.9$
. In the previous study, the relative fluctuation amplitude
 ${\it\sigma}_{G}/G$
was assumed to be constant (i.e. independent of
 ${\it\mu}$
) at the inner cylinder. Therefore, the value of
 ${\it\sigma}_{G}/G$
at
 ${\it\mu}=0$
served as the reference value that the outer fluctuations exceed. However, since the data for
 ${\it\eta}=0.8$
and
 $0.9$
do not show constant inner fluctuations (figure 4
c,d), we here take the average inner fluctuations (
 ${\it\sigma}_{G}/G$
) for strong counter-rotation as the base level. Figure 4 shows that the outer torque fluctuations exceed this level when
 ${\it\mu}$
decreases below the critical value
 ${\it\mu}_{c}({\it\eta})$
. Similar to the procedure used in Brauckmann & Eckhardt (Reference Brauckmann and Eckhardt2013b
), we determine the critical values
 $$\begin{eqnarray}\displaystyle \left.\begin{array}{@{}r@{}}{\it\mu}_{c}(0.5)=-0.180\pm 0.014,\quad {\it\mu}_{c}(0.71)=-0.344\pm 0.050\\ {\it\mu}_{c}(0.8)=-0.418\pm 0.025,\quad {\it\mu}_{c}(0.9)=-0.488\pm 0.025\end{array}\right\} & & \displaystyle\end{eqnarray}$$
from the intersection of a linear fit to the outer fluctuations with the base level. For
 ${\it\eta}=0.5$
and
 $0.71$
, the re-evaluated onsets
 ${\it\mu}_{c}$
conform with the old values within the uncertainties. Note that the difference between the fluctuation amplitudes is less pronounced for
 ${\it\eta}=0.9$
than for
 ${\it\eta}\leqslant 0.8$
(cf. figure 4), as expected from the weaker curvature in the first case. Moreover, the enhanced outer fluctuations due to turbulent bursting clearly differ from the situation with stationary outer cylinder or with co-rotating cylinders (
 ${\it\mu}\geqslant 0$
) where the fluctuation amplitudes are similar for both cylinders.
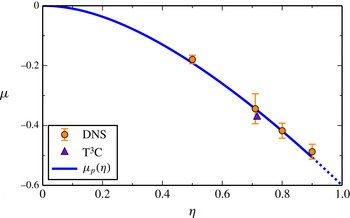
Onset of enhanced outer fluctuations. The critical rotation ratio
 ${\it\mu}_{c}({\it\eta})$
for the onset is shown as a function of the radius ratio
 ${\it\eta}$
. Numerical values for
 $Re_{S}=2\times 10^{4}$
are extracted from figure 4 and the value from the T
 $^{3}$
C-experiment (van Gils et al.
Reference van Gils, Huisman, Grossmann, Sun and Lohse2012) was deduced from a bimodal distribution of angular velocities. The line indicates the prediction
 ${\it\mu}_{p}({\it\eta})$
from (3.1). As the radial partitioning disappears for
 ${\it\eta}\rightarrow 1$
, we indicate the resulting uncertainty in the prediction by continuing the curve with dashes for
 ${\it\eta}\gtrsim 0.9$
.

Figure 5 shows that the prediction from (3.1) agrees well with the onset of fluctuations in DNS data for
 $Re_{S}=2\times 10^{4}$
(figure 4). Moreover,
 ${\it\mu}_{p}({\it\eta})$
also agrees with the critical rotation ratio for the occurrence of the bursting, detected as a bimodal distribution of angular velocities in the experiments of van Gils et al. (Reference van Gils, Huisman, Grossmann, Sun and Lohse2012) for
 ${\it\eta}=0.716$
.
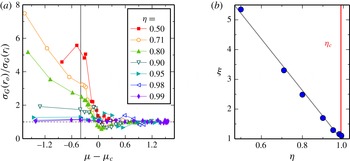
Enhanced outer fluctuations for
 $Re_{S}=2\times 10^{4}$
as a function of the radius ratio
 ${\it\eta}$
, assessed by the standard deviation of temporal torque fluctuations
 ${\it\sigma}_{G}$
. (a) Ratio of
 ${\it\sigma}_{G}$
computed at the outer and at the inner cylinder versus the shifted rotation ratio
 ${\it\mu}-{\it\mu}_{c}$
, where
 ${\it\mu}_{c}$
denotes the critical value for the onset of enhanced fluctuations from figure 5. For
 ${\it\eta}\geqslant 0.95$
,
 ${\it\mu}_{p}$
was subtracted instead of
 ${\it\mu}_{c}$
. (b) Typical fluctuation ratio
 ${\it\xi}={\it\sigma}_{G}(r_{o})/{\it\sigma}_{G}(r_{i})$
calculated by interpolation at
 ${\it\mu}-{\it\mu}_{c}=-0.4$
marked by the vertical line in (a). The diagonal line represents a best fit to the data and indicates the disappearance of the fluctuation asymmetry near
 ${\it\eta}_{c}=0.99\pm 0.01$
.

In figure 6(a), we extend the analysis of the torque fluctuation amplitudes to the low-curvature radius ratios
 ${\it\eta}=0.95$
,
 $0.98$
and
 $0.99$
. For the sake of visual clarity when comparing all investigated
 ${\it\eta}$
, we show the ratio between the standard deviation
 ${\it\sigma}_{G}$
at the outer and at the inner cylinder. A value greater than one indicates enhanced outer fluctuations. Moreover, the rotation ratio
 ${\it\mu}$
is shifted by the critical value
 ${\it\mu}_{c}$
in order to align the respective regions of enhanced outer fluctuations. The small difference in
 ${\it\sigma}_{G}$
for
 ${\it\eta}\geqslant 0.95$
is the reason why we omitted a similar analysis as in figure 4 for the three highest radius ratios. To quantify the fluctuation asymmetry for strong counter-rotation, we define a typical fluctuation ratio
 ${\it\xi}={\it\sigma}_{G}(r_{o})/{\it\sigma}_{G}(r_{i})$
at the shifted rotation ratio
 ${\it\mu}-{\it\mu}_{c}=-0.4$
for each radius ratio. Figure 6(b) shows that this asymmetry measure,
 ${\it\xi}$
, decreases monotonically with
 ${\it\eta}$
towards a value of 1, which signifies equal fluctuation strengths near the inner and outer cylinder. The fluctuation asymmetry vanishes for a radius ratio of
 ${\it\eta}_{c}=0.99\pm 0.01$
, which does not differ significantly from 1. This suggests that small differences between inner and outer cylinder turbulence exist for all
 ${\it\eta}<1$
. Therefore, in this case, curvature has an effect for any
 ${\it\eta}\neq 1$
.
The disappearance of the fluctuation asymmetry may also be related to the local stability properties of the flow. The results in figure 6 suggest that the separation into an unstable inner region and a stabilised outer region disappears as
 ${\it\eta}\rightarrow 1$
. However, the neutral surface for counter-rotation, where the velocity profile passes through zero, discriminates the stability regions and exists for all
 ${\it\eta}$
. Therefore, the radial partitioning has to vanish in a different way for
 ${\it\eta}\rightarrow 1$
, as we will see from local stability results. Eckhardt & Yao (Reference Eckhardt and Yao1995) investigated the evolution of local perturbations to the laminar Couette profile
 ${\it\omega}_{lam}(r)$
along Lagrangian trajectories. They calculated radially dependent eigenvalues
 $$\begin{eqnarray}{\it\lambda}_{\pm }(r)=-{\displaystyle \frac{1}{Re_{S}}}k_{1}^{2}(1+{\it\beta})\pm \left[-{\displaystyle \frac{2{\it\omega}_{lam}}{r}}\,\partial _{r}\left(r^{2}{\it\omega}_{lam}\right)\,{\displaystyle \frac{{\it\beta}}{1+{\it\beta}}}\right]^{1/2}\quad \text{with }{\it\beta}={\displaystyle \frac{k_{3}^{2}}{k_{1}^{2}}}\end{eqnarray}$$
for the perturbation modes with radial and axial wavenumbers
 $k_{1}$
and
 $k_{3}$
(see also the local stability results by Dubrulle (Reference Dubrulle1993)). Note that the
 ${\it\omega}_{lam}$
-dependent factor in the second term of (3.3) corresponds to Rayleigh’s stability discriminant. In the following, we focus on the largest (most unstable) eigenvalue that can be calculated for given
 $Re_{S}$
and
 ${\it\mu}$
by maximizing
 ${\it\lambda}_{+}(r)$
at the most unstable radial position
 $r=r_{i}$
. For that purpose, we minimize the viscous damping (first term in (3.3)) by selecting the smallest possible radial wavenumber
 $$\begin{eqnarray}k_{1}=\left\{\begin{array}{@{}ll@{}}{\rm\pi}/(r_{o}-r_{i}), & {\it\mu}\geqslant 0\\ {\rm\pi}/(r_{n}-r_{i}), & {\it\mu}<0\end{array}\right.\!\quad \text{with }r_{n}=r_{i}\,\sqrt{{\displaystyle \frac{1-{\it\mu}}{{\it\eta}^{2}-{\it\mu}}}}.\end{eqnarray}$$
Subsequently, we determine the wavenumber ratio
 ${\it\beta}_{max}$
that maximizes (3.3). With these optimal values for
 $k_{1}$
and
 ${\it\beta}$
, we study the radial variation of the largest eigenvalue
 $\widetilde{{\it\lambda}}_{+}$
.
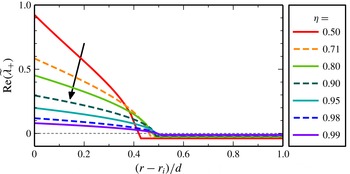
Radial dependence of the centrifugal instability for
 $Re_{S}=2\times 10^{4}$
and
 ${\it\mu}=-{\it\eta}$
(i.e.
 $R_{{\it\Omega}}=0$
) where the neutral surface is located in the centre of the cylinder gap. The real part of the largest eigenvalue
 $\widetilde{{\it\lambda}}_{+}$
from the local stability analysis along Lagrangian paths (Eckhardt & Yao Reference Eckhardt and Yao1995) is shown for various radius ratios
 ${\it\eta}$
. The radial partitioning of stability decreases with increasing
 ${\it\eta}\rightarrow 1$
(indicated by the arrow).

To analyse the local stability for strong counter-rotation, figure 7 shows radial profiles of
 $\widetilde{{\it\lambda}}_{+}$
for
 $Re_{S}=2\times 10^{4}$
and the specific rotation ratio
 ${\it\mu}=-{\it\eta}$
. This value is comparable to the value
 ${\it\mu}-{\it\mu}_{c}=-0.4$
used in the study of the fluctuation asymmetry in figure 6. The positive real part of the eigenvalue
 $\widetilde{{\it\lambda}}_{+}$
inside the neutral surface indicates instability in the inner region while the outer region is vicously damped. Most importantly, the radial variation of the local stability decreases with
 ${\it\eta}$
which is reminiscent of the disappearance of the radial differences in the fluctuation behaviour. With increasing
 ${\it\eta}$
, the eigenvalues move in opposite directions: in the inner region, they become less unstable and approach neutral stability from above, whereas in the outer region, they approach the neutral value from below.
The results of this section show that the radial partitioning of the flow that gives rise to enhanced outer fluctuations conforms with the prediction (3.1) for
 ${\it\eta}\leqslant 0.9$
. However, this curvature effect, as well as the radial variation of the local stability, disappear with vanishing curvature for
 ${\it\eta}\rightarrow 1$
. The disappearance of the intermittent bursts in the outer region is also relevant for an understanding of the variation of torque, since the appearance of these bursts has been linked to the emergence of a torque maximum (van Gils et al.
Reference van Gils, Huisman, Grossmann, Sun and Lohse2012; Brauckmann & Eckhardt Reference Brauckmann and Eckhardt2013b
). The absence of this intermittency should therefore change the variation of torque with rotation, as we now discuss.
4. Variation of the momentum transport
Variation of the momentum transport (
 $Nu_{{\it\omega}}$
) with changing mean rotation (
 $R_{{\it\Omega}}$
) calculated for the radius ratios
 ${\it\eta}$
specified in the panels. The simulations are performed for
 $Re_{S}=5\times 10^{3}$
(▪),
 $Re_{S}=10^{4}$
(●) and
 $Re_{S}=2\times 10^{4}$
(▴). The open symbols in ( f) show results from simulations of RPCF. Note the increased
 $R_{{\it\Omega}}$
-scale in (a) and (b).

We now turn to the rotation dependence of the mean torque with increasing
 $Re_{S}$
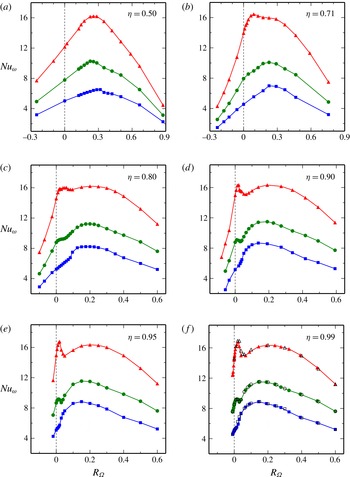
and with variations in radius ratio. Figure 8 shows the Nusselt number
 $Nu_{{\it\omega}}$
, the torque in units of its laminar value. For the wide-gap TC system with
 ${\it\eta}=0.5$
, the torque maximum initially occurs at
 $R_{{\it\Omega}}\sim 0.3$
for
 $Re_{S}=5\times 10^{3}$
and then shifts to
 $R_{{\it\Omega}}=0.26$
for
 $Re_{S}=2\times 10^{4}$
corresponding to
 ${\it\mu}=-0.20$
as analysed before (Brauckmann & Eckhardt Reference Brauckmann and Eckhardt2013b
; Merbold et al.
Reference Merbold, Brauckmann and Egbers2013). For
 ${\it\eta}=0.71$
this shift in the maximum is more pronounced, with
 $R_{{\it\Omega}}$
varying from
 $0.27$
at
 $Re_{S}=5\times 10^{3}$
to
 $0.11$
at
 $Re_{S}=2\times 10^{4}$
(figure 8
b). For even higher
 $Re_{S}$
, the experiments of Paoletti & Lathrop (Reference Paoletti and Lathrop2011) and van Gils et al. (Reference van Gils, Huisman, Bruggert, Sun and Lohse2011, Reference van Gils, Huisman, Grossmann, Sun and Lohse2012) show no further shift in the position of the torque maximum so that
 $R_{{\it\Omega}}=0.11$
is likely to be close to the asymptotic value for high
 $Re_{S}$
. As discussed in § 3, these high-
 $Re_{S}$
torque maxima for
 ${\it\eta}=0.5$
and
 $0.71$
coincide with the onset of intermittent bursts in the outer region.
The situation changes drastically for low-curvature TCF with
 ${\it\eta}\geqslant 0.9$
as shown in figure 8(d–f): instead of a single maximum, one notes a broad torque maximum near
 $R_{{\it\Omega}}=0.2$
and a second narrow maximum near
 $R_{{\it\Omega}}=0.02$
. This narrow maximum emerges with increasing shear and, at
 $Re_{S}=2\times 10^{4}$
, is similar in magnitude to the broad maximum. Indications for the narrow maximum were first seen by Ravelet et al. (Reference Ravelet, Delfos and Westerweel2010) in a low-curvature TC experiment (
 ${\it\eta}=0.917$
): their data show a very slight bump in the torque near
 $R_{{\it\Omega}}=0.02$
for
 $Re_{S}=1.4\times 10^{4}$
and
 $1.7\times 10^{4}$
and a monotonic increase with
 $R_{{\it\Omega}}$
for
 $R_{{\it\Omega}}\gtrsim 0.05$
. However, their figure 8 only shows torque measurements for
 $R_{{\it\Omega}}<0.125$
so that the broad maximum found here at
 $R_{{\it\Omega}}=0.2$
lies outside their investigated range. The presence of two maxima, a broad one and a narrow one that emerges with increasing
 $Re_{S}$
, was also observed in RPCF (Salewski & Eckhardt Reference Salewski and Eckhardt2015). They compare well to the
 $Nu_{{\it\omega}}$
maxima in low-curvature TCF as demonstrated for
 ${\it\eta}=0.99$
in figure 8( f).
Finally, the torque for
 ${\it\eta}=0.8$
(figure 8
c) shows a behaviour intermediate between that of the narrow-gap and the wide-gap TC systems. While the broad torque maximum known from systems with larger radius ratios is present, the second maximum around
 $R_{{\it\Omega}}=0.02$
is not as narrow and as clearly visible as for
 ${\it\eta}\geqslant 0.9$
. On the other hand, the extrapolation of (3.1), which captures the maximum for
 ${\it\eta}=0.5$
and
 $0.71$
, to the case
 ${\it\eta}=0.8$
predicts a maximum at
 ${\it\mu}_{p}=-0.419$
and
 $R_{{\it\Omega},p}=0.069$
. This is close to the low-curvature narrow maximum and suggests that the two will interfere. Indeed, the magnification in figure 9(b) of the region in
 $R_{{\it\Omega}}$
around the low-curvature narrow peak shows both, a slight maximum at
 $R_{{\it\Omega}}=0.02$
and a broader one around
 $R_{{\it\Omega}}=0.05$
.
Comparison of the momentum transport (
 $Nu_{{\it\omega}}$
) for various radius ratios as a function of the mean rotation (
 $R_{{\it\Omega}}$
) at
 $Re_{S}=2\times 10^{4}$
. The values are compensated with a scaling in
 $Re_{S}$
employing the scaling exponent measured by van Gils et al. (Reference van Gils, Huisman, Grossmann, Sun and Lohse2012). Panel (b) details the narrow maximum in (a). For purposes of clarity, the results for
 ${\it\eta}=0.98$
are only included in (b) where the ones for
 ${\it\eta}=0.5$
and
 ${\it\eta}=0.71$
are left out. The open stars labelled by
 ${\it\eta}=1.00$
show results from RPCF simulations. The inset in (a) compares our DNS results for
 ${\it\eta}=0.9$
to the T
 $^{3}$
C-experiment with
 ${\it\eta}=0.909$
and
 $Re_{S}$
of a few
 $10^{5}$
(Ostilla-Mónico et al.
Reference Ostilla-Mónico, Huisman, Jannink, Van Gils, Verzicco, Grossmann, Sun and Lohse2014a
) and reveals a slight shift of the maximum with increasing
 $Re_{S}$
from
 $R_{{\it\Omega}}=0.02$
to
 $R_{{\it\Omega}}=0.04$
.

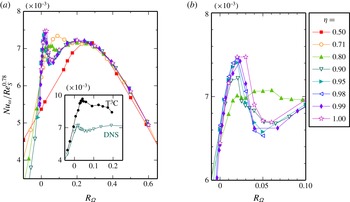
In figure 9, we show the torque as a function of the rotation number for various radius ratios. In order to compensate for the slightly different
 $Re_{S}$
of the compared torques, we use the observation by Dubrulle et al. (Reference Dubrulle, Dauchot, Daviaud, Longaretti, Richard and Zahn2005) that the torque variation can be decomposed into a scaling with
 $Re_{S}$
modulated by an amplitude that describes the dependence on
 $R_{{\it\Omega}}$
and we thus normalise the torques by
 $Re_{S}^{0.78}$
. For
 ${\it\eta}\geqslant 0.9$
, the Nusselt numbers for different radius ratios collapse. The figure also contains data from RPCF which also agree nicely with those of low-curvature TCF. Data collapse is also observed with other quantities. Dubrulle et al. (Reference Dubrulle, Dauchot, Daviaud, Longaretti, Richard and Zahn2005) previously noted that the torque
 $G$
normalized by its value for stationary outer cylinder
 $G({\it\mu}=0)$
varies only little with
 ${\it\eta}$
when plotted as function of
 $R_{{\it\Omega}}$
. Similarly, Paoletti et al. (Reference Paoletti, van Gils, Dubrulle, Sun, Lohse and Lathrop2012) found a collapse of another torque ratio
 $G/G(R_{{\it\Omega}}=0)$
as a function of
 $R_{{\it\Omega}}$
for various radius ratios. Our figure 9 shows that a normalisation by the laminar torque suffices to compensate for the curvature dependence and to achieve the collapse for
 ${\it\eta}\geqslant 0.9$
. Note that
 ${\it\mu}=0$
corresponds to
 $R_{{\it\Omega}}=1-{\it\eta}$
so that the normalisation by
 $G({\it\mu}=0)$
has an additional
 ${\it\eta}$
-dependence compared to the normalisation by
 $G(R_{{\it\Omega}}=0)$
. In all three cases, the collapse of the data is of similar quality and does not favour one particular normalisation. However, plots with respect to
 ${\it\mu}$
(not shown here) do not yield such a collapse, confirming that
 $R_{{\it\Omega}}$
is the appropriate parameter in which to describe the transition from TCF to RPCF.
For lower
 ${\it\eta}$
, the collapse of the torques is limited to the region
 $R_{{\it\Omega}}\gtrsim 0.1$
for
 ${\it\eta}=0.8$
and to
 $R_{{\it\Omega}}\gtrsim 0.25$
for
 ${\it\eta}=0.5$
and
 $0.71$
. For these rotation numbers, turbulent bursting does not occur in the outer region. For smaller
 $R_{{\it\Omega}}$
, where the bursting in the outer region occurs, the Nusselt numbers in figure 9(a) depend on
 ${\it\eta}$
, suggesting that only this radial flow partitioning introduces the strong curvature dependence of the torques. In conclusion, the impact of the global rotation (parametrised by
 $R_{{\it\Omega}}$
) on the turbulent momentum transport becomes independent of
 ${\it\eta}$
if the flow is not partly stabilised by counter-rotating the outer cylinder or if this curvature effect becomes negligible for large radius ratios.
Location
 ${\it\mu}_{max}$
of the torque maxima as a function of the curvature number
 $R_{C}=(1-{\it\eta})/\sqrt{{\it\eta}}$
. The open circles, triangles and squares summarise our numerical results for the detachment, broad and narrow maximum, respectively, at
 $Re_{S}=2\times 10^{4}$
from figure 9. The maximum locations
 ${\it\mu}_{max}$
were calculated from quadratic fits to the peaks in
 $Nu_{{\it\omega}}({\it\mu})$
, except for the narrow maximum for
 ${\it\eta}\geqslant 0.95$
, which is not well approximated by a parabola and therefore determined by the location of the largest data point. The small circles indicate the experimental results by Ostilla-Mónico et al. (Reference Ostilla-Mónico, Huisman, Jannink, Van Gils, Verzicco, Grossmann, Sun and Lohse2014a
) for
 $Re_{S}\sim 10^{5}{-}10^{6}$
. These are complemented by the prediction
 ${\it\mu}_{p}({\it\eta})$
from (3.1) (Brauckmann & Eckhardt Reference Brauckmann and Eckhardt2013b
) and by the angle bisector
 ${\it\mu}_{b}({\it\eta})$
by van Gils et al. (Reference van Gils, Huisman, Grossmann, Sun and Lohse2012). In addition, two
 ${\it\mu}({\it\eta})$
-lines for constant rotation number
 $R_{{\it\Omega}}=0.2$
and
 $R_{{\it\Omega}}=0.02$
are shown, corresponding to the broad and narrow torque maxima.

The position of the torque maxima for
 $Re_{S}=2\times 10^{4}$
and
 ${\it\eta}\geqslant 0.9$
, which in
 $R_{{\it\Omega}}$
is given by constant rotation numbers
 $R_{{\it\Omega}}=0.2$
and
 $R_{{\it\Omega}}=0.02$
, translates into
 ${\it\eta}$
-dependent rotation ratios
 ${\it\mu}$
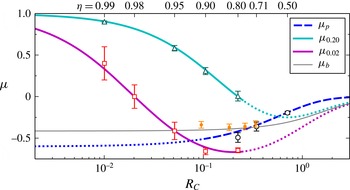
, which are represented by the thick solid lines in figure 10. The torque maximum locations
 ${\it\mu}_{max}$
from the DNS (triangles and squares) closely follow these lines for
 ${\it\eta}\geqslant 0.9$
. In particular, this reveals that for
 ${\it\eta}=0.99$
both the broad and the narrow torque maximum occur for co-rotating cylinders, i.e. for
 ${\it\mu}>0$
. Therefore, the narrow maximum cannot be related to the detachment mechanism that causes the torque maximum at counter-rotation for
 ${\it\eta}=0.5$
and
 $0.71$
. For the latter radius ratios, the maximum location
 ${\it\mu}_{max}$
agrees with the predictive line
 ${\it\mu}_{p}({\it\eta})$
in figure 10. Finally, the intermediate radius ratio
 ${\it\eta}=0.8$
shows indications of all three torque maxima close to the lines in figure 10, with the detachment and the narrow maximum lying close together and being not as pronounced as the broad maximum, cf. figure 9.
In addition, figure 10 shows the torque maxima identified for various radius ratios in experiments at much higher Reynolds numbers (Ostilla-Mónico et al.
Reference Ostilla-Mónico, Huisman, Jannink, Van Gils, Verzicco, Grossmann, Sun and Lohse2014a
). While the maximum positions
 ${\it\mu}_{max}$
for
 ${\it\eta}=0.714$
,
 $0.769$
and
 $0.833$
conform with the trend of the detachment maximum, the one for
 ${\it\eta}=0.909$
clearly deviates from both
 ${\it\mu}_{p}$
and our simulations; this will be discussed in detail at the end of this section. Moreover, the angle bisector line
 ${\it\mu}_{b}({\it\eta})$
, that was suggested by van Gils et al. (Reference van Gils, Huisman, Grossmann, Sun and Lohse2012) for the position of the maximum
 ${\it\mu}_{max}$
, lies close to the experimental torque maxima. However,
 ${\it\mu}_{b}({\it\eta})$
clearly deviates from the torque maximum for
 ${\it\eta}=0.5$
(Merbold et al.
Reference Merbold, Brauckmann and Egbers2013) and differs in its functional behaviour for
 ${\it\eta}\rightarrow 1$
from our DNS results.
For the range of shear Reynolds numbers
 $Re_{S}\sim 10^{4}$
investigated here, the rotation dependence of the torque significantly changes with increasing
 $Re_{S}$
, cf. figure 8. It is likely that this transformation process continues beyond
 $Re_{S}=2\times 10^{4}$
. However, concerning the detachment torque maximum for
 ${\it\eta}=0.5$
and
 $0.71$
it was shown that, after an initial transformation with increasing shear, the rotation dependence of the simulated torques at
 $Re_{S}=2\times 10^{4}$
already compares well to experimental torque measurements at much higher
 $Re_{S}\sim 10^{5}{-}10^{6}$
(Merbold et al.
Reference Merbold, Brauckmann and Egbers2013; Brauckmann & Eckhardt Reference Brauckmann and Eckhardt2013a
). On the other hand, concerning the two torque maxima in low-curvature TCF (
 ${\it\eta}\gtrsim 0.9$
), Ostilla-Mónico et al. (Reference Ostilla-Mónico, Huisman, Jannink, Van Gils, Verzicco, Grossmann, Sun and Lohse2014a
) find in their torque measurements for
 ${\it\eta}=0.833$
and
 $0.909$
that the power-law exponent
 ${\it\gamma}$
of the torque scaling
 $Nu_{{\it\omega}}\sim Re_{S}^{{\it\gamma}}$
depends on the system rotation for
 $Re_{S}$
below a few
 $10^{5}$
, which indicates that the transformation of the rotation dependence still continues up to
 $Re_{S}\sim 10^{5}$
. As regards the second narrow torque maximum, we expect that it grows further in relation to the broad maximum for
 $Re_{S}>2\times 10^{4}$
and that this may shift the torque-maximising rotation number slightly.
The torque maximum from the experiment at
 ${\it\eta}=0.909$
and
 $Re_{S}$
above
 $10^{5}$
(Ostilla-Mónico et al.
Reference Ostilla-Mónico, Huisman, Jannink, Van Gils, Verzicco, Grossmann, Sun and Lohse2014a
) supports this assumption as shown in the inset of figure 9(a) which compares experiment and DNS: the experimental torque-maximising rotation ratio
 ${\it\mu}_{max}=-0.34$
corresponds to
 $R_{{\it\Omega}}=0.04$
which only slightly deviates from
 $R_{{\it\Omega}}=0.02$
for the narrow maximum at lower
 $Re_{S}=2\times 10^{4}$
. In conclusion, apart from small changes with
 $Re_{S}$
, our simulations already capture the beginning of the general turbulent behaviour at much higher shear rates.
4.1. Torque due to vortical motion
In this and the following sections, we investigate the momentum transport characteristics that underlie the rotation dependence of the Nusselt number discussed above. Vortical motions, such as Taylor vortices and their turbulent remnants, are known to effectively contribute to this transport by moving fast fluid from the inner cylinder outwards and slow outer fluid inwards. Their effects on the turbulence have been discussed previously (Lathrop et al.
Reference Lathrop, Fineberg and Swinney1992; Lewis & Swinney Reference Lewis and Swinney1999; Martínez-Arias et al.
Reference Martínez-Arias, Peixinho, Crumeyrolle and Mutabazi2014). Brauckmann & Eckhardt (Reference Brauckmann and Eckhardt2013b
) quantified the link of the vortical motion to the torque and found that the torque contribution of the mean vortical motion was largest near the torque maximum. Flow visualizations of DNS by Salewski & Eckhardt (Reference Salewski and Eckhardt2015) show distinct vortical states which underlie the narrow and broad maxima for RPCF. Furthermore, using experiments at
 $Re_{S}\sim 10^{6}$
(Huisman et al.
Reference Huisman, van der Veen, Sun and Lohse2014) and DNS at
 $Re_{S}\sim 10^{5}$
(Ostilla-Mónico et al.
Reference Ostilla-Mónico, van der Poel, Verzicco, Grossmann and Lohse2014b
), these structures have been detected over a range of rotation numbers where their presence is associated with a single torque maximum.
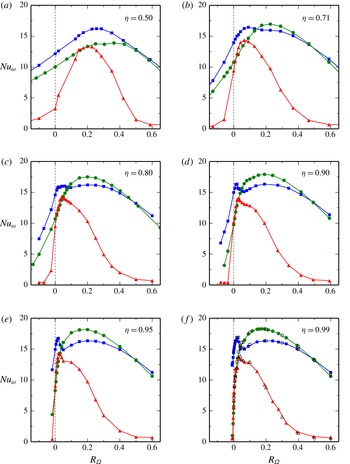
To investigate the effects of vortical structures on the torque, we first extract the mean vortical motion underlying the turbulence in the full simulation and measure its contribution to the momentum transport. The mean vortices consist of temporally and streamwise-averaged turbulent Taylor vortices and are analogous to the ‘large-scale circulation’ found in turbulent Rayleigh–Bénard convection (Ahlers, Grossmann & Lohse Reference Ahlers, Grossmann and Lohse2009). Next, since Taylor vortices do not depend on the streamwise direction, we also consider the torque which results from streamwise-independent flow. We then summarize our results in figure 11.
Comparison of the total torque
 $G$
(▪) to the torque that results from the streamwise-invariant flow
 $G_{2D}$
(●) and to the torque due to the mean flow
 $\overline{G}$
(▴) for
 $Re_{S}=2\times 10^{4}$
. All torques are measured in units of the laminar torque
 $G_{lam}$
giving Nusselt numbers
 $Nu_{{\it\omega}}$
. The open symbols in ( f) show corresponding results from RPCF simulations.

4.1.1. Mean vortical motion
We follow the procedure introduced in Brauckmann & Eckhardt (Reference Brauckmann and Eckhardt2013b
) and decompose the flow of the full DNS into a mean contribution
 $\overline{\boldsymbol{u}}=\langle \boldsymbol{u}\rangle _{{\it\varphi},t}$
(or
 $\overline{\boldsymbol{u}}=\langle \boldsymbol{u}\rangle _{x,t}$
for RPCF) that includes the mean vortical motion in the
 $rz$
-plane (
 $yz$
-plane) and into the turbulent fluctuations around these mean vortices
 $\boldsymbol{u}^{\prime \prime }=\boldsymbol{u}-\overline{\boldsymbol{u}}$
, similar to the triple decomposition by Reynolds & Hussain (Reference Reynolds and Hussain1972). Substituting this velocity decomposition into the angular-momentum flux (2.12) results in a separation of the torque into a contribution that is caused by the mean vortical motion
 $\overline{G}$
and a second contribution that is due to turbulent fluctuations
 $G^{\prime \prime }$
, i.e.
 $G=\overline{G}+G^{\prime \prime }$
with
 $$\begin{eqnarray}\displaystyle \left.\begin{array}{@{}c@{}}\overline{G}={\displaystyle \frac{Re_{S}^{2}}{r_{2}-r_{1}}}\displaystyle \int _{r_{1}}^{r_{2}}(\langle \overline{u}_{r}\overline{\mathscr{L}}\rangle _{{\it\varphi}z,t}-Re_{S}^{-1}r^{2}\partial _{r}\langle \overline{{\it\omega}}\rangle _{{\it\varphi}z,t})\,r\,\text{d}r,\\ G^{\prime \prime }={\displaystyle \frac{Re_{S}^{2}}{r_{2}-r_{1}}}\displaystyle \int _{r_{1}}^{r_{2}}\langle u_{r}^{\prime \prime }\mathscr{L}^{\prime \prime }\rangle _{{\it\varphi}z,t}\,r\,\text{d}r.\end{array}\right\} & & \displaystyle\end{eqnarray}$$
Analogous expressions for the decomposition of the driving force into
 $F=\overline{F}+F^{\prime \prime }$
can be obtained for RPCF by substituting the velocity decomposition into the momentum flux (2.15). To capture the correct amplitude of the turbulent Taylor vortices, we fix their spanwise position during the temporal average of
 $\overline{\boldsymbol{u}}$
and in (4.1) by correcting a potential spanwise drift. Such a drift would lead to a cancellation of the large-scale motion over time, even though it might be strong. To this end, for each flow snapshot we calculate an axial profile of the radial velocity
 $\widetilde{u}_{r}(z)$
(or
 $\widetilde{u}_{y}(z)$
for RPCF), which was averaged downstream and radially in the central region, and determine the axial shift
 $z_{0}$
that minimizes the distance of the function
 $\sqrt{2}\langle \widetilde{u}_{r}\rangle _{rms}\cos [2{\rm\pi}(z-z_{0})/L_{z}]$
to the profile
 $\widetilde{u}_{r}(z)$
. The flow field is then axially shifted by
 $z_{0}$
. Note that while the total transport
 $G$
is constant over
 $r$
, the individual terms in (4.1) vary with the radius. This motivates the additional radial average in (4.1) in order to quantify the typical strength of the torque contributions. Since we are interested in the mean vortical motion which dominates in the central region and not in the boundary layers, we restrict this average to the range between
 $(r_{1}-r_{i})/d=1/4$
and
 $(r_{2}-r_{i})/d=3/4$
.
In figure 11, the torque due to the mean vortical motion
 $\overline{G}$
is compared to the total torque
 $G$
. For all cases,
 $\overline{G}$
exhibits a maximum. For
 ${\it\eta}\geqslant 0.8$
and RPCF, the maximum of
 $\overline{G}$
, where the momentum transport by the mean vortices is most effective, nearly coincides with the narrow maximum of the total torque
 $G$
. Moreover, it is apparent that a distinct narrow peak also occurs in mean-vortex torque
 $\overline{G}$
for large
 ${\it\eta}$
. This suggests that the narrow, high-
 $Re_{S}$
maximum is linked to efficient mean vortices. For lower radius ratios, i.e.
 ${\it\eta}=0.5$
and
 $0.71$
, the coincidence between the maxima in
 $\overline{G}$
and
 $G$
is not as significant; nevertheless, as the analysis in Brauckmann & Eckhardt (Reference Brauckmann and Eckhardt2013b
) demonstrates, this coincidence does exist for
 ${\it\eta}=0.5$
and
 $0.71$
when the radial average in (4.1) covers the complete radial gap instead of the central region. Finally, the mean-vortex torques
 $\overline{G}$
in figure 11 reveal that the mean Taylor vortices occur and grow in strength for
 $R_{{\it\Omega}}>0$
as previously observed in the experiment by Ravelet et al. (Reference Ravelet, Delfos and Westerweel2010).
4.1.2. Importance of streamwise-invariant structures
We perform simulations that force the flow to be invariant in the downstream direction by taking no Fourier mode in the
 ${\it\varphi}$
-direction (
 $x$
-direction for RPCF). For TCF this corresponds to axisymmetric simulations. Note that this procedure differs from 2-D simulations in a cross-section because three velocity components are still active, but only spatial variations in two directions (wall-normal and spanwise) are allowed. Since the Reynolds numbers are well above the linear instability of TCF and RPCF, even the axisymmetric flow is chaotic and typically comprises one vortex pair. These simulations of streamwise-invariant vortical flow result in torques, denoted as
 $G_{2D}$
, that we compare to the total torques
 $G$
in figure 11. The torque
 $G_{2D}$
also shows a broad maximum, which has an
 ${\it\eta}$
-dependent shift in its location: for
 ${\it\eta}\sim 1$
, the maximum is at
 $R_{{\it\Omega}}=0.18$
; and for
 ${\it\eta}=0.5$
, it is near
 $R_{{\it\Omega}}=0.35$
. For some radius ratios, namely
 ${\it\eta}=0.8$
,
 ${\it\eta}=0.9$
, this places the
 $G_{2D}$
-maximum at nearly the same
 $R_{{\it\Omega}}$
as the broad maximum in the total torque; however, the streamwise-invariant simulations overestimate the amplitude of the maximum. In fact, for
 ${\it\eta}\geqslant 0.8$
and RPCF, the
 $G_{2D}$
-maximum resembles the broad maximum in the total torque. Furthermore, it also appears to agree with the plateau that occurs in the total torque beside the actual torque maximum for
 ${\it\eta}=0.71$
(figure 11
b). This suggests that the plateau for
 $Re_{S}=2\times 10^{4}$
, as well as the broad maximum at lower
 $Re_{S}$
(cf. figure 8
b), follow from the same mechanism that causes the broad maximum for
 ${\it\eta}\geqslant 0.8$
.
The analysis reveals several features of the contribution of vortical motion to the torque for different degrees of curvature. The streamwise-averaged mean flow (
 $\overline{G}$
) appears to reproduce the narrow torque maximum, but this is not reflected by the streamwise-invariant flow (
 $G_{2D}$
). This seems to be counterintuitive when considering that
 $\overline{\boldsymbol{u}}$
is streamwise invariant like the simulations underlying
 $G_{2D}$
, but neither the detachment maximum in the total torque for
 ${\it\eta}\leqslant 0.8$
nor the narrow maximum for
 ${\it\eta}\geqslant 0.8$
occur in the torques from the streamwise-invariant simulations. As a consequence, these maxima must arise from more complicated flows which allow for streamwise fluctuations and cause an additional increase of the momentum transport. The reasons for the strong momentum transport differ between the broad and narrow torque maximum as will be discussed in § 5.3.
5. Flow characterisation
In § 4 we discussed that the momentum transport converges to a universal behaviour for the low-curvature TCF (
 ${\it\eta}\geqslant 0.9$
), in that the rotation dependence becomes independent of
 ${\it\eta}$
. Furthermore, the dependence on
 $R_{{\it\Omega}}$
agrees with that observed in RPCF. In the following, we analyse how the convergence for
 ${\it\eta}\geqslant 0.9$
to RPCF extends to other flow characteristics such as mean profiles and turbulent fluctuations.
5.1. Angular momentum profiles
Profiles of the rescaled specific angular momentum
 $\widetilde{\mathscr{L}}=\left(\langle \mathscr{L}\rangle -\mathscr{L}_{o}\right)/\left(\mathscr{L}_{i}-\mathscr{L}_{o}\right)$
for
 $Re_{S}=2\times 10^{4}$
, the rotation numbers
 $R_{{\it\Omega}}$
specified in the figures and six different radius ratios. The corresponding RPCF profile
 $\langle u_{x}\rangle -R_{{\it\Omega}}y$
rescaled to the interval
 $[0,1]$
is shown by the dots. Each figure contains profiles for
 ${\it\eta}=0.5$
,
 $0.71$
,
 $0.8$
,
 $0.9$
,
 $0.95$
and
 $0.99$
as listed in (d). Some of the profiles collapse, especially in panels (c) and (d). In (a) and (b) the profile centre level decreases monotonically with increasing
 ${\it\eta}\rightarrow 1$
. The dotted line shows the arithmetic mean angular momentum
 $\widetilde{\mathscr{L}}=0.5$
.

Here, we analyse the mean profiles of the specific angular momentum
 $\mathscr{L}=ru_{{\it\varphi}}$
which is radially transported between the cylinders. To compensate for the varying mean system rotation, we show rescaled profiles
 $\widetilde{\mathscr{L}}=\left(\langle \mathscr{L}\rangle -\mathscr{L}_{o}\right)/\left(\mathscr{L}_{i}-\mathscr{L}_{o}\right)$
in figure 12 where
 $\mathscr{L}_{i}$
and
 $\mathscr{L}_{o}$
denote the specific angular momentum of the inner and outer cylinder. As a result, the profiles for various radius ratios
 ${\it\eta}$
at the same rotation number
 $R_{{\it\Omega}}$
collapse as long as the flow is not subject to the radial partitioning of stability for moderate counter-rotation (cf. § 3): the rotation number
 $R_{{\it\Omega}}=0.5$
corresponds to co-rotation (
 ${\it\mu}\geqslant 0$
) for all investigated
 ${\it\eta}$
, and all profiles of
 $\widetilde{\mathscr{L}}$
in figure 12(d) collapse well. However at
 $R_{{\it\Omega}}=0.2$
, only the simulation for
 ${\it\eta}=0.5$
with
 ${\it\mu}=-0.22$
shows the bursting in the outer region and a deviating profile in figure 12(c). Similarly, at
 $R_{{\it\Omega}}=0.02$
(figure 12
b), the profiles for
 ${\it\eta}\leqslant 0.9$
with
 ${\it\mu}$
-values in the bursting regime clearly deviate from the profiles for
 ${\it\eta}=0.95$
and
 $0.99$
with
 ${\it\mu}>{\it\mu}_{p}$
which are closer together. Finally, no collapse is observed for
 $R_{{\it\Omega}}=0$
which always corresponds to exact counter-rotation. In addition, figure 12 shows
 $u_{x}$
profiles from RPCF with the system rotation subtracted, i.e.
 $\langle u_{x}\rangle -R_{{\it\Omega}}y$
, that agree well with the collapsed
 $\widetilde{\mathscr{L}}$
profiles from TCF when rescaled to the same interval. The reason for this correspondence between
 $\langle u_{x}\rangle -R_{{\it\Omega}}y$
in RPCF and the angular momentum profiles in TCF will be discussed in the next section.
The
 $\widetilde{\mathscr{L}}$
profiles tend toward a universal shape for increasing
 $R_{{\it\Omega}}$
, as the radial partitioning of stability disappears. The specific angular momentum in the centre becomes nearly flat (with a slightly positive slope) and approaches
 $\widetilde{\mathscr{L}}=0.5$
which corresponds to
 $\langle \mathscr{L}\rangle =(\mathscr{L}_{i}+\mathscr{L}_{o})/2$
and indicates that the angular momentum is well mixed. Already Wendt (Reference Wendt1933) noted that in the unstable regime the angular momentum becomes almost constant in the centre which was also repeatedly observed for the case of a stationary outer cylinder (Taylor Reference Taylor1935; Wattendorf Reference Wattendorf1935; Smith & Townsend Reference Smith and Townsend1982; Lewis & Swinney Reference Lewis and Swinney1999; Dong Reference Dong2007). Flat
 $\mathscr{L}$
profiles resemble the situation in Rayleigh–Bénard convection where the transport of heat results in a well-mixed temperature in the bulk (Tilgner, Belmonte & Libchaber Reference Tilgner, Belmonte and Libchaber1993; Kerr Reference Kerr1996; Brown & Ahlers Reference Brown and Ahlers2007; Ahlers et al.
Reference Ahlers, Bodenschatz, Funfschilling, Grossmann, He, Lohse, Stevens and Verzicco2012).
5.2. Mixing of angular momentum and neutral stability
The observation that the specific angular momentum
 $\mathscr{L}=ru_{{\it\varphi}}$
becomes almost flat in the middle is remarkable and calls for an explanation. Moreover, it is of interest whether an analogous phenomenon can be found in RPCF. To address both questions, we will study the stability properties of the mean profile around which the turbulence fluctuates. As long as the mean profile (
 $\langle {\it\omega}\rangle (r)$
in TCF and
 $\langle u_{x}\rangle (y)$
in RPCF) is unstable due to a strong a gradient in the centre, it further enforces turbulence which increases the mixing of angular (or linear) momentum; the mixing flattens and therefore re-stabilises the profile. However, a stable, low-gradient profile decreases turbulent mixing, so that the profile becomes steeper and eventually unstable again. Therefore, we assume that both processes balance in the statistically averaged sense and the mean turbulent profile becomes neutrally stable in the centre.
For TCF with stationary outer cylinder, Wattendorf (Reference Wattendorf1935) and Taylor (Reference Taylor1935) already noted that the mean angular momentum profile in the middle tends towards one of neutral stability according to Rayleigh’s inviscid criterion (Rayleigh Reference Rayleigh1917), which predicts a constant angular momentum profile for this case. Neglecting viscous effects in the central part of the flow becomes justifiable at high Reynolds numbers. The flat
 $\widetilde{\mathscr{L}}$
profiles in figure 12 indeed realise Rayleigh’s neutral stability criterion in the centre, thus supporting the aforementioned assumptions. More precisely, Rayleigh’s discriminant for neutral stability (Chandrasekhar Reference Chandrasekhar1961) reads
 $$\begin{eqnarray}\displaystyle 0\equiv {\displaystyle \frac{2\langle {\it\omega}\rangle }{r}}\,\partial _{r}\left(r^{2}\langle {\it\omega}\rangle \right) & \hspace{-2.5pt}=\hspace{-2.5pt} & \displaystyle \left(R_{{\it\Omega}}-1+{\displaystyle \frac{\widetilde{r}^{\,2}}{r^{2}}}\right){\displaystyle \frac{1}{r}}\partial _{r}\langle \mathscr{L}\rangle\end{eqnarray}$$
 $$\begin{eqnarray}\displaystyle & \hspace{-2.5pt}=\hspace{-2.5pt} & \displaystyle \left(R_{{\it\Omega}}-1+{\displaystyle \frac{\widetilde{r}^{\,2}}{r^{2}}}\right)\left(R_{{\it\Omega}}-1+{\displaystyle \frac{\widetilde{r}^{\,2}}{r^{2}}}+r\partial _{r}\langle {\it\omega}\rangle \right),\end{eqnarray}$$
here expressed so that it serves as a condition for a neutrally stable turbulent mean profile in either
 $\mathscr{L}$
or
 ${\it\omega}$
in the middle. For that purpose, we substituted the mean profile
 $\langle {\it\omega}\rangle$
by the laminar solution
 ${\it\omega}_{lam}(r)$
from (2.9) because in the centre
 ${\it\omega}_{lam}$
provides a reasonable approximation to the magnitude of the turbulent mean profile as evidenced by the comparison in Brauckmann & Eckhardt (Reference Brauckmann and Eckhardt2013a
). Since in the middle
 $r$
is close to the geometric radius
 $\widetilde{r}=\sqrt{r_{i}r_{o}}/d$
, equation (5.2) implies that
 $r\partial _{r}\langle {\it\omega}\rangle \approx -R_{{\it\Omega}}$
for
 $R_{{\it\Omega}}\neq 0$
. Ostilla et al. (Reference Ostilla, Stevens, Grossmann, Verzicco and Lohse2013) obtained a similar linear relationship by assuming that the Coriolis force term balances the convective term in the
 ${\it\varphi}$
-component of the equations of motion (2.5). Equations (5.1) and (5.2) then show that both force balance (Ostilla et al.
Reference Ostilla, Stevens, Grossmann, Verzicco and Lohse2013) and inviscid stability (Rayleigh Reference Rayleigh1917) predict a profile with flat angular momentum.
The equivalent stability formulation in RPCF was derived from an analogy between rotating shear flows and buoyant flows (Bradshaw Reference Bradshaw1969; Tritton Reference Tritton1992): the stability expressed by a quantity similar to the Richardson number in stratified flows results in the neutral stability condition
 $$\begin{eqnarray}R_{{\it\Omega}}\left(R_{{\it\Omega}}-\partial _{y}\langle u_{x}\rangle \right)\equiv 0,\end{eqnarray}$$
which is approximately contained in (5.2) since
 $\widetilde{r}/r\approx 1$
in the middle, and
 $r\partial _{r}\langle {\it\omega}\rangle$
corresponds to
 $-\partial _{y}\langle u_{x}\rangle$
. The difference in sign originates from the fact that the radial coordinate in TCF is antiparallel to the wall-normal coordinate in RPCF, cf. figure 1. For RPCF we also assume that the turbulent mean profile in the middle becomes neutrally stable and fulfils (5.3), as proposed previously by Suryadi et al. (Reference Suryadi, Segalini and Alfredsson2014). In conclusion, the negative profile slope
 $-\partial _{y}\langle u_{x}\rangle$
in RPCF corresponds to the angular velocity gradient
 $r\partial _{r}\langle {\it\omega}\rangle$
in TCF. Moreover, comparing (5.3) to (5.1) reveals that the combination
 $(R_{{\it\Omega}}-\partial _{y}\langle u_{x}\rangle )$
in RPCF plays the role of the angular momentum gradient
 $r^{-1}\partial _{r}\langle \mathscr{L}\rangle$
in TCF, and we therefore compare the modified RPCF profile
 $\langle u_{x}\rangle -R_{{\it\Omega}}y$
to the angular momentum profiles in figure 12.
Profile gradients in the middle region versus the rotation number
 $R_{{\it\Omega}}$
for
 $Re_{S}=2\times 10^{4}$
and various radius ratios
 ${\it\eta}$
. (a) Radial gradient of the angular momentum profile
 $\langle \mathscr{L}\rangle$
in TCF and the corresponding quantity
 $(R_{{\it\Omega}}-\partial _{y}\langle u_{x}\rangle )$
in RPCF, (b) gradient of the angular velocity profile
 $\langle {\it\omega}\rangle$
in TCF and the negative downstream velocity gradient
 $-\partial _{y}\langle u_{x}\rangle$
in RPCF, (c) detail of the maximum in (b). The black dashed line in (b) indicates the estimate
 $r\partial _{r}\langle {\it\omega}\rangle =-\partial _{y}\langle u_{x}\rangle =-R_{{\it\Omega}}$
from the neutral stability conditions (5.2) and (5.3). All gradients are calculated by averaging the compensated profile derivative
 $r^{-1}\partial _{r}\langle \mathscr{L}\rangle$
or
 $r\partial _{r}\langle {\it\omega}\rangle$
over the central region
 $(r-r_{i})/d\in [0.4,0.6]$
.

To test the assumption of neutrally stable mean profiles, the dependence of the profile gradients on
 $R_{{\it\Omega}}$
, and the proposed analogies between TCF and RPCF, we evaluate the relevant profile gradients in the central region for
 $Re_{S}=2\times 10^{4}$
and various radius ratios. Figure 13(a) shows that the specific angular momentum becomes almost flat with a slightly positive slope for
 $R_{{\it\Omega}}\gtrsim 0.02$
, except for
 ${\it\eta}=0.5$
where
 $\mathscr{L}$
is well mixed only for
 $R_{{\it\Omega}}\gtrsim 0.1$
. Experiments show that the slightly positive angular momentum slope persists for much higher
 $Re_{S}$
(Smith & Townsend Reference Smith and Townsend1982; Lewis & Swinney Reference Lewis and Swinney1999). In addition, for most
 $R_{{\it\Omega}}>0$
, the profile slopes measured by
 $r^{-1}\partial _{r}\langle \mathscr{L}\rangle$
collapse for different
 ${\it\eta}$
, which demonstrates the universality of the weak
 $R_{{\it\Omega}}$
-dependence. Furthermore, the quantity
 $(R_{{\it\Omega}}-\partial _{y}\langle u_{x}\rangle )$
from RPCF also shows this high level of agreement expected from the neutral stability analogy (5.1) and (5.3). In contrast, the profile gradients for
 $R_{{\it\Omega}}<0$
(
 $R_{{\it\Omega}}<0.1$
for
 ${\it\eta}=0.5$
) clearly vary with the radius ratio. For these rotation numbers, a pronounced stable region exists which introduces a strong curvature dependence as discussed for the torques in § 4.
The flattening of the specific angular momentum implies that the angular velocity gradients depend on
 $R_{{\it\Omega}}$
as shown in figure 13(b,c) and in similar figures in Ostilla-Mónico et al. (Reference Ostilla-Mónico, Huisman, Jannink, Van Gils, Verzicco, Grossmann, Sun and Lohse2014a
). In the unstable regime with
 $R_{{\it\Omega}}>0$
, the profile slopes
 $r\partial _{r}\langle {\it\omega}\rangle$
approach the neutral stability estimate
 $r\partial _{r}\langle {\it\omega}\rangle =-\partial _{y}\langle u_{x}\rangle =-R_{{\it\Omega}}$
as
 ${\it\eta}$
tends to 1. Moreover for low-curvature TCF (
 ${\it\eta}\gtrsim 0.9$
), they coincide with the
 $u_{x}$
-profile gradients in RPCF which supports the proposed analogy between
 $\langle {\it\omega}\rangle$
and
 $\langle u_{x}\rangle$
. The approximate scaling
 $\partial _{y}\langle u_{x}\rangle \sim R_{{\it\Omega}}$
in RPCF conforms with observations by Bech & Andersson (Reference Bech and Andersson1997) and Suryadi et al. (Reference Suryadi, Segalini and Alfredsson2014). However for smaller
 ${\it\eta}$
, the
 $\langle {\it\omega}\rangle$
-gradients depend more strongly on the curvature than the
 $\langle \mathscr{L}\rangle$
-gradients, consistent with the additional radial dependence in condition (5.2). Furthermore, we note that a slight local super-rotation (corresponding to a shear-inversion in RPCF) occurs in the central region for
 $R_{{\it\Omega}}\approx 0.03$
as detailed in figure 13(c). This inversion may result from an efficient momentum transport by the large-scale vortices moving fast fluid from the inner wall outwards and slow fluid inwards. The maximum in the mean vortex torque
 $\overline{G}$
around
 $R_{{\it\Omega}}\approx 0.03$
indeed supports this picture, cf. figure 11.
For the low-curvature TCF with
 ${\it\eta}\gtrsim 0.9$
, the flattest
 ${\it\omega}$
-profile (i.e. maximum in
 $r\partial _{r}\langle {\it\omega}\rangle$
) and the narrow torque maximum occur for almost the same rotation number (
 $R_{{\it\Omega}}\approx 0.03$
versus
 $0.02$
) which extends an observation in Ostilla-Mónico et al. (Reference Ostilla-Mónico, Huisman, Jannink, Van Gils, Verzicco, Grossmann, Sun and Lohse2014a
) for
 ${\it\eta}\leqslant 0.909$
to larger radius ratios and to the limiting case of RPCF, where the flattest
 $u_{x}$
-profile is linked to the narrow maximum in
 $Nu_{u}$
. This connection also exists for
 ${\it\eta}=0.8$
, thus supporting the independence of the narrow maximum at
 $R_{{\it\Omega}}=0.02$
from the detachment maximum at
 $R_{{\it\Omega}}=0.05$
. For
 ${\it\eta}=0.5$
and
 ${\it\eta}=0.71$
the
 $R_{{\it\Omega}}$
-value of the flattest angular velocity profile does not coincide with the location of the torque maximum, which is another evidence that this detachment maximum differs from the narrow torque maximum observed for
 ${\it\eta}\gtrsim 0.9$
. In contrast, Ostilla-Mónico et al. (Reference Ostilla-Mónico, Huisman, Jannink, Van Gils, Verzicco, Grossmann, Sun and Lohse2014a
) found the flattest
 ${\it\omega}$
-profile for
 ${\it\eta}=0.5$
at
 $R_{{\it\Omega}}=0.25$
and for
 ${\it\eta}=0.714$
at
 $R_{{\it\Omega}}=0.12$
which agree with the corresponding torque-maximizing rotation numbers. However, the difference might result from the fact that their values are extrapolated from simulations at
 $Re_{S}\lesssim 5\times 10^{3}$
lower than the
 $Re_{S}=2\times 10^{4}$
used here.
The gradients of the
 ${\it\omega}$
-profile (
 $u_{x}$
-profile in RPCF) are relevant when analysing the momentum transport in the centre and the torque (force) needed to drive the walls. They measure the diffusive part of the current
 $J^{\mathscr{L}}$
(
 $J^{u}$
, respectively) which is mediated by viscosity, i.e. the last term in (2.12) and (2.15). A flat profile means that the convective current
 $J_{c}^{\mathscr{L}}=\langle u_{r}\mathscr{L}\rangle$
(
 $J_{c}^{u}=\langle u_{y}u_{x}\rangle$
in RPCF) accomplishes all momentum transport in the middle.
5.3. Turbulent fluctuations
Fluctuation amplitude of the wall-normal velocity
 $\langle u_{r}^{\prime }\rangle _{rms}$
(
 $\langle u_{y}^{\prime }\rangle _{rms}$
for RPCF) in (a) and of the streamwise velocity
 $\langle u_{{\it\varphi}}^{\prime }\rangle _{rms}$
(
 $\langle u_{x}^{\prime }\rangle _{rms}$
) in (b) and their cross-correlation coefficient
 $C_{r{\it\varphi}}$
(
 $C_{yx}$
) in (c) as a function of the rotation number
 $R_{{\it\Omega}}$
for
 $Re_{S}=2\times 10^{4}$
and various radius ratios
 ${\it\eta}$
. All quantities are radially average in the central region
 $(r-r_{i})/d\in \left[1/3,2/3\right]$
where momentum is mainly transported by the convective current
 $J_{c}^{\mathscr{L}}=r\langle u_{r}^{\prime }u_{{\it\varphi}}^{\prime }\rangle$
(
 $J_{c}^{u}=\langle u_{y}^{\prime }u_{x}^{\prime }\rangle$
).

Finally, we study the effect of the mean system rotation (
 $R_{{\it\Omega}}$
) on the characteristics of the convective momentum transport by turbulent fluctuations. We demonstrate that not all deviations from the laminar state contribute to the net convective momentum transport but only the turbulent fluctuations around the mean profile. This becomes apparent when introducing the velocity deviation from the mean profile
 $\boldsymbol{u}^{\prime }=\boldsymbol{u}-\langle \boldsymbol{u}\rangle$
by using the original average
 $\langle \cdots \rangle =\langle \cdots \rangle _{{\it\varphi}z,t}$
; note that this differs from
 $\boldsymbol{u}^{\prime \prime }=\boldsymbol{u}-\langle \boldsymbol{u}\rangle _{{\it\varphi},t}$
, which was introduced in § 4.1.1 to describe turbulent fluctuations around the mean vortical motion, see also Bilson & Bremhorst (Reference Bilson and Bremhorst2007). As a result of incompressibility (2.6) the mean radial flow vanishes, i.e.
 $\langle u_{r}\rangle =0$
, so that
 $u_{r}^{\prime }=u_{r}$
. Moreover, by substituting the azimuthal velocity decomposition
 $u_{{\it\varphi}}=\langle u_{{\it\varphi}}\rangle +u_{{\it\varphi}}^{\prime }$
into the convective angular-momentum flux,
 $$\begin{eqnarray}J_{c}^{\mathscr{L}}=r\langle u_{r}\,u_{{\it\varphi}}\rangle =r\langle u_{r}\rangle \langle u_{{\it\varphi}}\rangle +r\langle u_{r}\,u_{{\it\varphi}}^{\prime }\rangle =r\langle u_{r}^{\prime }\,u_{{\it\varphi}}^{\prime }\rangle ,\end{eqnarray}$$
we see that only the correlated fluctuations
 $u_{r}^{\prime }$
and
 $u_{{\it\varphi}}^{\prime }$
contribute to the net convective transport. Inspired by the analysis of Burin, Schartman & Ji (Reference Burin, Schartman and Ji2010), we measure their amplitude by area- and time-averaged root-mean-square values
 $\langle u_{r}^{\prime }\rangle _{rms}$
and
 $\langle u_{{\it\varphi}}^{\prime }\rangle _{rms}$
that enable the definition of a cross-correlation coefficient
 $$\begin{eqnarray}C_{r{\it\varphi}}={\displaystyle \frac{\langle u_{r}^{\prime }\,u_{{\it\varphi}}^{\prime }\rangle }{\langle u_{r}^{\prime }\rangle _{rms}\langle u_{{\it\varphi}}^{\prime }\rangle _{rms}}}\quad \text{so that }J_{c}^{\mathscr{L}}=r\langle u_{r}^{\prime }\rangle _{rms}\langle u_{{\it\varphi}}^{\prime }\rangle _{rms}C_{r{\it\varphi}}.\end{eqnarray}$$
The corresponding quantities in RPCF are
 $$\begin{eqnarray}C_{yx}={\displaystyle \frac{\langle u_{y}^{\prime }\,u_{x}^{\prime }\rangle }{\langle u_{y}^{\prime }\rangle _{rms}\langle u_{x}^{\prime }\rangle _{rms}}}\quad \text{so that }J_{c}^{u}=\langle u_{y}^{\prime }\rangle _{rms}\langle u_{x}^{\prime }\rangle _{rms}C_{yx}.\end{eqnarray}$$
Consequently, we may consider increases in the convective (angular) momentum transport as being due to violent fluctuations of the wall-normal or streamwise velocities, or due to a strong cross-correlation between them. All three effects are analysed as functions of
 $R_{{\it\Omega}}$
for
 $Re_{S}=2\times 10^{4}$
in figure 14.
Generally, we observe for
 ${\it\eta}\geqslant 0.8$
and RPCF that the fluctuation amplitudes and correlation coefficients collapse well in the unstable range with
 $R_{{\it\Omega}}\gtrsim 0$
, which again indicates that low-curvature TCF and RPCF show the same rotation dependence. The wall-normal flow grows in amplitude when rotation sets in (
 $R_{{\it\Omega}}>0$
) and is suppressed by strong rotation forming a maximum around
 $R_{{\it\Omega}}\approx 0.25$
for
 ${\it\eta}\geqslant 0.71$
; this nearly coincides with the broad torque maximum at
 $R_{{\it\Omega}}=0.2$
for
 ${\it\eta}\geqslant 0.8$
, and it resembles the maximum observed in the torque
 $G_{2D}$
from streamwise-invariant simulations (cf. figure 11). The co-occurrence of the maximum wall-normal flow with the broad peak supports the picture that the broad torque maximum is associated with strong vortical motion. While the co-occurrence holds for the plateau next to the actual maximum for
 ${\it\eta}=0.71$
(figure 8
b), the correlation between the maxima is less clear for
 ${\it\eta}=0.5$
.
On the other hand, the streamwise velocity fluctuations are strongest without system rotation, forming a sharp maximum around
 $R_{{\it\Omega}}=0$
, except for the high-curvature TCF with
 ${\it\eta}=0.5$
(figure 14
b). A corresponding peak in the torques is missing since the narrow torque maximum at
 $R_{{\it\Omega}}=0.02$
clearly drops off towards
 $R_{{\it\Omega}}=0$
(cf. figure 9
b).
However, for
 ${\it\eta}\geqslant 0.9$
the maximum in the cross-correlation coefficients at
 $R_{{\it\Omega}}\approx 0.03$
(figure 14
c) comes closer to the narrow torque maximum suggesting that the latter is associated with a very efficient (angular) momentum transport by moderately strong but correlated vortices. Moreover, the peak in the cross-correlation coefficients coincides with the maximum in the torque
 $\overline{G}$
due to the mean vortical flow (cf. figure 11). The maximum in
 $C_{r{\it\varphi}}$
at
 $R_{{\it\Omega}}=0.15$
and at
 $R_{{\it\Omega}}=0.05$
for
 ${\it\eta}=0.5$
and
 ${\it\eta}=0.71$
, respectively, does not coincide with the torque maximum for the corresponding radius ratio indicating that the latter differs from the narrow maximum for
 ${\it\eta}\gtrsim 0.9$
.
6. Summary and conclusions
By describing TCF in the rotating reference frame, as proposed by Dubrulle et al. (Reference Dubrulle, Dauchot, Daviaud, Longaretti, Richard and Zahn2005), we were able to study its limit to RPCF as the radius ratio
 ${\it\eta}$
approaches 1. In this framework, shear and mean system rotation are quantified by the same parameters
 $Re_{S}$
and
 $R_{{\it\Omega}}$
in both systems and curvature effects measured by
 $R_{C}$
disappear with
 ${\it\eta}\rightarrow 1$
. The data collapse observed for
 ${\it\eta}\geqslant 0.9$
shows that
 $Re_{S}$
and
 $R_{{\it\Omega}}$
are the appropriate parameters with which to describe the transition from TCF to RPCF. Moreover, we analysed the analogy between the angular momentum transport in TCF and the linear momentum transport in RPCF by utilising the correspondence between the currents
 $J^{\mathscr{L}}$
and
 $J^{u}$
which are connected to the torque
 $G$
and the force
 $F$
in the respective geometries.
As a consequence of curvature, the TCF for counter-rotating cylinders features a radial partitioning of stability that results in enhanced intermittent fluctuations in the outer region. For a constant shear
 $Re_{S}$
and changing system rotation, the occurrence of the intermittency has been linked to the torque maximum that forms as a function of
 $R_{{\it\Omega}}$
for
 ${\it\eta}=0.5$
and
 $0.71$
(van Gils et al.
Reference van Gils, Huisman, Grossmann, Sun and Lohse2012; Brauckmann & Eckhardt Reference Brauckmann and Eckhardt2013b
). Our simulations show that the onset of enhanced outer fluctuations agrees in the range
 $0.5\leqslant {\it\eta}\leqslant 0.9$
with the prediction
 ${\it\mu}_{p}({\it\eta})$
for the occurrence of intermittency in the outer region derived by Brauckmann & Eckhardt (Reference Brauckmann and Eckhardt2013b
). Furthermore, we demonstrated that the stability difference between the inner and outer region, and therefore the fluctuation asymmetry, decrease with declining curvature and eventually disappear as
 ${\it\eta}\rightarrow 1$
. As a consequence, the detachment torque maximum also vanishes for
 ${\it\eta}\gtrsim 0.9$
.
For this low-curvature TCF, we identified two new torque maxima, a broad one at
 $R_{{\it\Omega}}=0.2$
that exists for all studied
 $Re_{S}$
and a narrow one at
 $R_{{\it\Omega}}=0.02$
that emerges as
 $Re_{S}$
increases to
 $2\times 10^{4}$
. The broad torque maximum is accompanied by a strong vortical flow as evidenced by the large wall-normal velocity and can be reproduced in streamwise-invariant simulations which also points to streamwise vortices causing a high angular momentum transport. On the other hand, the narrow torque maximum coincides with an effective mean flow where the angular momentum transport is maximized not due to large-amplitude vortices but because of correlated vortices, resulting in an effective convective transport. The momentum transport in RPCF features the same characteristics and also shows the two maxima.
Moreover, our simulations at
 $Re_{S}=2\times 10^{4}$
reveal that Nusselt numbers, profile slopes and fluctuation amplitudes collapse well for
 ${\it\eta}\geqslant 0.9$
when plotted as a function of
 $R_{{\it\Omega}}$
and agree with the corresponding quantities in RPCF. These results empirically demonstrate the convergence of TCF with small but finite curvature to RPCF. In this limit, the dependence on the system rotation parametrized by
 $R_{{\it\Omega}}$
becomes universal in both systems. In addition, the angular momentum profiles in TCF show this universal behaviour since they collapse remarkably well for different radius ratios
 ${\it\eta}\geqslant 0.5$
as long as no stabilised outer region occurs. Furthermore, we demonstrated that for unstable flow (
 $R_{{\it\Omega}}>0$
) the turbulent mean profiles in TCF and RPCF feature gradients in the centre that conform with neutral stability. Rayleigh’s inviscid neutral stability criterion has an analogous counterpart in RPCF and implies that the profile slopes
 $r\partial _{r}\langle {\it\omega}\rangle$
and analogously
 $-\partial _{y}\langle u_{x}\rangle$
approximate
 $-R_{{\it\Omega}}$
in the central region. In the low-curvature TCF and in RPCF, the flattest
 ${\it\omega}$
-profile (or
 $u_{x}$
-profile) and the narrow torque maximum appear at almost the same
 $R_{{\it\Omega}}$
-value as also found for smaller
 ${\it\eta}\leqslant 0.909$
by Ostilla-Mónico et al. (Reference Ostilla-Mónico, Huisman, Jannink, Van Gils, Verzicco, Grossmann, Sun and Lohse2014a
). However for
 ${\it\eta}=0.909$
, these authors observed only one maximum in the torque for
 $Re_{S}$
above
 $10^{5}$
which appears at
 $R_{{\it\Omega}}=0.04$
close to our narrow maximum at
 $R_{{\it\Omega}}=0.02$
and shows the same signature in the profile gradient. This fact, and the stronger growth of the narrow torque maximum with
 $Re_{S}$
, suggest that it will outperform the broad maximum as the shear increases further. Further simulations or experiments for low-curvature flows with
 ${\it\eta}>0.9$
and
 $Re_{S}$
beyond
 $2\times 10^{4}$
could provide welcome tests of this prediction.
The study of the transition from TCF to RPCF has revealed more changes in the flow structures and the turbulent characteristics than anticipated. Perhaps the most intriguing observation is the transition from a single maximum in torque to two maxima for
 ${\it\eta}\gtrsim 0.9$
. We could here characterize the two maxima by their relation to prominent features of the turbulent flow and momentum transport. While this provides some insights into their origin, a better physical understanding of the maxima and an explanation for their remarkably universal position in
 $R_{{\it\Omega}}$
would be desirable.
Acknowledgements
We thank M. Avila, S. Grossmann, D. P. Lathrop, D. Lohse, S. Merbold, R. Ostilla-Mónico and M. S. Paoletti for various stimulating discussions. We are grateful to M. Avila for developing and providing the code used for our Taylor–Couette simulations. This work was supported in part by the Deutsche Forschungsgemeinschaft within the research group FOR 1182. Most computations were carried out at the LOEWE-CSC in Frankfurt.