


1. Introduction
At present, the research on flexible wings can be divided into two aspects: passive and active flexible wings. Passive flexible wings, usually known as flexible membrane wings, are to cover flexible membrane materials on the wing structure. The membrane wing surface can deform under aerodynamic loads and then change the aerodynamic performance of the wing. The aerodynamic characteristics of flexible membrane wings are affected by both steady and unsteady fluid–structure interaction (FSI). Compared with a rigid wing, the steady mean deformation can increase the wing camber and cause the wing to be more streamlined, thus leading to increased lift and delayed stall (Lian et al. Reference Lian, Shyy, Viieru and Zhang2003). The unsteady dynamics of a membrane wing is also important. At certain working conditions, the membrane interacts with the surrounding flow, leading to unsteady flow-induced vibration. The membrane may present standing-wave vibration modes at integer multiples of the membrane natural fundamental frequency (Song et al. Reference Song, Tian, Israeli, Galvao, Bishop, Swartz and Breuer2008; Gordnier Reference Gordnier2009; Rojratsirikul, Wang & Gursul Reference Rojratsirikul, Wang and Gursul2009, Reference Rojratsirikul, Wang and Gursul2010; He & Wang Reference He and Wang2020; He, Guo & Wang Reference He, Guo and Wang2022) or travelling-wave modes (Gordnier Reference Gordnier2009; Timpe et al. Reference Timpe, Zhang, Hubner and Ukeiley2013; Serrano-Galiano, Sandham & Sandberg Reference Serrano-Galiano, Sandham and Sandberg2018). Generally, the mechanism of unsteady flow-induced vibration is the frequency lock-in phenomenon between vortex shedding and membrane vibration. Relevant numerical simulations (Gordnier Reference Gordnier2009; Huang et al. Reference Huang, Xia, Dai, Yang and Wu2021; Li, Jaiman & Khoo Reference Li, Jaiman and Khoo2021) and wind-tunnel experiments (Song et al. Reference Song, Tian, Israeli, Galvao, Bishop, Swartz and Breuer2008; Tregidgo, Wang & Gursul Reference Tregidgo, Wang and Gursul2013; Bleischwitz, de Kat & Ganapathisubramani Reference Bleischwitz, de Kat and Ganapathisubramani2017; Waldman & Breuer Reference Waldman and Breuer2017; He & Wang Reference He and Wang2020) have found the close coupling relationship between dynamic vortex shedding and membrane response at different conditions. The membrane natural frequencies may be locked into the vortex shedding frequency and its harmonics in the shear layer or wake region, so as to select a specific vibration mode and vortex shedding mode. In addition to the above studies on the complete lock-in between membrane and fluid, He & Wang (Reference He and Wang2020) newly found that there was a lower dominant frequency in the wake near the trailing edge of the membrane airfoil than the membrane–fluid lock-in frequency, which was interpreted as the result of the fluid–fluid interaction between the flows from leading- and trailing-edges. This phenomenon was also reported by the subsequent experiment of Rodríguez-López, Carter & Ganapathisubramani (Reference Rodríguez-López, Carter and Ganapathisubramani2021).
Accompanied by the research on the mechanism of flow-induced vibration, multiple studies on the effects of parameters have been carried out. It was found that the aerodynamic forces, membrane dynamics and flow evolution of membrane wings or airfoils vary greatly with the change of membrane materials (such as mass ratio, aeroelastic parameter etc.) (Tiomkin & Raveh Reference Tiomkin and Raveh2019, Reference Tiomkin and Raveh2021; Li et al. Reference Li, Jaiman and Khoo2021), pre-strain, excess length (Song et al. Reference Song, Tian, Israeli, Galvao, Bishop, Swartz and Breuer2008; Rojratsirikul et al. Reference Rojratsirikul, Wang and Gursul2010), angle of attack (α), aspect ratio, Reynolds number (Re) (Gordnier Reference Gordnier2009; Rojratsirikul et al. Reference Rojratsirikul, Genc, Wang and Gursul2011; Bleisciwitz, de Kat & Ganapathisubramani 2015; He & Wang Reference He and Wang2020; He et al. Reference He, Guo and Wang2022), model installation and supporting methods (Hu, Tamai & Murphy Reference Hu, Tamai and Murphy2008; Arbós-Torrent, Ganapathisubramani & Palacios Reference Arbós-Torrent, Ganapathisubramani and Palacios2013; Timpe et al. Reference Timpe, Zhang, Hubner and Ukeiley2013; Bleischwitz, de Kat & Ganapathisubramani Reference Bleischwitz, de Kat and Ganapathisubramani2016, Reference Bleischwitz, de Kat and Ganapathisubramani2018; Bleischwitz et al. Reference Bleischwitz, de Kat and Ganapathisubramani2017; Sun & Zhang Reference Sun and Zhang2017; Waldman & Breuer Reference Waldman and Breuer2017; Açıkel & Genç Reference Açikel and Genç2018; Genç, Açıkel & Koca Reference Genç, Açikel and Koca2020; Pflüger & Breitsamter Reference Pflüger and Breitsamter2021; Sun et al. Reference Sun, Zhang, Su and Huang2022). By introducing the Weber number (the ratio of membrane lift to tension), Song et al. (Reference Song, Tian, Israeli, Galvao, Bishop, Swartz and Breuer2008) and Waldman & Breuer (Reference Waldman and Breuer2017) analysed the aerodynamic and deformation characteristics of a membrane wing at various parameter conditions, trying to theoretically predict the variations of membrane camber and lift. Li et al. (Reference Li, Jaiman and Khoo2021) constructed a comprehensive parameter space for the influence law of three important parameters: mass ratio, Reynolds number and aeroelastic parameter. It was discovered that the optimal lift performance of a membrane wing was located in the region of small mass ratio, large flexibility and moderate Reynolds number.
However, the passive flexible wings have their inherent shortcomings. For the simplified single-layer membrane wings, they have to pay the price of increasing drag while enhancing lift, and the membrane vibration could bring an additional drag increment (Bleisciwitz, de Kat & Ganapathisubramani 2015; He & Wang Reference He and Wang2020; He et al. Reference He, Guo and Wang2022). When α is small, the disordered vibration may be detrimental for the aerodynamics compared with rigid cambered wings (Serrano-Galiano et al. Reference Serrano-Galiano, Sandham and Sandberg2018). For the complex wings with partially flexible surfaces, Açıkel & Genç (Reference Açikel and Genç2018), Genç et al. (Reference Genç, Açikel and Koca2020) and Guo et al. (Reference Guo, He, Wang and Wang2021) all found that the lift-enhancement effect of passive flexible wings became worse at high Re. The numerical simulations of Arif et al. (Reference Arif, Lam, Wu and Leung2020) and Arif, Lam & Leung (Reference Arif, Lam and Leung2022) on the passive control of a NACA 0012 airfoil with localized elastic panels flush mounted on the suction surface also reported that the elastic panel configuration has no significant influence on airfoil aerodynamic performance.
To solve the above problems, active flexible wings have been gradually developed with the hope of effectively controlling the wing aerodynamics. The existing control methods mainly include: mechanical structures; shape memory alloys; dielectric elastomer actuators and piezoelectric macro-fibre composite (MFC) actuators. Béguin, Breitsamter & Adams (Reference Béguin, Breitsamter and Adams2012) and Pflüger & Breitsamter (Reference Pflüger and Breitsamter2021) combined a flexible skin with the variable sweep-angle technique to actively control the wing sweep angle through mechanical structures. The aerodynamic configuration and skin pre-strain of the wing changed with the sweep angle, and thus significantly changed the aerodynamic characteristics of the flexible wing. Yu, Zhang & Liang (Reference Yu, Zhang and Liang2008) and Georges et al. (Reference Georges, Brailovski, Morellon, Coutu and Terriault2009) installed shape memory alloy springs between the wing skin and supporting wing-box. The lengths of the springs were adjusted by heating and cooling to deform the flexible skin, so as to control the wing shape and aerodynamic characteristics. However, the control methods of mechanical structures and shape memory alloys usually have a complex internal mechanism and low actuation frequency, so they are unable to apply coupling control on the commonly high-frequency (102–103 Hz) flow structures around the wing.
Compared with the first two control methods, dielectric elastomers and MFC actuators are of particular interest due to their advantages of simple structure and high actuation frequency in active control of flexible wings. The dielectric elastomer membrane can be directly used as the flexible wing skin with compliant electrodes coated on its upper and lower surfaces. When an external voltage was applied, the unlike charges on the opposing sides of the electrostrictive membrane attract each other and force the membrane into compression in the thickness direction, leading to in-plane expansion (Hays et al. Reference Hays, Morton, Dickinson, Chakravarty and Oates2012). As a result, the membrane could deform under aerodynamic loads due to the pressure difference between the upper and lower sides of the membrane. Hays et al. (Reference Hays, Morton, Dickinson, Chakravarty and Oates2012) and Barbu, de Kat & Ganapathisubramani (Reference Barbu, de Kat and Ganapathisubramani2018) applied direct-current (DC) voltage to the skin and realized a large change of the wing camber, leading to lift-enhancement. The latter also found that the skin with less pre-strain has a better control effect. Curet et al. (Reference Curet, Carrere, Waldman and Breuer2014) extended the actuation modality by applying alternating-current (AC) sinusoidal voltage to explore unsteady actuation effect on the same type of membrane wing. A significant increase in lift occurred at specific actuation frequencies. Bohnker & Breuer (Reference Bohnker and Breuer2019) further conducted wind-tunnel measurements on aerodynamic forces, membrane deformations and flow fields. They indicated that effective unsteady control can stimulate the instability of separated flow, induce the generation of coherent structures in the shear layer, and finally suppress separation and delay stall. However, this technique can only change the in-plane strain of the skin. The membrane deformation and vibration modes still depend on the flow field, so this technique can hardly control the wing deformation directly. In contrast, the MFC actuators can achieve direct control of the wing deformation. MFC actuators are novel piezoelectric ceramic composites developed by NASA Langley Research Center (Wilkie et al. Reference Wilkie, Bryant, High, Fox, Hellbaum, Jalink, Little and Mirick2000) and have the advantages of light structure and low energy consumption. Bilgen et al. (Reference Bilgen, Kochersberger, Diggs, Kurdila and Inman2007) adopted MFC actuators to control the wing camber so that the roll and pitch control of a remotely piloted micro-air-vehicle could be realized. They further designed a variable camber airfoil using continuous non-stretchable surfaces bonded with MFC actuators, which greatly change the aerodynamic characteristics (Bilgen et al. Reference Bilgen, Kochersberger, Inman and Ohanian2010). The substrates of MFC actuators were directly used as the wing surfaces by Debiasi et al. (Reference Debiasi, Bouremel, Khoo, Luo and Elvin2011, Reference Debiasi, Bouremel, Khoo and Luo2012, Reference Debiasi, Bouremel, Lu and Ravichandran2013) to yield static deformation on the leeward and windward surfaces of symmetric and asymmetric airfoils. The airfoil shape as well as the aerodynamics changed greatly with the actuation voltages. They indicated this technique should be useful for tailoring and improving the aerodynamic performance of other types of airfoil as well. Subsequently, Jones et al. (Reference Jones, Debiasi, Bouremel, Santer and Papadakis2015) used MFC actuators to dynamically drive the leeward surface of the NACA4415 airfoil. It was found that with the increase of actuation frequency, the active control gradually had lift-enhancement and drag-reduction effects. However, most of the research about MFC application only focused on static deformations, mean aerodynamics and flow characteristics, lacking synchronous measurements on forces, deformations and flow fields, as well as detailed analyses on unsteady aerodynamics and fluid–structure interaction.
In short, the existing dielectric elastomer technique can only indirectly control the membrane deformation. Although the MFC actuators can directly control the deformation, previous studies only applied them to control the relatively rigid substrates such as a carbon-fibre sheet, fibreglass sheet, titanium sheet etc. To the best of the authors’ knowledge, experimental studies on the direct control of a flexible membrane are rare. He et al. (Reference He, Guo and Wang2022) proposed novel ideas for active control of a membrane airfoil by controlling the membrane vibration frequency at specific chordwise locations for intensive actuation. Feng et al. (Reference Feng, Guo, Wang and Xu2022) applied MFC actuators on a simplified aircraft model with membrane wings. Therefore, based on the flexible membrane airfoil and MFC technique, this study will apply active control onto the airfoil leeward surface covered with a flexible membrane skin. Its influence on the aerodynamic characteristics will be the focus, and the coupling mechanism of aerodynamic forces, membrane deformations and flow fields will be explored. This study has guiding significance for the research of active control technology of a flexible wing, especially for the unsteady aerodynamics and fluid–structure interaction. The full text consists of five parts. The background and significance are introduced in § 1, and the characteristics and shortcomings of passive and active flexible wings are summarized; in § 2, the details of model design, measurements and control parameters are described; in § 3, the effects of active control are analysed from the perspective of mean characteristics; in § 4, the frequency spectra of forces, deformations and flow fields are analysed in detail and their unsteady coupling process is further revealed; in § 5, the conclusions of the study are collated.
2. Experimental methods
2.1. Model design
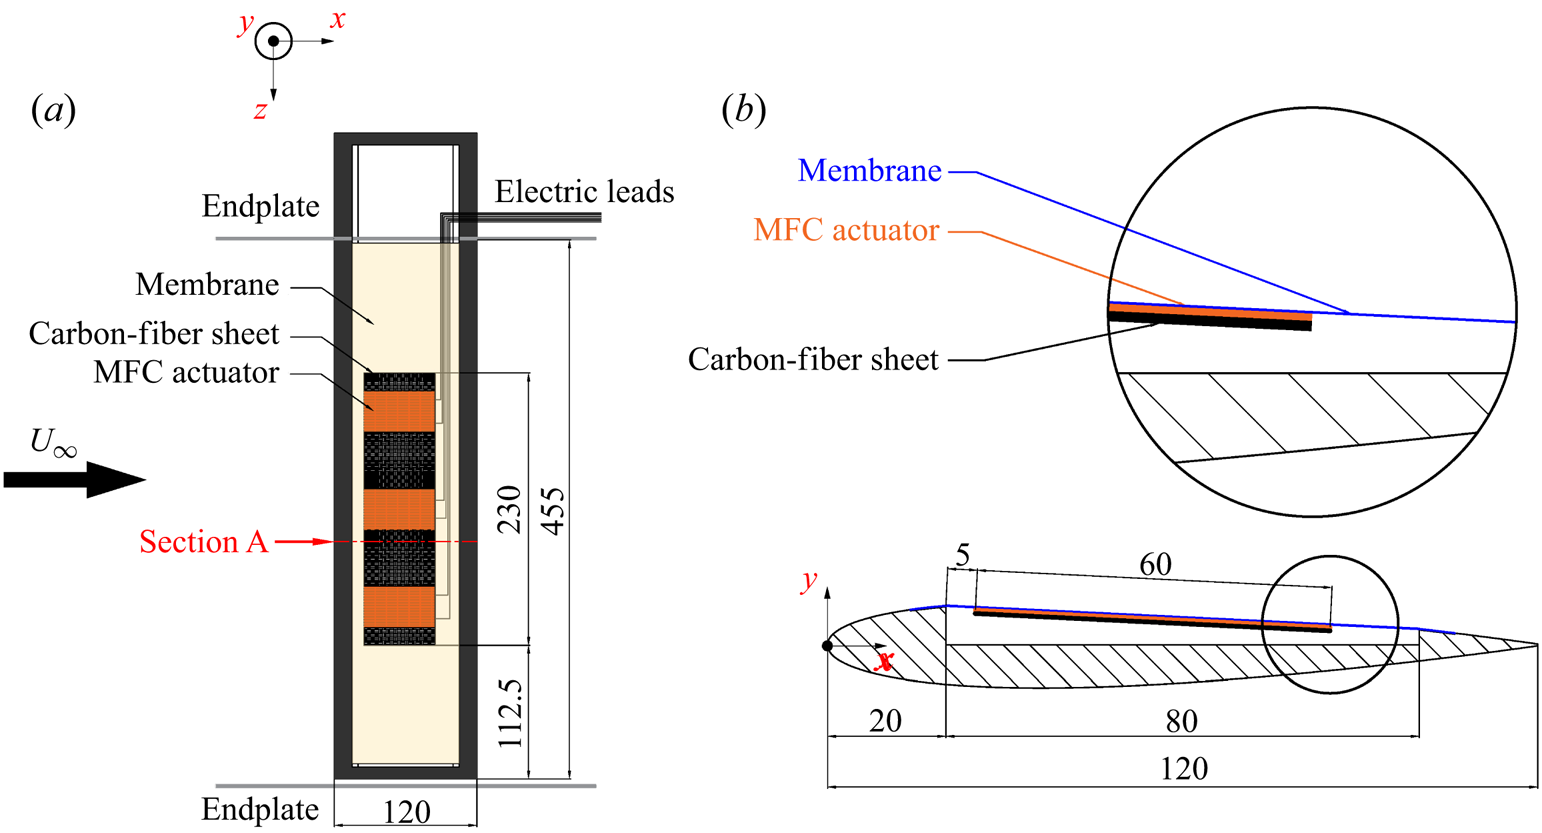
Three airfoil models were used in the current experiment: a rigid airfoil, an airfoil with a flexible membrane skin on the leeward surface (hereinafter referred to as a flexible airfoil) and an airfoil with a flexible membrane skin actuated by MFCs on the leeward surface (hereinafter referred to as an actively controlled airfoil). The cross-section of the rigid airfoil was a complete NACA0012 airfoil. The flexible and the actively controlled airfoils were based on the NACA0012 airfoil with a cavity ranging from 16.7 % to 83.3 % of the chord length on the airfoil leeside. The cavity was deep to the airfoil centreline to ensure enough space to cover the flexible membrane skin. The cross-section shape of the flexible and the actively controlled airfoils is shown in figure 1. For all the three models, the chord lengths (c) and effective spans were 120 mm and 455 mm, respectively, resulting in aspect ratios of approximately 3.8. The models were made of stainless steel. The flexible skin adopted the same transparent thermoplastic polyurethanes (TPU) material as our previous single-layer membrane airfoil experiments (He & Wang Reference He and Wang2020; He et al. Reference He, Guo and Wang2022). The Young's modulus, thickness and density of the membrane were E = 31.2 MPa, tm = 0.2 mm and ρm = 1.1 g cm−3, respectively. Small steps of ~5 mm width and ~0.2 mm depth were reserved before and behind the cavity to paste double-sided adhesive tape and fix the flexible membrane above the cavity. The chordwise length of the cavity and the original length of the membrane were 80 mm, while the length of the line connecting the front and rear of the cavity (d) was approximately 80.1 mm. To ensure the initially flatness of the membrane, a pre-strain of approximately 0.13 % was applied  $({\varepsilon _0} = (80.1 - 80)/80 \approx 0.13\,\%)$. In addition, the joints between the membrane and the airfoil should be as smooth as possible.
Structural diagram of the actively controlled airfoil.

Figure 1 illustrates the detailed structure of the actively controlled airfoil. A complete active controller was installed in the middle of the model. The active controller consisted of MFC actuators and carbon-fibre substrate. To ensure the active control has sufficient spanwise length, inspired by Debiasi et al. (Reference Debiasi, Bouremel, Lu and Ravichandran2013) and Jones et al. (Reference Jones, Debiasi, Bouremel, Santer and Papadakis2015), three identical MFC actuators (Smart Material M5628-P1) were used in the experiment. For each actuator, the actuation length, actuation width and overall width were 56 mm, 28 mm and 35 mm, respectively. The capacitance was C = 8.7 nF, and the average shape variable per volt was approximately 0.75 μm m−1. Due to the advantages of high strength, small mass and ease to process, a carbon-fibre sheet with 230 mm length, 60 mm width and 0.2 mm thickness was selected as the substrate. The MFC actuators and substrate were firmly bonded with epoxy in a vacuum. As shown by the locally enlarged view in figure 1, the active controller was pasted beneath the flexible membrane through double-sided tape to form a ‘sandwich’ structure of membrane–MFC actuator–carbon-fibre substrate. Along the airfoil section, the leading- and trailing-edges of the active controller were approximately 5 mm and 65 mm away from the front of the cavity, respectively. Along the spanwise direction, three MFC actuators were arranged on the substrate with equal distance. The active controller was in parallel with the span, while its central axis was located at the mid-span. The area ratio of the active controller to the entire flexible membrane skin was approximately 38 %. The model was installed vertically in the wind tunnel, so the effect of the active controller gravity on the membrane deformation could be ignored.
Moreover, it is seen from figure 1 that the direction of incoming flow is from left to right. Therefore, the three-dimensional coordinate system can be defined. The x-axis is the streamwise direction parallel to the incoming flow; the z-axis is the spanwise direction of the model; the y-axis is perpendicular to the x–z plane and referred to as the vertical direction. The origin of the x–y plane (cross-section plane) is located at the leading-edge when α = 0°. As a result, the trailing-edge non-dimensional coordinates normalized by the chord length are fixed as (1,0) at any α.
2.2. Measurements
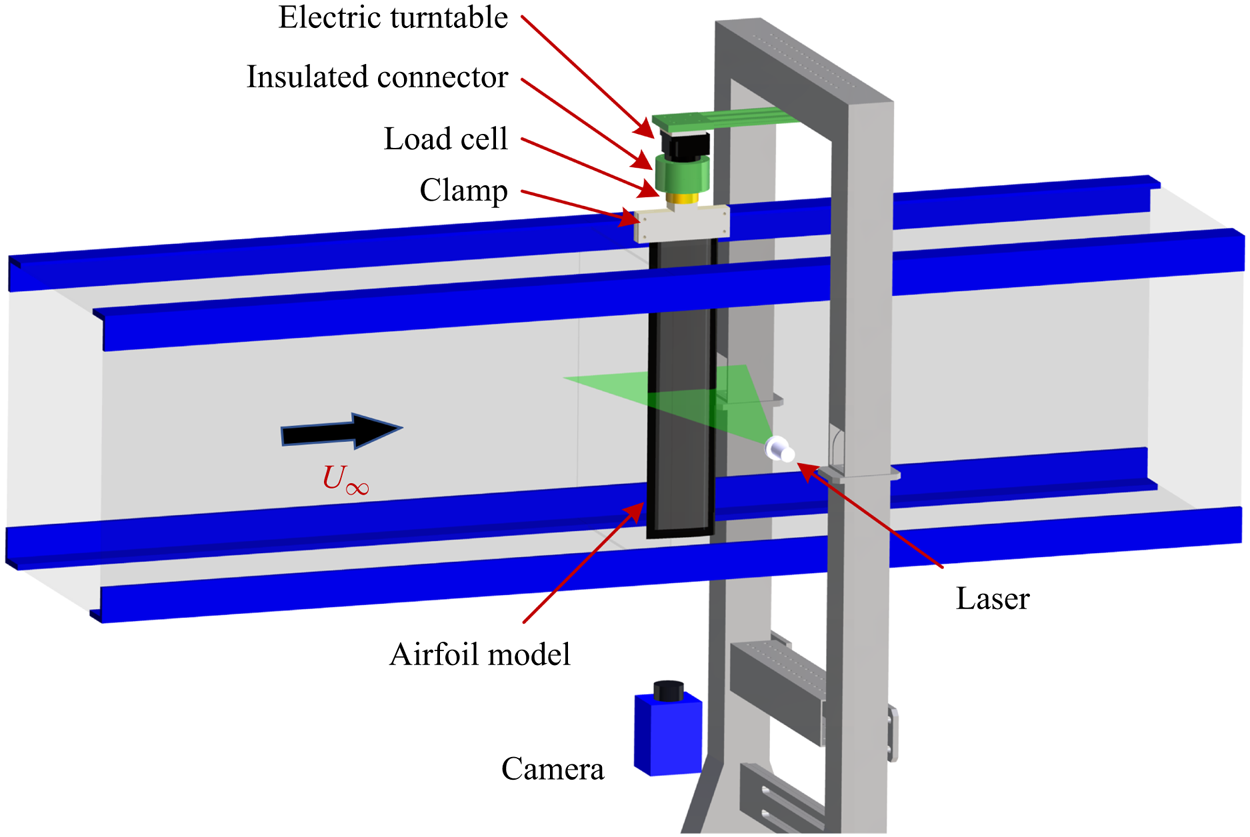
The present experiment was carried out in the low-speed, open-loop and closed-jet D6 wind tunnel at Beijing University of Aeronautics and Astronautics (BUAA). The experimental set-up is shown in figure 2. The airfoil model passed through the upper wall of the wind tunnel and was vertically installed in the test section. End plates were installed approximately 20 mm away from the upper and lower walls to reduce the boundary layer influence of the wind tunnel wall on the flow around the airfoil. Accordingly, the effective span of the model was 455 mm. The free stream velocity U∞ was 7.5 m s−1, resulting in the Reynolds number based on c of Re = 6 × 10⁴. The free stream turbulent intensity Tu was less than 0.3 % at the current operating condition.
Set-up of the present experiment.

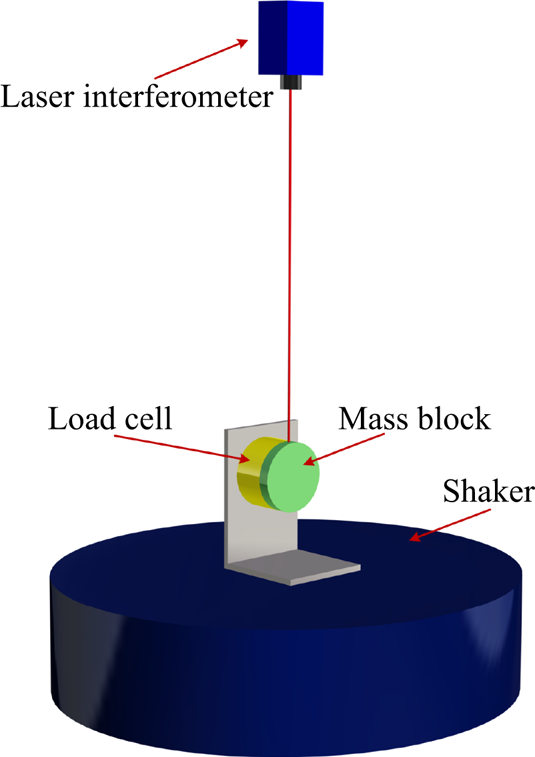
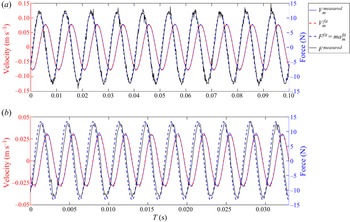
First, the aerodynamic forces of each model were measured in the wide range of α = −5° to 30° in 1° increments. As shown in figure 2, aerodynamic forces were determined by a six-component load cell (ATI-Mini40) with a range of 20 N (calibration standard SI-20-1). The load cell was factory-calibrated such that the static forces obtained were already corrected. In addition, the dynamic force calibration of the load cell at O(101–102) Hz was conducted in the current study. Details can be found in Appendix A. The load cell and the airfoil model were connected through an aluminium clamp. All of them were connected to an electric turntable through an insulated connector. The electric turntable was finally fixed on a steel support which stretched across but not contacted with the wind tunnel. All connectors could ensure the connection stiffness. The insulated connector could eliminate the influence of static electricity generated by the motor of the electric turntable on the load cell. The positioning accuracy of the electric turntable was ±0.01°, so the angles of attack could be precisely adjusted. It was reported that the accuracy of load cell holds only if the measurements are made within 60 s due to the sensor output drift (Bleischwitz Reference Bleischwitz2016). To ensure reliable measurements, two wind-off tare points were obtained before and after each measurement, and then averaged as the baseline. Hence, the load repeatability error was less than ±5 × 10⁻³ N. Each measurement point was the average of data sampled at 4 kHz over 45 s, which could meet the requirements of high time-resolution and ergodicity. The sampling number of forces was approximately 1.8 × 10⁵. The resolution of the x- and y-axes of the load cell was 5 × 10⁻³ N. The uncertainties of force measurements in the current study are given here.
The lift and drag coefficients are calculated by
 \begin{gather}{C_l}\textrm{ = }\frac{L}{{{\textstyle{1 \over 2}}{\rho _a}U_\infty ^2S}},\end{gather}
 \begin{gather}{C_d}\textrm{ = }\frac{D}{{{\textstyle{1 \over 2}}{\rho _a}U_\infty ^2S}},\end{gather}
where L is the lift, D is the drag, and ρa and S are the air density and wing area, respectively. The uncertainty of Cl originating from both the uncertainties of L and U∞ could be estimated by the uncertainty propagation formula (Kline & McClintock Reference Kline and Mcclintock1953):
 \begin{align}\begin{aligned}
\varepsilon ({C_l}) & = \sqrt {{{\left( {\dfrac{{\partial
{C_l}}}{{\partial L}}} \right)}^2}{\varepsilon ^2}(L) +
{{\left( {\dfrac{{\partial {C_l}}}{{\partial {U_\infty }}}}
\right)}^2}{\varepsilon ^2}({U_\infty })} \\ & = \sqrt
{{{\left( {\dfrac{2}{{{\rho _a}U_\infty^2S}}}
\right)}^2}{\varepsilon ^2}(L) + {{\left( {\dfrac{{ -
4L}}{{{\rho _a}U_\infty^3S}}}
\right)}^2}{\varepsilon ^2}({U_\infty })} \\ & =
\dfrac{2}{{{\rho _a}U_\infty ^2S}}\sqrt
{{\varepsilon ^2}(L) + {{\left( {\dfrac{{2L}}{{{U_\infty
}}}} \right)}^2}{\varepsilon ^2}({U_\infty })},
\end{aligned}\end{align}
where ε denotes the uncertainties. In the current study, ε(L) and ε(D) are the resolution of the load cell (5 × 10⁻³ N), and ε(U∞) is the uncertainty of the Pitot tube used in the wind tunnel (~1 % U∞ = 0.075 m s−1). Accordingly, dividing (2.3) by (2.1) gives the relative uncertainty of Cl:
 \begin{equation}\frac{{\varepsilon ({C_l})}}{{{C_l}}} = \sqrt {\frac{{{\varepsilon ^2}(L)}}{{{L^2}}} + {{\left( {\frac{2}{{{U_\infty }}}} \right)}^2}{\varepsilon ^2}({U_\infty })} .\end{equation}
Similarly, the relative uncertainty of Cd is
 \begin{equation}\frac{{\varepsilon ({C_d})}}{{{C_d}}} = \sqrt {\frac{{{\varepsilon ^2}(D)}}{{{D^2}}} + {{\left( {\frac{2}{{{U_\infty }}}} \right)}^2}{\varepsilon ^2}({U_\infty })} .\end{equation}
It can be found that the uncertainties of lift and drag coefficients are related to specific values of forces, and thus they should be different. For the actively controlled airfoil at α = 12° in the current study,  $\varepsilon ({C_l})/{C_l}$ and
 $\varepsilon ({C_d})/{C_d}$ are 2.0 % and 3.6 %, respectively.
Then, in specific cases, time-resolved synchronous measurements on forces, two-dimensional (2-D) deformations and flow fields were carried out. As displayed in figure 1, particle image velocimetry (PIV) measurement was undertaken at section A after preliminary tests. Section A was close to the mid-span of the model but avoided the middle MFC body, so that the damage to MFC caused by high temperature under direct laser irradiation could be avoided. In PIV measurement, dioctyl sebacate (DEHS) droplets with mean diameter  $d_p \approx 1\;{\rm \mu}\mathrm{m}$ were generated and seeded by a MicoVec aerosol generator as tracer particles. According to Timpe et al. (Reference Timpe, Zhang, Hubner and Ukeiley2013), the relaxation time
 ${\tau_r} = d_p^\textrm{2}(\rho_p/18\ \mathrm{\mu})$ can determine how quickly the tracer particles can follow the flow under Stokes flow assumption for very small diameter spheres. Here,
 $\rho_p$ is the particle density. The relaxation time in this study was equal to 3 × 10⁻⁶ s (~300 kHz), which was enough for resolving different flow scales. As presented in figure 2, illumination of the desired plane was achieved by a Beamtech Vlite-Hi-527-30 high-speed double-pulsed laser with a minimum energy of 30 mJ pulse−1 at 1 kHz frame rate. The laser pulse duration at the full-width-half-maximum (FWHM) location was less than 200 ns. The thickness of the laser sheet was approximately 1.5 mm. Because the steel models were opaque, the laser sheet could only illuminate the flow field above the airfoil leeside and in the wake. A Pco.dimax HS4 high-speed CMOS camera was arranged at the bottom to capture PIV image pairs. Thus, the instantaneous particle distributions and section deformations could be simultaneously recorded. The sampling frequency of image pairs was set to 800 Hz, also satisfying the requirements of time resolution. Due to the storage limitation of the camera, 8333 image pairs (namely 8333 snapshots of velocity fields) with the sampling time of approximately 10 s could be captured at one time. The diameters of most particles were approximately three pixels, so the peak-locking effect was negligible (Christensen Reference Christensen2004). The streamwise maximum stretching of particle images was less than two pixels, so its influence on the identification of particle image displacement should be small. The main PIV parameters are listed in table 1. The recorded 12-bit raw particle images were processed based on the multi-pass iterative Lucas–Kanade algorithm (MILK) accelerated by graphic processing units (GPUs) to obtain original velocity fields (Champagnat et al. Reference Champagnat, Plyer, Le Besnerais, Leclaire, Davoust and Le Sant2011; Pan et al. Reference Pan, Xue, Xu, Wang and Wei2015). The interrogation window size was set to 32 × 32 pixels with a 75 % overlap. The approach of recognizing membrane deformation was elaborated in previous studies (He & Wang Reference He and Wang2020; Hu, Feng & Wang Reference Hu, Feng and Wang2020; He et al. Reference He, Guo and Wang2022). It can provide a pixel accuracy of 0.08 % c (0.1/120 ≈ 0.08 %) with a resolution of 0.1 mm pixel−1, the same as the magnification of PIV.
PIV parameters.

The synchronous measurements on forces, deformations and flow fields were controlled by a MicroVec Micropulse-725 synchronizer. The four channels of the synchronizer were linked to a data acquisition card, a high-speed camera and the two heads of the laser. The deformation and flow field information were contained in the particle images simultaneously, so they were strictly synchronized. The synchronization of forces, deformations and flow fields was realized by controlling the accordant starting time of these three samplings. By setting the pulse period, pulse delay and other parameters of the synchronizer, the sampling frequency and straddle time could be adjusted. The control error of the synchronizer was less than 0.25 ns, which was high enough for accurate synchronous control.
2.3. Control parameters
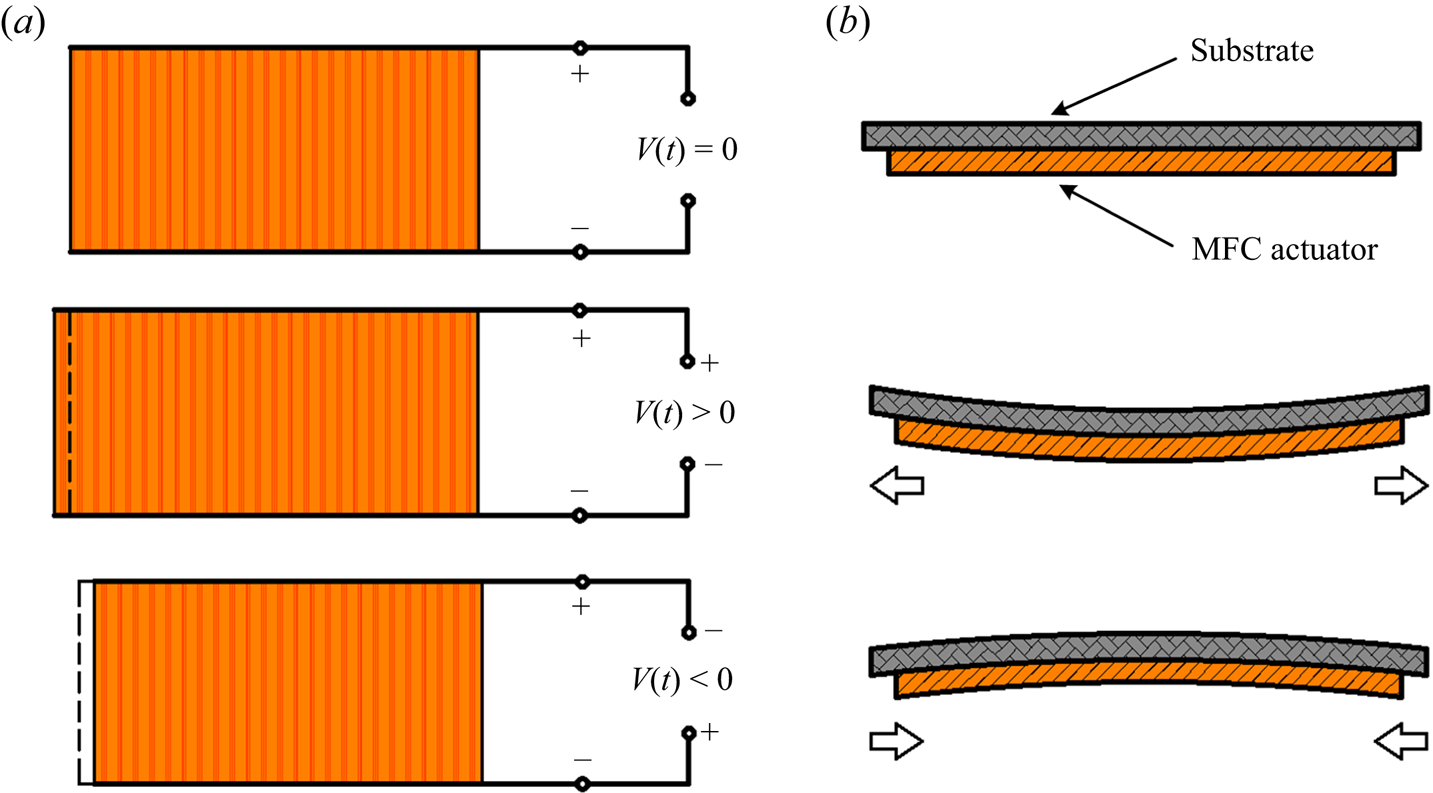
In the experiment, the active control was realized by piezoelectric MFC actuators. The MFC is a layered, planar actuation device that employs rectangular cross-section, unidirectional piezoceramic (PZT) fibres embedded in a thermosetting polymer matrix. This active, fibre-reinforced layer is then sandwiched between copper-clad Kapton film layers that have an etched interdigitated electrode pattern (Bilgen et al. Reference Bilgen, Kochersberger, Diggs, Kurdila and Inman2007). It has both direct and inverse piezoelectric effects. This study used the inverse piezoelectric effect of the MFC. The working principle is shown in figure 3. Under applied voltage signals, the MFC actuator will undergo extension or contraction, driving the substrate to bend and resulting in the periodically transverse membrane vibration.
Working principle of the MFC actuator (Feng et al. Reference Feng, Guo, Wang and Xu2022).

To reinforce the 2-D property of the active controller along the spanwise direction, the three MFC actuators shown in figure 1 were connected into the circuit in parallel. It could be observed from a monitoring UNI-T UPO2104CS oscilloscope that the phase difference of the three electrical signals was zero. The quasi-2-D property at the actively controlled region is further verified in Appendix B. The maximum and minimum operating voltages of the MFC actuators were +1500 V and −500 V, respectively. To ensure sufficient control intensity and safety, a RIGOL DG1022U function/arbitrary waveform generator was used to produce a sinusoidal voltage signal with bias. The valley value of the signal was −1.5 V and the peak value was +7.5 V. The voltage signal from the generator was further amplified by a Smart Material HVA 1500/50-4 high-voltage amplifier with a voltage gain of 200 V/V. Consequently, the voltage signal could be amplified into the range of −300 V to +1500 V to actuate MFC to work normally. Meanwhile, the actuation signal was real-time monitored by the oscilloscope. The final actuation voltage signal is
 \begin{equation}V(t) = {\textstyle{1 \over 2}}{V_{pp}}\sin (2{\rm \pi}{f_a}) + {V_{bias}},\end{equation}
where Vpp is the peak-to-peak value of actuation voltage, fa is the actuation frequency and Vbias is the bias voltage of +600 V. According to Leighton & Huang (Reference Leighton and Huang2010), the MFC actuator bonded to the substrate can be treated as a ‘piezoelectric unimorph beam’ structure. In this structure, the bending displacement is linearly correlated to the applied electric field. Accordingly, the mean deformation of the actuators is correlated to the mean actuation voltage (essentially the bias voltage). Actuation voltage and actuation frequency are two important control parameters in this experiment. By changing their amplitudes, the active control of flexible membrane could be realized. Furthermore, two non-dimensional parameters can be obtained, namely, reduced frequency 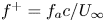 ${f^ + } = {f_a}c/{U_\infty }$ and reduced voltage
 ${V^ + } = {V_{pp}}/{({V_{pp}})_{max}}$. The reduced voltage is non-dimensionalized by the maximum peak-to-peak value of
 ${({V_{pp}})_{max}} = 1800\;\textrm{V}$. The control parameters are listed in table 2.
Control parameters.

The control effects of  ${f^ + }$ and
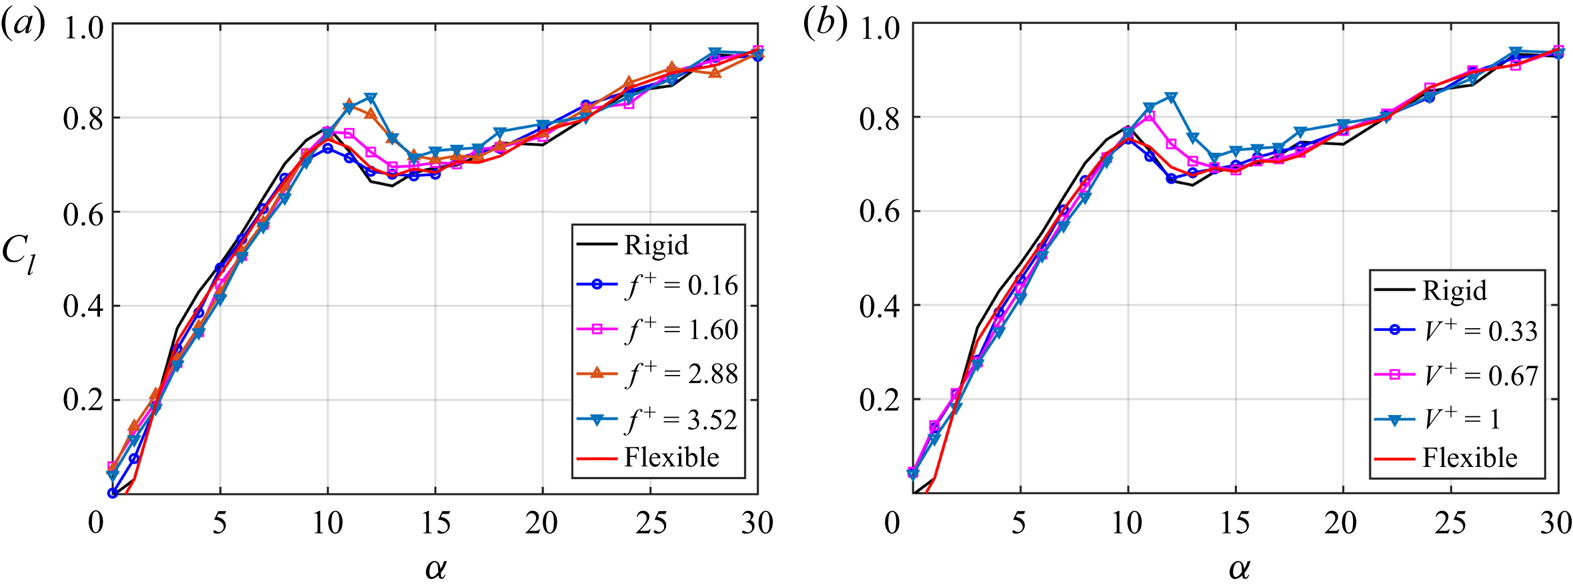
 ${V^ + }$ on the lift coefficients are shown in figure 4. Rigid and flexible cases are also plotted. In figure 4(a),
 ${V^ + }$ is fixed to 1, and
 ${f^ + }$ is 0.16, 1.60, 2.88 and 3.52. It can be found that when α < 10° and α > 14°, there is little difference between the actively controlled airfoil at each
 ${f^ + }$. When 10° ≤ α ≤ 14°, the lift coefficient and stall angle of attack of the actively controlled airfoil gradually increase with the increase of
 ${f^ + }$. In figure 4(b),
 ${f^ + }$ is fixed to 1, and
 ${V^ + }$ is 0.33, 0.67 and 1. The control effect of
 ${V^ + }$ is similar to that of
 ${f^ + }$. When 10° ≤ α ≤ 14°, the lift coefficient and stall angle of attack of the actively controlled airfoil gradually increase with the increase of
 ${V^ + }$. Therefore, when the control parameters are
 $({f_a},{V_{pp}}) = (220,1800)$, the active control has the best effect on improving the aerodynamic characteristics. The corresponding non-dimensional parameters are
 $({f^ + },{V^ + }) = (3.52,1)$. Moreover, when
 ${V^ + } = 0.33$, the aerodynamic performance of the actively controlled airfoil is slightly worse than the flexible airfoil, implying that the active actuation is not necessarily better than passive flow control in certain cases.
Effects of control parameters on lift coefficients. (a) Effects of reduced frequency; (b) effects of reduced voltage.

3. Mean characteristics
3.1. Mean aerodynamics
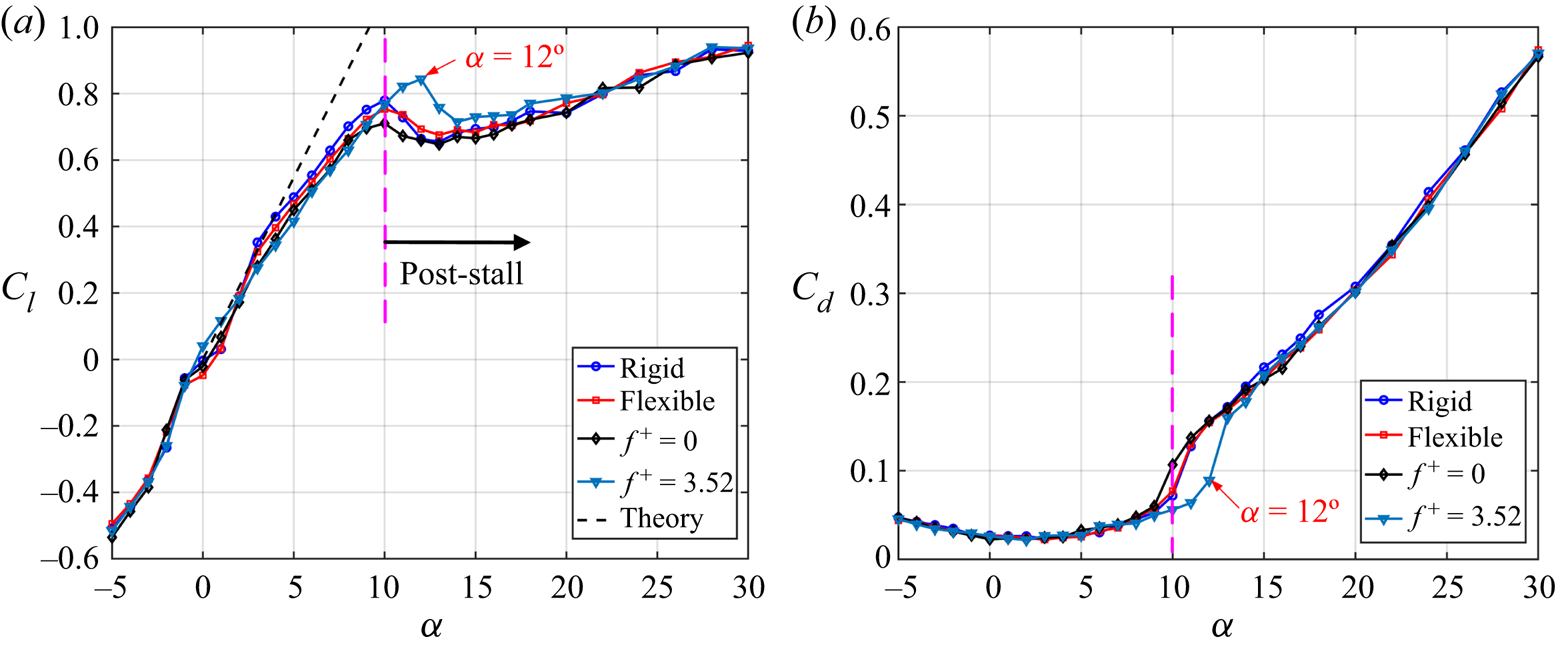
The aerodynamic coefficient curves of each model are first shown in figure 5. Except for the rigid and flexible airfoils, two parameter combinations of  $({f^ + },{V^ + }) = (0,0)$ (without actuation case) and
 $({f^ + },{V^ + }) = (3.52,1)$ (best actuation case) for the actively controlled airfoil are compared. The black dashed line in figure 5(a) is the lift curve Cl = 2α for linearized thin-airfoil theory. As presented in figure 5(a), when α ≤ 5°, the lift coefficients of each airfoil are basically consistent with the thin-airfoil theory, which verifies the accuracy of force measurement. With the increase of α, the lift variation of these models is different individually. When α < 0°, the lift curves of the rigid airfoil, flexible airfoil and actively controlled airfoil collapse well. When 0° ≤ α ≤ 10°, four models present a competitive relationship in lift characteristics, but the overall lift difference is small. When α > 10°, obvious difference appears in the lift curves. For the rigid airfoil, the stall angle of attack is α = 10°. After that, the rigid airfoil will gradually suffer stall at α > 10°, where the lift coefficient will decrease sharply. However, for the actively controlled airfoil, the lift will further increase at α > 10°. Compared with the rigid airfoil, the stall α of the actively controlled airfoil is delayed from 10° to 12°. The maximum lift coefficient is increased from 0.780 to 0.844 with an increment of 8.2 %. At α = 12°, the lift coefficient increment from 0.664 to 0.844 is the largest, which is 27.1 %. In short, the above results indicate that through proper active control, the maximum lift of the airfoil can be improved and the stall can be delayed. In addition, it can be found in figure 5(a) that the lift of each airfoil after stall (α > 15°) will further increase, which is consistent with previous studies on low-Reynolds-number wings (Michos, Bergeles & Athanassiadis Reference Michos, Bergeles and Athanassiadis1983; Zhou et al. Reference Zhou, Alam, Yang, Guo and Wood2011; Guo et al. Reference Guo, He, Wang and Wang2021).
Aerodynamic coefficients. (a) Lift curves; (b) drag curves.

The drag curves of the airfoils are displayed in figure 5(b). When α ≤ 10°, the drag coefficients of the rigid and the actively controlled airfoils are basically the same. When α > 10°, the drag coefficient of the rigid airfoil increases sharply due to stall, while the drag coefficient of the actively controlled airfoil does not increase significantly until α = 12°. It means that the active control can achieve lift-enhancement and drag-reduction simultaneously in the angle of attack range where the rigid airfoil encounters stall.
In addition, it can be discovered in figure 5 that there is little difference between the aerodynamic performance (both the lift and the drag) of the flexible and rigid airfoils. The without actuation case  $({f^ + },{V^ + }) = (0,0)$ is also close to the former two airfoils. These findings indicate that the passive control method by simply changing the flexibility of the upper airfoil surface can hardly improve the aerodynamic characteristics, which is totally different from the previous research on a single-layer membrane airfoil (Rojratsirikul et al. Reference Rojratsirikul, Wang and Gursul2009; Bleischwitz et al. Reference Bleischwitz, de Kat and Ganapathisubramani2017; He & Wang Reference He and Wang2020; He et al. Reference He, Guo and Wang2022).
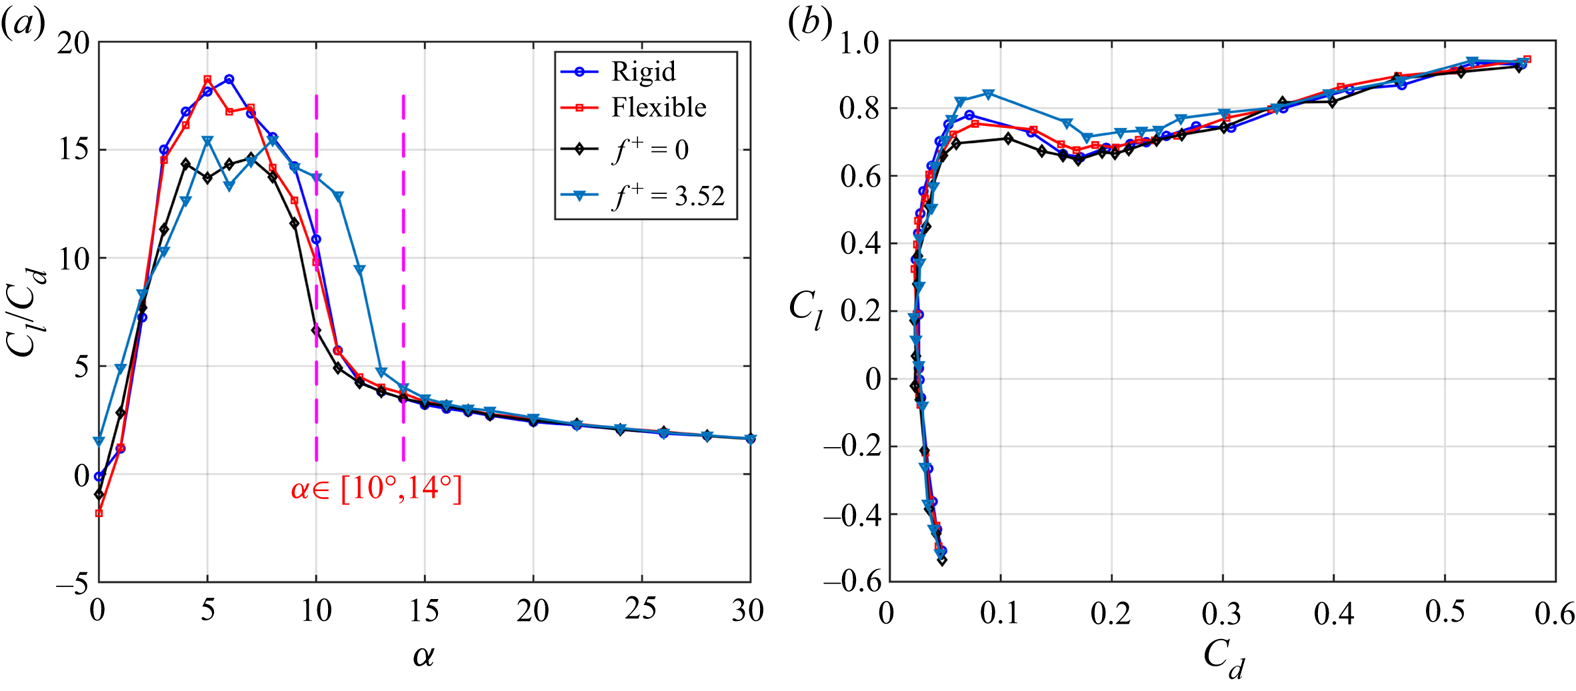
Figure 6 shows the lift-to-drag ratios and polar curves of the models, wherein the lift-to-drag ratios are exhibited in figure 6(a). When α < 10°, the maximum lift-to-drag ratio of the rigid airfoil is higher than that of the actively controlled airfoil, indicating that the active control cannot improve the maximum lift-to-drag ratio before stall. When 10° ≤ α ≤ 14°, active control can greatly improve the lift-to-drag ratio of the rigid airfoil in the post-stall state due to its advantages of lift-enhancement and drag-reduction. At α = 11° and 12°, the increments of the lift-to-drag ratios of the actively controlled airfoil are 126 % and 121 % compared with the rigid airfoil, respectively. With the further increase of α (α ≥ 15°), the lift-to-drag ratio of each model is completely consistent, indicating the active control no longer has advantages. Additionally, the polar curves are shown in figure 6(b). It is also found that the actively controlled airfoil has the best aerodynamic performance at approximately the first peak of lift curve. In a word, the best application environment of the actively controlled airfoil is at 10° ≤ α ≤ 14°, where the rigid airfoil is in the post-stall state. By active control, the disadvantage of premature stall of the rigid airfoil is overcome, and better aerodynamic performance is obtained.
Relationship between lift and drag. (a) Lift-to-drag ratios; (b) polar curves.

3.2. Active control efficiency
According to Seifert (Reference Seifert2015), the active control efficiency can be evaluated by the first, second and fourth Aerodynamic Figures of Merit (AFM), which are
 \begin{gather}AFM1 = \frac{{{U_\infty }{L_a}/({U_\infty }{D_a} + {P_a})}}{{{{(L/D)}_b}}},\end{gather}
 \begin{gather}AFM2 = \frac{{{U_\infty }({L_a} - {W_a} + {W_s})/({U_\infty }{D_a} + {P_a})}}{{{{(L/D)}_b}}},\end{gather}
 \begin{gather}AFM4 = \frac{{{U_\infty }{D_a} + {P_a}}}{{{U_\infty }{D_b}}},\end{gather}
where AFM1 evaluates the efficiency of boundary layer separation control as well as lift-to-drag ratio enhancement, AFM2 considers the weight for flight based on AFM1 and AFM4 evaluates the efficiency of drag reduction. The subscript ‘b’ is the baseline case (rigid airfoil) and the subscript ‘a’ is the actuation case (actively controlled airfoil). Here, Wa is the total weight of the actuation system and Ws is the weight savings due to active control, and Pa is the total power consumption of the actuator. Referring to Bai et al. (Reference Bai, Zhou, Zhang, Xu, Wang and Antonia2014), Pa is related to the dissipation of the PZT actuators operated at an actuation frequency fa and peak-to-peak value of actuation voltage Vpp, which are calculated by
 \begin{equation}{P_a} = 2{\rm \pi} N{f_a}C\tan (\delta) {\left( {\frac{{{V_{pp}}}}{{2\sqrt 2 }}} \right)^2},\end{equation}
where N = 3 is the total number of MFC actuators, C = 8.7 nF is the capacitance of the MFC and tan(δ) = 2 % is the dissipation factor of the PZT material used in the MFC (Nováková & Mokrý Reference Nováková and Mokrý2011). According to (3.4), Pa equals to 0.29 W for the best actuation case  $({f_a},{V_{pp}}) = (220,1800)$ in this study.
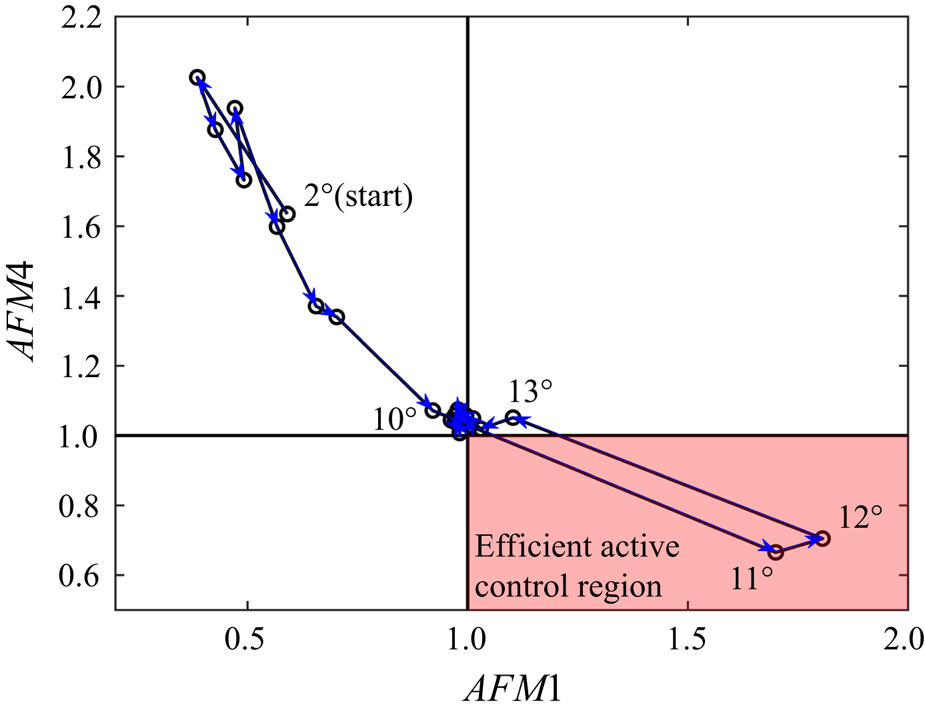
In (3.1), when AFM1 > 1, the separation control is efficient for additional power consumption. While in (3.3), when AFM4 < 1, the drag reduction is efficient for additional power consumption. As a result, AFM1 > 1 and AFM4 < 1 are preferred for efficient active control. The variations of AFM1 and AFM4 from α = 2° to 30° in the current study are shown in figure 7. It can be found that the two points α = 11° and 12° are in the efficient active control region. Although the drag of the actively controlled airfoil is lower than that of the rigid airfoil at α = 10° (see figure 5b), the additional power consumption makes AFM4 > 1, which is inefficient for drag reduction.
Variations of AFM1 and AFM4 from α = 2° to 30° for the actively controlled airfoil.

In addition, it is true that the active control system can bring additional weight, but it depends on the applications. It was reported by Seifert (Reference Seifert2015) that the active control system could replace or reduce the weight of an existing systems, such as simplified high-lift configurations. The weight for flight could be saved as long as Wa < Ws for AFM2 in (3.2).
3.3. Flow statistical characteristics
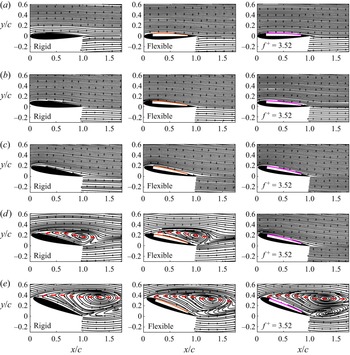
PIV measurement was further conducted at different angles of attack. The time-averaged streamlines are displayed in figure 8. The leeward skins of flexible and actively controlled airfoils are illustrated by time-averaged membrane deformations. The red dashed curves in figures 8(d) and 8(e) denote the positions where the mean streamwise velocity component equals to 0  $(\langle U\rangle = 0)$, which represent the scale of the leeward separation region (Munday & Taira Reference Munday and Taira2018). It can be seen from figure 8(a–c) that before the occurrence of stall (α ≤ 10°), the time-averaged flow is attached to the leeside of the airfoils without separation. Therefore, each airfoil shows similar aerodynamic characteristics in figure 5(a) when α ≤ 10°. However, in figure 8(d), there are large recirculation regions over the rigid and flexible airfoils, indicating the flow around them encounters severe separation at α = 12°. The scales of the two separation regions are approximately identical, implying the passive deformation in this experiment has little effect on the flow separation over the airfoil. This phenomenon explains why the difference between the aerodynamic characteristics of the flexible and rigid airfoils is small, as shown in figure 5, and further elucidates that simply changing the flexibility of the upper airfoil surface can hardly improve the aerodynamic characteristics. The flow around the actively controlled airfoil is completely different from the former two airfoils. The separation region over the airfoil totally disappears by active control and the streamlines pass smoothly along the airfoil surface. When α increases to 20° in figure 8(e), the three airfoils have large and similar recirculation regions, which means that both the passive and active control in the current study can hardly suppress the flow separation and improve the aerodynamic performance at high angle of attack. To sum up, the lift-enhancement and drag-reduction of the actively controlled airfoil in the range of 10° ≤ α ≤ 14° is attributed to the effective suppression of flow separation over the leeward surface.
Time-averaged streamlines at different angles of attack: (a) α = 0°; (b) α = 4°; (c) α = 10°; (d) α = 12°; (e) α = 20°. The leeward skins of flexible and actively controlled airfoils are illustrated by time-averaged membrane deformations. The scales of separation regions are illustrated by the line of  $\langle U\rangle = 0$, depicted as the red dashed curves.

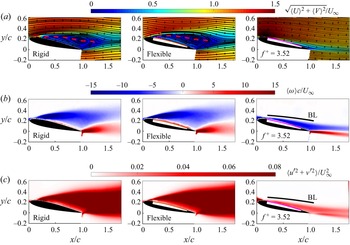
According to the mean aerodynamics in figure 5 and the time-averaged streamlines in figure 8, the maximum lift-enhancement for the actively controlled airfoil is achieved at α = 12°, so the statistical characteristics of the flow field around airfoils are analysed at α = 12° and shown in figure 9. Figure 9(a) exhibits the non-dimensional time-averaged velocity 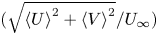 $(\sqrt {{{\langle U\rangle }^2} + {{\langle V\rangle }^2}} /{U_\infty })$ contours as well as the time-averaged streamlines. The good effect of active control on suppressing flow separation can be further observed. Figure 9(b) illustrates the non-dimensional time-averaged vorticity
 $(\langle \omega \rangle c/{U_\infty })$ contours. The negative and positive regions represent the clockwise and counterclockwise vorticity in the leading- and trailing-edge shear layers, respectively. Above the airfoil surface, the vorticity of the rigid and flexible airfoils is concentrated in the separated shear layer, while the vorticity of the actively controlled airfoil is close to the airfoil surface, which further indicates the flow separation is suppressed by the actively controlled airfoil.
Flow statistical characteristics at α = 12°. (a) Time-averaged velocity and streamlines; (b) time-averaged vorticity; (c) turbulent kinetic energy. Each row includes different models.

Moreover, the non-dimensional turbulent kinetic energy (TKE, 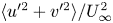 $\langle {u^{\prime2}} + {v^{\prime2}}\rangle /U_\infty ^2$) is presented in figure 9(c). TKE characterizes the fluctuation characteristics of the flow around the airfoil. Similar to the vorticity distribution in figure 9(b), TKE of the former two airfoils is concentrated in the separated shear layer, while TKE of the actively controlled airfoil is close to the airfoil surface. Compared with the former two airfoils, the actively controlled airfoil has a slightly higher TKE level in the near-wall region. Nevertheless, the strong unsteadiness in the recirculation region is significantly weakened due to the suppression of flow separation, resulting in an obvious reduction in the overall fluctuation level. Figures 9(b) and 9(c) further show the boundary layer range over the actively controlled airfoil at α = 12°. The boundary layer thickness is calculated by integrating spanwise vorticity along the wall normal direction (more details will be described in § 4.1.2). The near-wall TKE is shown to be almost completely distributed in the leeward surface boundary layer, which means that the fluctuations in the boundary layer caused by active control are closely related to the separation suppression and aerodynamic performance improvement. The fluctuations of active control intensify the momentum mixing in the boundary layer, reduce the inverse pressure gradient, suppress the flow separation and finally improve the lift coefficient at post-stall angles of attack. This is similar to the lift-enhancement mechanism of passive vibration of single-layer membrane airfoil (He et al. Reference He, Guo and Wang2022).
4. Unsteady aerodynamics and fluid–structure interaction
In this section, the unsteady coupling mechanism of aerodynamic forces, membrane vibrations and flow fields of the actively controlled airfoil will be analysed in combination with frequency spectral analyses. Here, α = 12° is still selected due to the maximum lift-enhancement and the best suppression effect of flow separation.
4.1. Spectral characteristics
The spectral characteristics of the unsteady aerodynamics and fluid–structure interaction of the actively controlled airfoil are first studied. The spectra of instantaneous aerodynamic forces are obtained by fast Fourier transformation (FFT). The spectra of global membrane vibrations and flow fields are obtained by Fourier mode decomposition (FMD) proposed by Ma et al. (Reference Ma, Feng, Pan, Gao and Wang2015). The main principle of FMD is given here. For the selected flow fields, single-point discrete Fourier transform (DFT) is first applied to velocity data at every mesh node to get a Fourier mode matrix ck,
 \begin{equation}{\boldsymbol{c}_k} = \frac{1}{N}\sum\limits_{n = 0}^{N - 1} {{\boldsymbol{F}_n}\,{\textrm{e}^{ - \textrm{i}(2{\rm \pi} k/N)n}}} ,\end{equation}
where N = 8333 is total sampling number of image pairs, Fn is the original velocity complex matrix where the real and imaginary parts are streamwise and vertical velocities, respectively. The global power spectrum density (PSDk) is further defined as
 \begin{equation}PS{D_k} = \left\|{\frac{{2N|{\boldsymbol{c}_k}{|^2}}}{{{\rm \pi}{f_s}}}} \right\|,\end{equation}
where  $||\cdot ||$ is the Frobenius norm, fs is the sampling frequency. For the membrane vibrations, DFT of membrane displacements at 300 chordwise equidistant positions is similarly conducted through (4.1) and the PSD of global membrane vibrations is then obtained by (4.2).
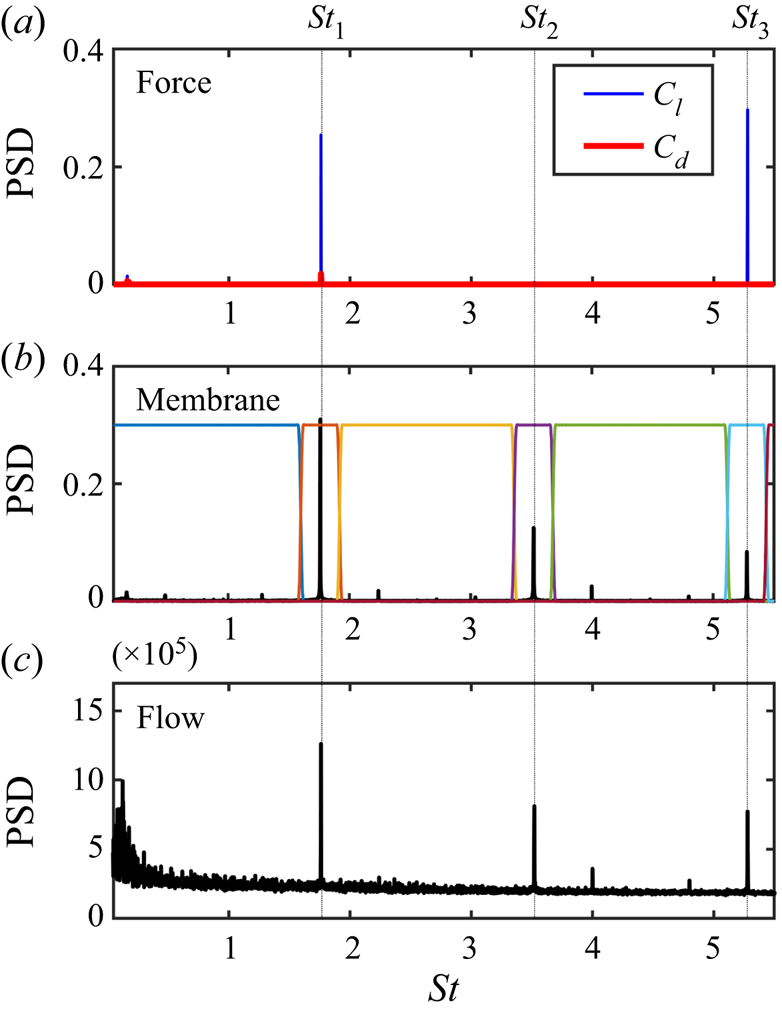
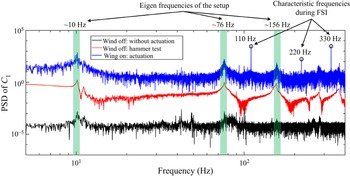
The frequency spectra of the actively controlled airfoil at α = 12° are summarized in figure 10. The frequency is non-dimensionalized as the Strouhal number  $St = fc/{U_\infty }$. In figure 10, St 1 = 1.76, St 2 = 3.52 and St 3 = 5.28 correspond to 110 Hz, 220 Hz and 330 Hz, respectively. Here, St 2 and St 3 are the second and third harmonics of St 1. According to the spectra of aerodynamic forces in figure 10(a), there are two peaks St 1 and St 3 in the lift spectrum. The PSD of the St 3 peak is slightly higher than the St 1 peak, so the dominant frequency of the lift is St 3. Different from the lift, the dominant frequency of the drag is St 1. Comparing the spectra of global membrane vibrations (figure 10b) and flow fields (figure 10c), it can be found that their dominant frequencies are both St 1. The PSD of the two harmonic peaks (St 2 and St 3) decreases in turn. In sum, the drag, membrane vibrations and flow fields are completely coupled with the same dominant frequency of St 1. Although the dominant frequency of lift is St 3 instead of St 1, the PSD peaks of the two frequencies are close, which means that the instantaneous lift is determined by both St 1 and St 3.
Spectral characteristics of the actively controlled airfoil at α = 12°. (a) Spectra of the aerodynamic forces; (b) spectrum of global membrane vibrations; (c) spectrum of global flow fields. Seven frequency bands in the membrane spectrum are defined by a frequency splitting vector for the following mPOD process.

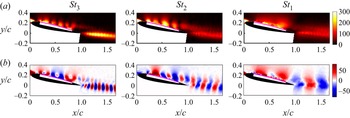
Figures 11(a) and 11(b) show the energy distributions and Fourier modes based on vertical velocity components corresponding to the three frequencies at α = 12°. The three disturbances with different frequencies are shown to induce coherent structures continuously convecting downstream in the leeward surface boundary layer. Meanwhile, according to the energy distribution, the disturbances of St 1 and St 2 are mainly concentrated on the airfoil leeward surface. The disturbance of St 3 is concentrated both on the airfoil leeward surface and in the wake. Next, the frequency response characteristics of membrane and flow fields under active control will be analysed.
Energy distributions and Fourier modes based on vertical velocity components corresponding to the three frequencies at α = 12°. (a) Energy distributions; (b) Fourier modes. The frequencies from left to right are St 3, St 2 and St 1, respectively.

4.1.1. Frequency response characteristics of membrane vibrations
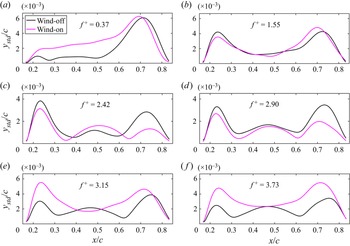
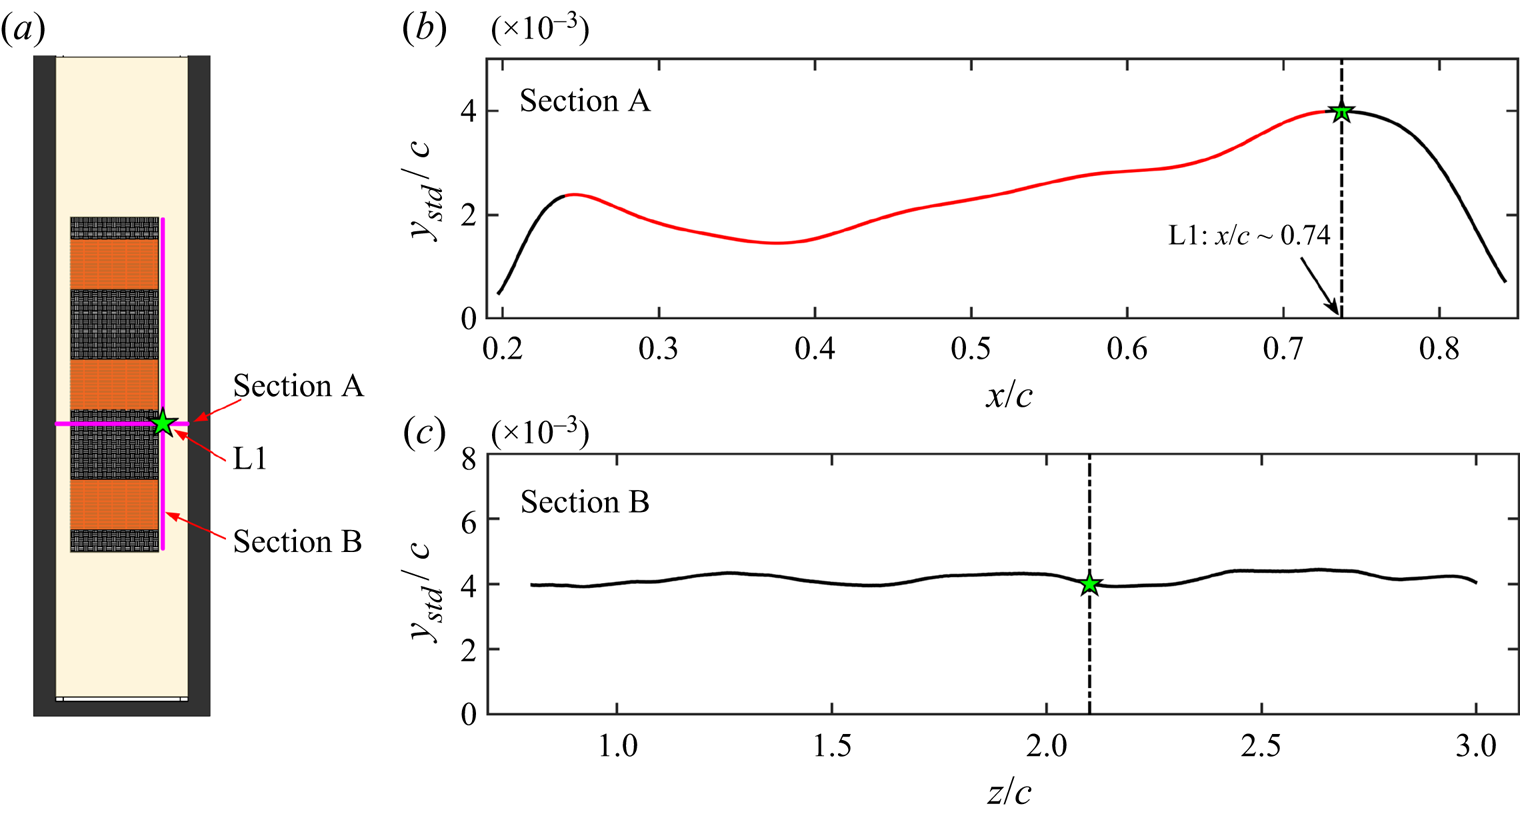
It is an interesting behaviour in figure 10(b) that the dominant frequency of membrane vibrations is half of the reduced frequency, namely,  $S{t_1} = 0.5{f^ + }$. To determine the underlying mechanism, frequency response characteristics of membrane vibrations are investigated at reduced frequencies from 0.37 to 3.73. Membrane deformations of the actively controlled airfoil are measured at wind-off and wind-on. First, the chordwise vibration amplitudes ystd (standard deviations of the vertical membrane displacements) are shown in figure 12. It can be seen in figure 12(a–d) that the number of ystd peaks at wind-on is the same as that at wind-off, which means that the vibration behaviour of the membrane is similar at wind-on and wind-off when
 ${f^ + } < 3$. However, in figures 12(e) and 12( f), ystd has three peaks at wind-off, but it only has two peaks at wind-on. It means that the vibration behaviour at wind-on changes abruptly when
 ${f^ + } > 3$.
Chordwise vibration amplitudes: (a)  ${f^ + } = 0.37$; (b)
 ${f^ + } = 1.55$; (c)
 ${f^ + } = 2.42$; (d)
 ${f^ + } = 2.90$; (e)
 ${f^ + } = 3.15$; ( f)
 ${f^ + } = 3.73$. The black and magenta curves indicate the wind-off and wind-on cases, respectively.

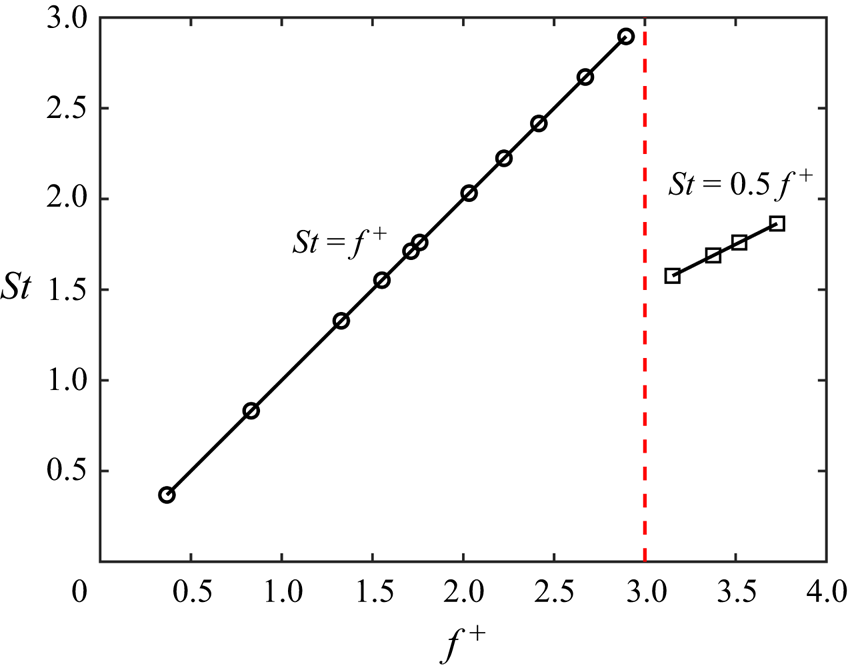
Furthermore, the spectral characteristics are analysed. The dominant frequencies of membrane vibrations at different reduced frequencies at wind-on are displayed in figure 13. When  ${f^ + } < 3$, the dominant frequency of membrane vibration is the same as the reduced frequency, that is,
 $S{t_1} = {f^ + }$. However, when
 ${f^ + } > 3$, the dominant frequency of membrane vibration is half of the reduced frequency, that is,
 $S{t_1} = 0.5{f^ + }$. Thus, the half-frequency lock-in phenomenon at
 ${f^ + } > 3$ is newly discovered in this paper.
Relationship between dominant frequencies of membrane vibrations and reduced frequencies at wind-on.

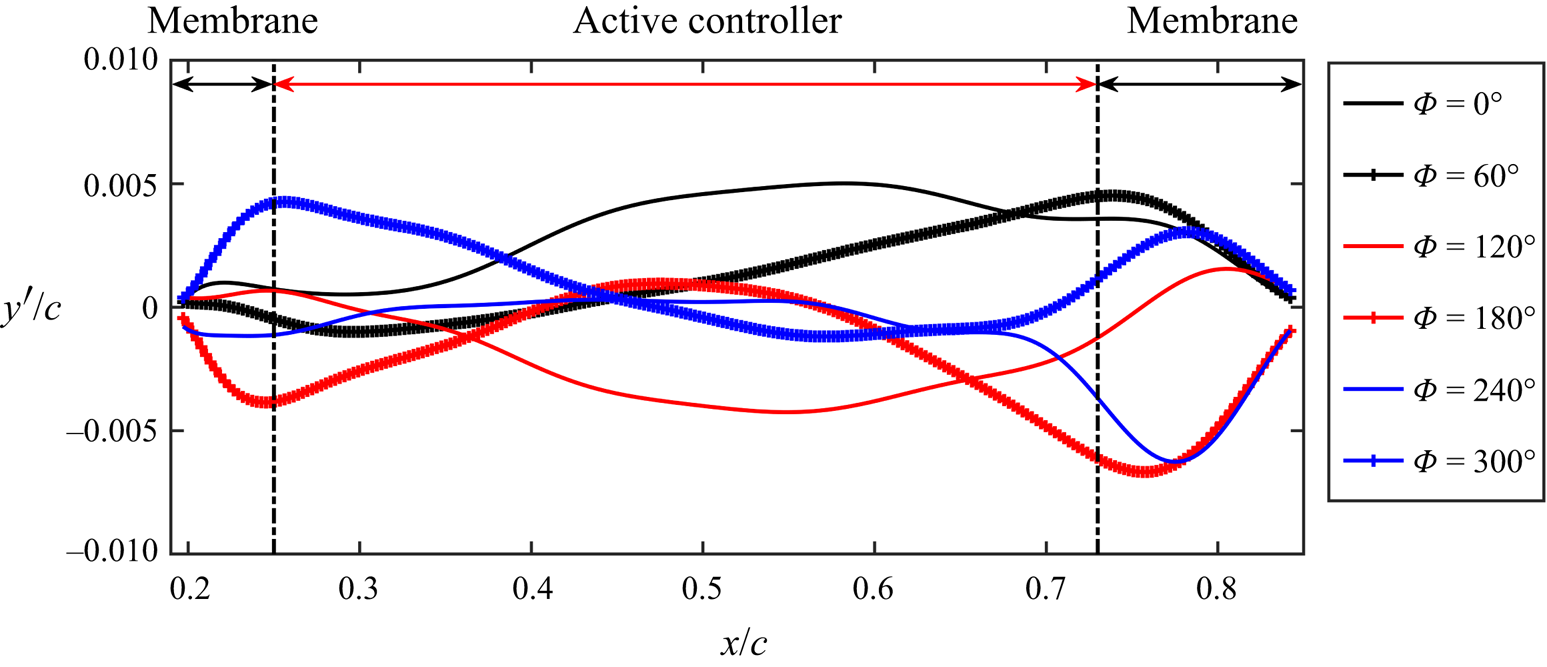
The reason for the half-frequency lock-in is then investigated based on instantaneous membrane vibrations at  ${f^ + } = 3.52$. Due to the strong periodicity of the active control, the instantaneous membrane vibration signals are adopted as the reference for the phase-averaging process. Here, the instantaneous membrane vibrations in the time series of 8333 snapshots are cross-correlated with the membrane vibration at the basic instant (snapshot No. 1000 is arbitrarily selected). The obtained correlation coefficient signal is then low-pass filtered and the information of the dominant vibration frequency (St 1) is retained. Hilbert transformation is then employed to get phase information (Pan, Wang & Wang Reference Pan, Wang and Wang2013). The phase-averaged membrane vibrations are plotted in figure 14. As shown, the active controller could incline and bend in a vibration cycle, driving the membrane to deform and vibrate.
Phase-averaged membrane vibrations of the actively controlled airfoil at α = 12°.

However, the membrane vibrations in figure 14 seem to be complicated. Hence, multi-scale proper orthogonal decomposition (mPOD), a data-driven reduced-order method proposed by Mendez, Balabane & Buchlin (Reference Mendez, Balabane and Buchlin2019), is used to analyse the frequency response characteristics of membrane vibrations. The mPOD combines multi-resolution analysis (MRA) with a standard POD. For MRA, the mPOD can split the correlation matrix into the contribution of different scales by a user-defined frequency splitting vector FV, retaining non-overlapping portions of correlation spectra. Then, standard POD is conducted upon these scales to extract their optimal eigenbases, which can be kept mutually orthogonal and finally assembled into a single mPOD basis. Briefly, mPOD provides an excellent compromise between energy optimality and spectral purity.
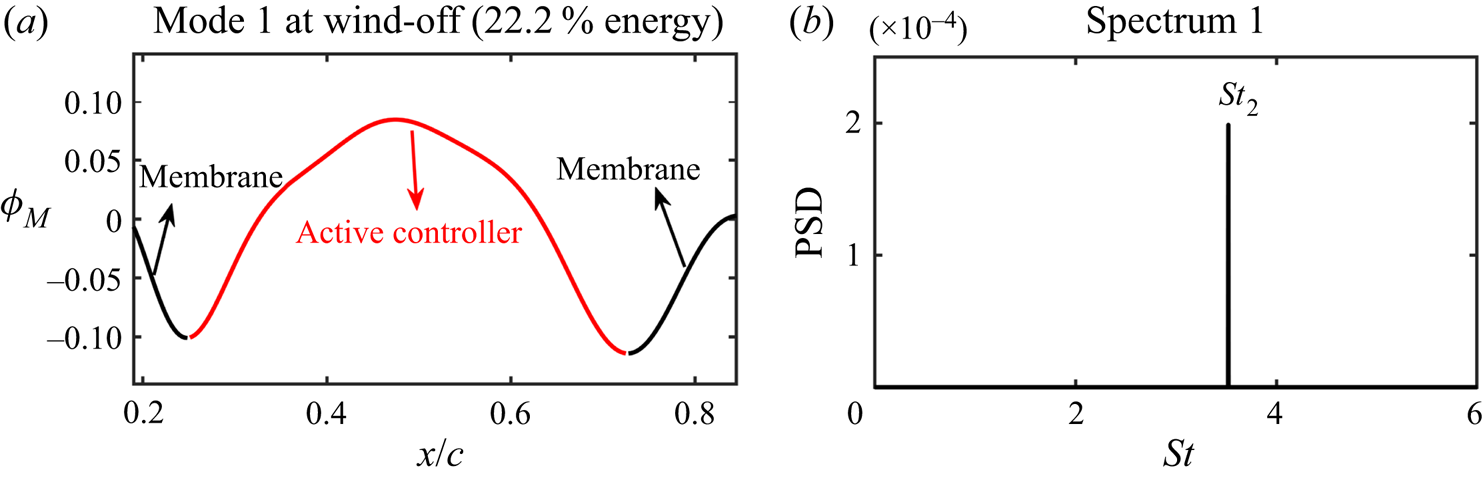
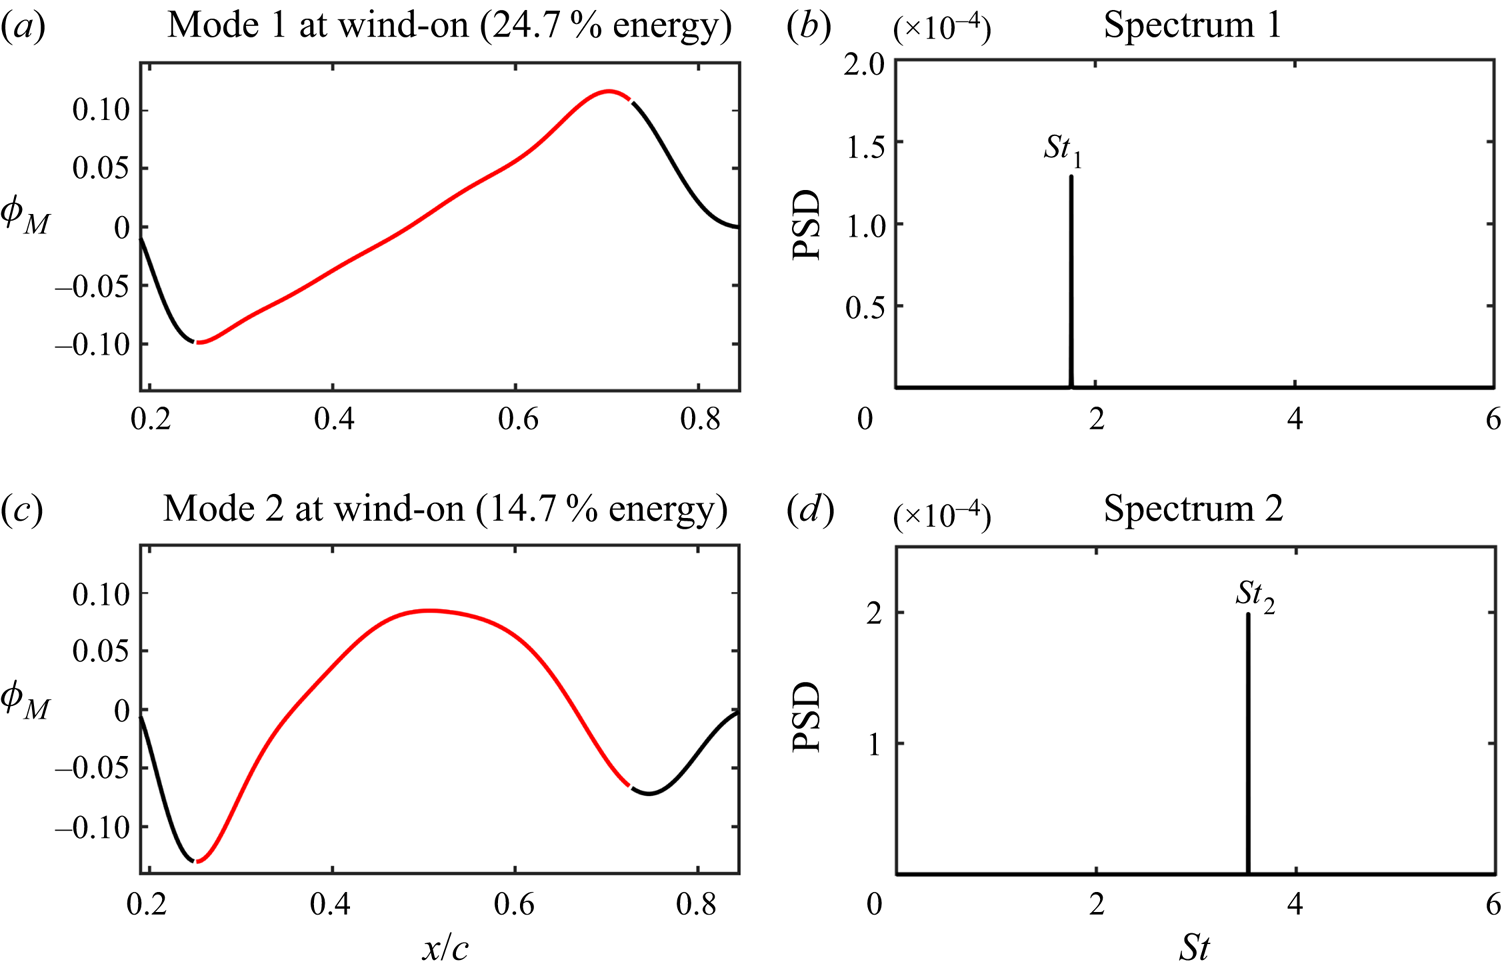
As shown in figure 10(b), seven frequency bands in the membrane spectra are defined by a frequency splitting vector FV = [100, 120, 210, 230, 320, 340] Hz to contain the three characteristic frequencies for mPOD. The corresponding non-dimensional frequency splitting vector is StV = [1.60, 1.92, 3.36, 3.68, 5.12, 5.44]. The wind-off and wind-on cases are both investigated. Figure 15 presents the mode shape and spectrum of the first mPOD mode at wind-off. Clearly, this mode is the ‘bending’ mode of the active controller with a dominant frequency of St 2 = 3.52. This frequency is equal to the reduced frequency  ${f^ + }$, which means that the bending mode is directly caused by the actuation. However, the most energetic mode at wind-on (shown in figure 16a) is the ‘inclining’ mode with a dominant frequency of St 1 = 1.76. In contrast, the bending mode becomes less energetic at wind-on (shown in figure 16c). Thus, the shift of the dominant vibration mode from bending to inclining is the reason for half-frequency lock-in when
 ${f^ + } > 3$.
mPOD results of the actively controlled airfoil at wind-off. (a) Mode shape of the first mPOD mode; (b) spectrum of the first mPOD mode.

mPOD results of the actively controlled airfoil at wind-on. (a) Mode shapes of the first two mPOD modes; (b) spectra of the first two mPOD modes.

4.1.2. Frequency response characteristics of flow fields
In figure 11, the disturbances of St 1, St 2 and St 3 are concentrated on the airfoil leeward surface, which may be related to the natural frequencies of the local shear layer. According to Ho & Huerre (Reference Ho and Huerre1984), Hsiao, Liu & Shyu (Reference Hsiao, Liu and Shyu1990), Wu et al. (Reference Wu, Lu, Denny, Fan and Wu1998) and Bohnker & Breuer (Reference Bohnker and Breuer2019), there exist the most unstable frequencies in the shear layer. The shear layer is sensitive to the disturbance of these frequencies, resulting in the roll-up and shedding of leading-edge vortices. The most unstable frequency is referred to as the natural frequency of the shear layer and denoted by  $f_{shear}^0$. The non-dimensional natural frequency is defined as
 \begin{equation}S{t_{shear}} = \frac{{f_{shear}^0\theta }}{{({U_\infty } + 0)/2}}\textrm{ = }\frac{{2f_{shear}^0\theta }}{{{U_\infty }}},\end{equation}
where θ is the momentum thickness which can be obtained by boundary layer thickness. The boundary layer thickness δ is defined as the wall-normal distance between the airfoil surface and the boundary layer edge  $(Y_N^{edge})$. The location of
 $Y_N^{edge}$ is at the separatrix between the boundary layer flow and the inviscid free stream (Wang & Wang Reference Wang and Wang2021). However, the standard boundary layer assumption (the velocity at the boundary layer edge equals to 0.99U∞) remains invalid due to the curved airfoil surface. Instead, as proposed by Marxen et al. (Reference Marxen, Lang, Rist, Levin and Henningson2009), the pseudo velocity attained by wall-normal integration of time-averaged spanwise vorticity
 $\langle \omega \rangle$ is used to determine
 $Y_N^{edge}$:
 \begin{equation}{u_{pseudo}} = \int_0^{Y_N} {\langle \omega \rangle \,\textrm{d}{Y_N}} ,\end{equation}
where  $Y_N^{}$ is the wall-normal coordinate with the origin on the airfoil surface. Here,
 $Y_N^{edge}$ is defined as the position where the variation of
 ${u_{pseudo}}$ converges along the wall-normal direction. Then the displacement thickness δ* and momentum thickness θ are calculated by the following equations:
 \begin{gather}\delta^\ast= \int_0^{Y_N^{edge}} {\left( {1 - \frac{{{u_{pseudo}}({Y_N})}}{{{u_{pseudo}}(Y_N^{edge})}}} \right)\,\textrm{d}{Y_N}} ,\end{gather}
 \begin{gather}\theta = \int_0^{Y_N^{edge}} {\left( {1 - \frac{{{u_{pseudo}}({Y_N})}}{{{u_{pseudo}}(Y_N^{edge})}}} \right)\frac{{{u_{pseudo}}({Y_N})}}{{{u_{pseudo}}(Y_N^{edge})}}\,\textrm{d}{Y_N}} .\end{gather}
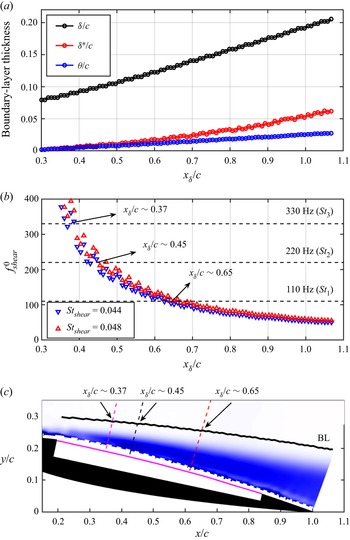
The streamwise variation of δ, δ* and θ of the actively controlled airfoil at α = 12° is illustrated in figure 17(a). Here,  ${x_\delta }$ is the streamwise locations of the boundary layer edge. As shown, the three thicknesses gradually increase along the streamwise direction. For the natural frequency of the shear layer,
 $S{t_{shear}}$ is empirically determined to be approximately 0.034 for a laminar flow and between 0.044 and 0.048 for a turbulent flow (Ho & Huerre Reference Ho and Huerre1984; Wu et al. Reference Wu, Lu, Denny, Fan and Wu1998). Because of the large disturbance of actuation, the flow state over the airfoil surface should be turbulent. Thus, the natural frequencies of the shear layer can be calculated via substituting the θ values obtained by (4.6) into (4.3). Then the streamwise variation of
 $f_{shear}^0$ is identified and shown in figure 17(b). The current PIV sampling frequency is 800 Hz. To meet the requirements of Nyquist sampling theorem, the ceiling of the y-axis in figure 17(b) is limited to 400 Hz. Due to the inverse proportional relationship with θ,
 $f_{shear}^0$ gradually transits from high frequency to low frequency along the streamwise direction. Figure 17(b) further shows the frequencies of St 3, St 2 and St 1 (as shown by three horizontal dashed lines). There are three intersection parts between these frequencies and the upper and lower limits of
 $f_{shear}^0$. By selecting the medians of these parts, the streamwise locations corresponding to the three disturbing frequencies can be obtained, which are
 ${x_\delta }/c\sim 0.37$, 0.45 and 0.65. It means that the three frequencies are likely to be amplified near these locations. In figure 17(c), the amplification locations of different disturbances are marked along the wall-normal direction in the flow field. Their relative positions with the airfoil can be seen more clearly, which are helpful to the following analyses of the unsteady coupling process.
Frequency response characteristics of flow field. (a) Streamwise variation of boundary layer thicknesses of the actively controlled airfoil at α = 12°; (b) streamwise variation of natural frequencies of the shear layer; (c) amplification locations of different disturbing frequencies. The background contour is the time-averaged vorticity.

4.2. Unsteady coupling process
After obtaining the Fourier modes for specific frequencies, the flow fields can be reconstructed from the modes with certain frequency bands based on the FMD method (Wang et al. Reference Wang, Feng, Wang and Li2018; Wang, Wang & Kim Reference Wang, Wang and Kim2019). The reconstructed flow fields can ensure the time localization in the current study, that is, the occurrence of a characteristic flow event in the reconstructed flow fields is at the same time as the original flow fields. Taking advantage of this feature, the original flow fields are decomposed and reconstructed by FMD, and the unsteady aerodynamics and fluid–structure coupling process corresponding to different frequencies are analysed. The frequency resolution of FMD in this study is Δf = 800/8333 = 0.096 Hz with a non-dimensional resolution of ΔSt = 1.5 × 10⁻³. For the frequencies of St 1, St 2 and St 3, three narrow bands of St 1 ± 2ΔSt, St 2 ± 2ΔSt and St 3 ± 2ΔSt are selected for reconstruction. As a result, three reconstructed flow fields are obtained, which are denoted as  $St_1^{recon}$,
 $St_2^{recon}$ and
 $St_3^{recon}$.
4.2.1. Coupling between instantaneous lift and flow fields
In this section, we first conduct cross-correlation between instantaneous lift and flow fields to analyse their relationship. The instantaneous lift fluctuation  ${C^{\prime}_l}$ and the global instantaneous swirl strength
 ${\lambda _{ci}}$ at every mesh node in the flow fields are selected as the correlation signals. Here,
 ${\lambda _{ci}}$, defined as the imaginary part of the complex eigenvalues of the velocity gradient tensor, is a vortex identification criterion and can distinguish the real vortical structures from the strong background shear flow. The
 ${\lambda _{ci}}$ values can characterize the strength of local vortical structures (Zhou et al. Reference Zhou, Adrian, Balachandar and Kendall1999). The cross-correlation equation is as follows:
 \begin{equation}{R_{{{C^{\prime}}_l}{\lambda _{ci}}}}(x,y,t) = \frac{{\langle {{C^{\prime}}_l}(t){\lambda _{ci}}(x,y,t)\rangle }}{{{\sigma _{{{C^{\prime}}_l}}}{\sigma _{{\lambda _{ci}}}}}}.\end{equation}
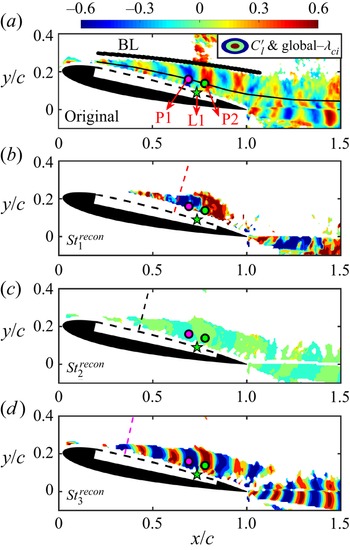
The spatial cross-correlation between two signals can be reflected by (4.7) with zero-time lag. The correlation results are displayed in figure 18, wherein, figure 18(a) is the correlation contour between lift fluctuation and original flow field. Figures 18(b)–18(d) show the correlation contours between lift fluctuation and three reconstructed flow fields  $St_1^{recon}$,
 $St_2^{recon}$ and
 $St_3^{recon}$, respectively. It can be seen from figure 18(a) that the correlation regions between
 ${C^{\prime}_l}$ and
 ${\lambda _{ci}}$ are mainly located inside the boundary layer. The correlation coefficient presents alternately positive and negative distributions over the airfoil leeward surface and in the wake. The minimum (R = −0.40) and maximum (R = 0.62) correlation coefficients over the leeward surface appear at points P1 and P2, respectively. Points P1 and P2 are respectively situated upstream and downstream of the point L1 with maximum vibration amplitude in the membrane. They are also at the vertical positions with maximum TKE (the black thin curve indicates the maximum TKE positions along the streamwise direction). Due to the negative clockwise vorticity over the airfoil leeward surface, the negative correlation at P1 means that when the clockwise vortex with the largest vorticity appears at P1, the lift reaches the maximum; when the vortex moves away from P1, the lift reduces to the minimum. In contrast, the positive correlation at P2 means that when the clockwise vortex with the largest vorticity appears at P2, the lift reduces to the minimum; when the vortex leaves P2, the lift reaches the maximum. Comparing the correlation contours between lift fluctuation and reconstructed flow fields, it can be found that the lift has obvious correlation with the reconstructed flow fields
 $St_1^{recon}$ (figure 18b) and
 $St_3^{recon}$ (figure 18d). However, the correlation level with
 $St_2^{recon}$ (figure 18c) is very low. These results indicate that the flow structures of St 1 and St 3 have significant effects on the lift, while the flow structures of St 2 have little influence. They further confirm the finding in figure 10 that the frequency of St 2 has negligible contribution to the PSD of the lift. In addition, by comparing figures 18(b) and 18(d), a surprising phenomenon is discovered near L1 that there are two regions with high correlation levels at around P1 and P2, indicating that these two regions over the airfoil have the most significant influence on the instantaneous lift. The swirl strength of clockwise vortices in these regions is closely related to the lift.
Global cross-correlation coefficient contours between the instantaneous lift fluctuation  ${C^{\prime}_l}$ and swirl strength
 ${\lambda _{ci}}$ at every mesh node in the flow field at α = 12°. (a)
 ${C^{\prime}_l}$ versus original flow field; (b)
 ${C^{\prime}_l}$ versus
 $St_1^{recon}$; (c)
 ${C^{\prime}_l}$ versus
 $St_2^{recon}$; (d)
 ${C^{\prime}_l}$ versus
 $St_3^{recon}$.

Moreover, the correlation concentration regions can reflect the location of the flow structures. In figures 18(b)–18(d), the amplification positions of three different disturbances St 1, St 2 and St 3 are marked along the wall-normal direction (consistent with figure 17c). It is shown that the three disturbances are amplified near each unstable position in the flow field, triggering the flow instability and causing the roll-up, downstream convection and shedding of coherent structures. So far, the generation mechanism of the coherent structures over the airfoil leeward surface in this study is verified by the shear layer theory. Here, St 1 and its harmonics are coupled with the theoretical natural frequencies of the leading-edge shear layer. Coherent structures with different scales and frequencies are generated near the most unstable positions. Combined with figure 9(c), the generation of these flow structures is accompanied by the enhancement of momentum mixing in the leeward surface boundary layer close to the wall. Finally, the flow structures help to suppress flow separation and improve the aerodynamic performance at post-stall angles of attack.
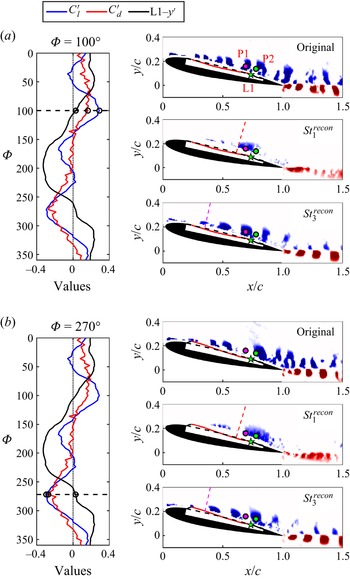
The aerodynamic forces, membrane vibrations and flow fields are averaged according to the phases in § 4.1.1 to obtain the final phase-averaged signals. As shown in figure 19, the curves on the left display time histories of the phase-averaged force fluctuation signals as well as phase-averaged vibration signal at L1. The contours on the right show the  ${\lambda _{ci}}$ distributions of phase-averaged flow fields. From top to bottom are the original and reconstructed flow fields. Because of the very low correlation level of the second harmonic in figure 18(c), the second harmonic reconstructed flow field is not shown in figure 19.
Phase-averages forces, membrane vibrations and flow fields at α = 12°. (a) Φ = 100° with the maximum lift; (b) Φ = 270° with the minimum lift. The curves on the left display time histories of the phase-averaged force fluctuation as well as phase-averaged vibration signals at L1. For clarity, the drag fluctuation  ${C^{\prime}_d}$ and vibration L1-y′ signals are multiplied by factors of 4 and 50, respectively. The contours on the right shows the
 ${\lambda _{ci}}$ distributions of phase-averaged flow fields. Phase-averaged membrane deformations with amplitudes amplified by a factor of five are appended for better display.

It can be seen from the curves in figure 19 that in a membrane vibration cycle with the dominant frequency St 1, the lift has a global maximum at Φ = 100° and a global minimum value at Φ = 270°. The phase difference between them is ΔΦ ≈ 180°, namely a half cycle. In addition, there are two other local maxima at Φ ≈ 220° and 350° as well as two local minima at Φ ≈ 40° and 170°. The results indicate that the lift has the spectral features of St 1 and St 3 simultaneously. The drag has only a maximum at Φ ≈ 70° and a minimum at Φ = 270° due to its dominant frequency St 1. These conclusions are consistent with the spectra of lift and drag in figure 10(a). In addition, it is presented that lift and drag reach their global minima simultaneously, which means that although the active control can successfully achieve the goal of lift-enhancement and drag-reduction, the largest reduction of instantaneous drag is accompanied by the cost of the lowest instantaneous lift.
The instantaneous flow fields are given in figure 19 at the phases where the lift reaches the global maximum (figure 19a) and minimum (figure 19b). Intuitively, at Φ = 100° with the maximum lift, there is a vortex concentrated at P1. At Φ = 270° with the minimum lift, a larger vortex is concentrated at P2. This further elucidates the distribution of correlation coefficients in figure 18 from the perspective of instantaneous vortical structures.
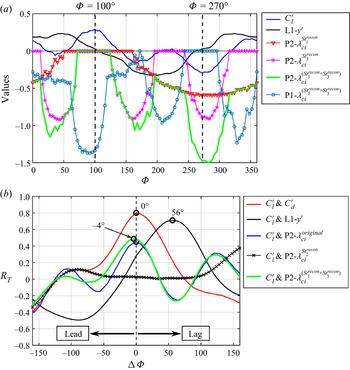
Furthermore, the phase-averaged time histories of  ${C^{\prime}_l}$, L1-y′, and instantaneous
 ${\lambda _{ci}}$ values at P1 and P2 (denoted as P1-
 ${\lambda _{ci}}$ and P2-
 ${\lambda _{ci}}$) in a membrane vibration cycle are given in figure 20(a). First, at Φ = 100° with the maximum lift, the swirl strength of the reconstructed flow fields
 $St_1^{recon}$ and
 $St_3^{recon}$ at P2, denoted as
 $\textrm{P2 - }\lambda _{ci}^{St_1^{recon}}$ and
 $\textrm{P2 - }\lambda _{ci}^{St_3^{recon}}$, both are equal to zero. At Φ = 270° with the minimum lift,
 $\textrm{P2 - }\lambda _{ci}^{St_1^{recon}}$ and
 $\textrm{P2 - }\lambda _{ci}^{St_3^{recon}}$ drop to near the global minima corresponding to the largest clockwise swirl strength. Second, the variation of lift is found to be in-phase with
 $\textrm{P2 - }\lambda _{ci}^{St_3^{recon}}$. The three minima of
 $\textrm{P2 - }\lambda _{ci}^{St_3^{recon}}$ are respectively located at Φ ≈ 40°, 160° and 280°, which are basically consistent with the instantaneous lift. However, the three minima of
 $\textrm{P2 - }\lambda _{ci}^{St_3^{recon}}$ are very close, but the three minima of lift show different magnitudes. It means that even if the lift is determined by St 1 and St 3 (see figure 10a), the effects of the two frequencies are different. Here, St 1 determines the phases of global maximum and minimum of lift, while St 3 determines the phases of local maxima and minima of lift. When the effects of the two frequencies are superposed, the lift can reach its global maximum and minimum. Therefore,
 $\textrm{P2 - }\lambda _{ci}^{St_1^{recon} + St_3^{recon}}$ is obtained by linear superposition of
 $\textrm{P2 - }\lambda _{ci}^{St_1^{recon}}$and
 $\textrm{P2 - }\lambda _{ci}^{St_3^{recon}}$, whose variation is also shown by the green curve in figure 20(a). Amazing similarity can be found between
 $\textrm{P2 - }\lambda _{ci}^{St_1^{recon} + St_3^{recon}}$ and the lift where the variation of lift follows well with
 $\textrm{P2 - }\lambda _{ci}^{St_1^{recon} + St_3^{recon}}$ regardless of the phases of global or local minima, indicating a close in-phase relationship. Since the correlation level between
 ${\lambda _{ci}}$ and
 ${C^{\prime}_l}$ at P2 in figure 18(a) is higher, P1 is not selected here.
Relationship between signals at α = 12°. (a) Phase-averaged time histories of  ${C^{\prime}_l}$, L1-y′,
 $\textrm{P1 - }{\lambda _{ci}}$ and
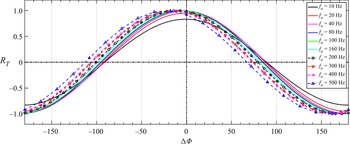
 $\textrm{P2 - }{\lambda _{ci}}$ in a membrane vibration cycle; (b) correlation coefficients with phase lags.

Based on figure 20(a), phase lead-lag properties of two signals can be derived from cross-correlation in figure 20(b). The maximum correlation coefficient between lift and drag fluctuations is 0.80 with a phase difference of ΔΦ = 0°, that is, the lift and drag are essentially in-phase. The maximum correlation coefficients of  ${C^{\prime}_l}$ versus
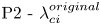 $\textrm{P2 - }\lambda _{ci}^{original}$ and
 ${C^{\prime}_l}$ versus
 $\textrm{P2 - }\lambda _{ci}^{St_1^{recon} + St_3^{recon}}$ are close, with phase differences of ΔΦ = 0° and −4°, respectively, indicating that they are all in-phase. The two correlation curves are similar, which proves the feasibility of using the linearly superposed swirl strength
 $\textrm{P2 - }\lambda _{ci}^{St_1^{recon} + St_3^{recon}}$. Compared with
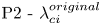 $\textrm{P2 - }\lambda _{ci}^{original}$, the linearly superposed
 $\textrm{P2 - }\lambda _{ci}^{St_1^{recon} + St_3^{recon}}$ can eliminate the influence of other irrelevant frequencies (such as the little correlation of
 ${C^{\prime}_l}$ versus
 $\textrm{P2 - }\lambda _{ci}^{St_2^{recon}}$ in figure 20b) on the lift, and can reflect the variation of lift more intuitively.
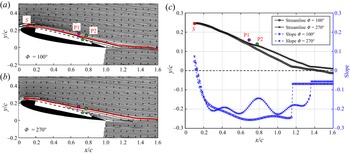
Here, the reason why the instantaneous swirl strength at P2 affects the lift is also explained. The flow fields at Φ = 100° and Φ = 270°, corresponding to figures 19(a) and 19(b), are respectively exhibited in figures 21(a) and 21(b) by streamlines. Referring to the research of Jones, Yao & Allan (Reference Jones, Yao and Allan2006) on circulation-control wings, the streamline deflection is related to lift-enhancement through the augmentation of the circulation around the wing. In this experiment, an upstream point S (x/c = 0.1, y/c = 0.245) with a normal height from the local airfoil surface of 0.15 mm is selected. From the point S, we release two streamlines in figures 21(a) and 21(b) simultaneously. The streamlines at the two phases are shown with red lines in the figures. They are further put together for comparison in figure 21(c). It can be found that at Φ = 270°, the streamline deflects upward at P2. It is because the instantaneous swirl strength of the vortex at P2 is the largest and the local streamline is lifted-up by the strong vortex. At the downstream of P2, the streamline at Φ = 270° is always higher than Φ = 100°. Additionally, the blue curves in figure 21(c) represent the slope variation of the two streamlines along the streamwise direction. The most obvious difference in the slope curves is still at point P2: at Φ = 270°, the absolute value of streamline slope decreases obviously, which also reflects the upward deflection of the streamline at P2. In the wake, the slopes of the two streamlines (linear fitted) at Φ = 100° and Φ = 270° remain unchanged and equal to −0.068 and −0.056, respectively. Consequently, at Φ = 270°, the upward deflection of the streamline reduces the clockwise circulation around the airfoil and further reduces the lift. At Φ = 100°, the more downward streamline deflection leads to the larger clockwise circulation around the airfoil and higher lift. The above conclusions can still be obtained by comparing other streamlines near the airfoil surface in figures 21(a) and 21(b). It should be noted that the explanation about figure 21 is based on quasi-steady assumption, in which the instantaneous lift is determined by the instantaneous circulation (Theodorsen Reference Theodorsen1935; Gao Reference Gao2012). The additional unsteady lift caused by virtual mass force is ignored because the vibration velocity of the membrane on the airfoil surface is one order of magnitude smaller than the free stream velocity. Therefore, through the analysis of the instantaneous streamline deflection, the influence of instantaneous swirl strength at P2 on the lift is reasonably explained.
(a) Flow field at Φ = 100° with the maximum lift; (b) flow field at Φ = 270° with the minimum lift; (c) comparison of selected streamlines and their slopes.

4.2.2. Coupling between membrane vibrations and flow fields
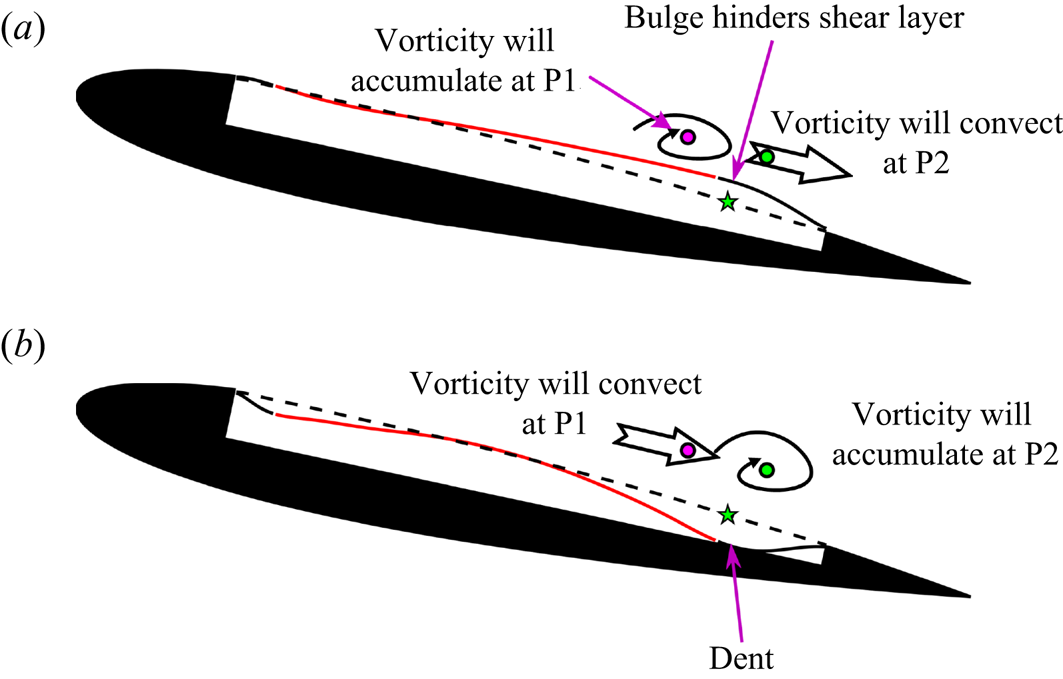
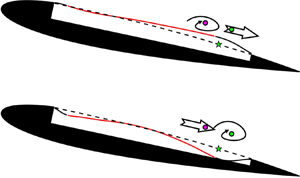
Subsequently, the membrane vibrations are considered to investigate the unsteady aerodynamics and fluid–structure coupling characteristics. For the unsteady membrane vibrations, the point L1 with maximum vibration amplitude is located closely between P1 and P2, so the variation of L1-y′ has a significant impact on the instantaneous swirl strength of P1 and P2. The phase difference between  ${C^{\prime}_l}$ and L1-y′ in figure 20(b) is ΔΦ = 56°. In other words, both the instantaneous lift fluctuation and the swirl strength at P2 lag behind the membrane vibration signal at L1. According to the time histories in figure 20(a), the maximum of L1-y′ is located at Φ = 50°. At this phase, a local bulge appears around L1 in the membrane, hindering the downstream development of the local shear layer. After some time, vorticity will accumulate around the upstream point P1 (absolute value of
 $\textrm{P1 - }\lambda _{ci}^{St_1^{recon} + St_3^{recon}}$ is the largest at Φ = 80°–100°), while the vorticity around the downstream point P2 will convect away (
 $\textrm{P2 - }\lambda _{ci}^{St_1^{recon} + St_3^{recon}}$ is 0 at Φ = 100°). In contrast, the minimum of L1-y′ is located at Φ = 200°. At this phase, a local dent appears around L1 in the membrane, no longer hindering the development of the shear layer. Therefore, the vorticity around P1 will gradually convect downstream (
 $\textrm{P1 - }\lambda _{ci}^{St_1^{recon} + St_3^{recon}}$ is 0 at Φ = 250°– 290°), while strong vorticity will accumulate around P2 (absolute value of
 $\textrm{P2 - }\lambda _{ci}^{St_1^{recon} + St_3^{recon}}$ is near the largest at Φ = 270°). To intuitively display the above events, figure 22 shows the coupling relationship between membrane vibrations and flow structures. The fluid–structure coupling events after the appearance of local membrane bulge at Φ = 50° (figure 22a) and dent at Φ = 200° (figure 22b) are described.
Sketch of fluid–structure coupling relationship at α = 12°. (a) Fluid–structure coupling events after the appearance of local membrane bulge at Φ = 50°; (b) fluid–structure coupling events after the appearance of local membrane dent at Φ = 200°. Phase-averaged membrane deformations with amplitudes amplified by a factor of five are appended for better display.

So far, a close in-phase relationship between instantaneous lift fluctuation and linearly superposed swirl strength of the vortex at the P2 point is found above. The coupling mechanism between membrane deformation and vortices is also expounded. The unsteady coupling process can be then described as follows. The periodic occurrences of the local membrane bulge and dent around the maximum vibration amplitude location affect the instantaneous swirl strength of flow structures. The local swirl strength further influences the deflection of the local streamlines. Finally, the variations of circulation around the airfoil and the instantaneous lift are determined.
5. Conclusions
In this study, the active control on the flexible leeward surface of an airfoil is realized by piezoelectric MFC actuators. The aerodynamics and fluid–structure interaction characteristics of the actively controlled airfoil are investigated by the time-resolved synchronous measurements. The experimental Reynolds number is Re = 6 × 10⁴. The main conclusions are as follows.
The best application environment of actively controlled airfoil is at 10° ≤ α ≤ 14°, where the rigid airfoil is in the post-stall state. By active control, lift-enhancement and drag-reduction can be simultaneously achieved at 10° ≤ α ≤ 14°. Comparing the actively controlled airfoil with the rigid airfoil, the maximum increment of lift-to-drag ratio is 126 % at α = 11°, and the maximum increment of lift is 27.1 % at α = 12°. The little aerodynamic difference between the flexible airfoil and the rigid airfoil indicates that the passive control method by simply changing the flexibility of the leeward surface can hardly improve the aerodynamic characteristics in this investigation.
At α = 12° when the maximum lift-enhancement is achieved, there are three characteristic frequencies for the actively controlled airfoil during the fluid–structure interaction:  $S{t_1} = 0.5{f^\textrm{ + }}$,
 $S{t_2} = {f^\textrm{ + }}$ and
 $S{t_3} = 1.5{f^\textrm{ + }}$, respectively. When
 ${f^ + } > 3$, the membrane vibrations and flow fields are locked into St 1, which is half of the actuation frequency. For the membrane vibrations, St 1 and St 2 are the dominant frequencies of the inclining mode and bending mode, respectively. The shift of the dominant vibration mode from bending to inclining is the reason for the novel half-frequency lock-in phenomenon. For the flow fields, St 1 and its harmonics (St 2, St 3) are coupled with the natural frequencies of the leading-edge shear layer. Flow structures with different scales and frequencies are generated near the most unstable positions, accompanied by the enhancement of momentum mixing in the leeward surface boundary layer. This is the mechanism of active control for suppressing flow separation at post-stall angles of attack.
The instantaneous lift presents comparable dominant frequencies between St 1 and St 3 at α = 12°. The flow structures of St 1 and St 3 have significant effects on the lift. The local membrane bulge and dent affect the instantaneous swirl strength of flow structures near the maximum vibration amplitude location, which is the main reason for the variation of instantaneous lift. The above results have guiding significance for the research of active control technology of a flexible wing, especially for the unsteady aerodynamics and fluid–structure interaction.
Additional research is required to deepen the understanding of the current active control technique. The current active control is a relatively simple open-loop control method. The deforming range includes 66.7 % of the entire airfoil leeward surface, so it is difficult to yield the regularity of the specific actuation position. Therefore, the follow-up research will focus on the closed-loop control method as well as changing actuation positions and frequencies, aiming to find out the optimal control design and propose a control strategy.
Acknowledgements
The authors thank the anonymous reviewers whose comments and suggestions greatly improved the quality and clarity of this manuscript.
Funding
The authors also acknowledge the financial support from the National Natural Science Foundation of China (Grant Nos. 12127802 and 11721202).
Declaration of interests
The authors report no conflict of interest.
Appendix A. Dynamic force calibration of the load cell
The six-component load cell itself exhibited a high natural frequency of 1400 Hz, which has the ability to measure dynamic forces. The dynamic forces at low frequency (<1 Hz) were already calibrated by Wang, Feng & Li (Reference Wang, Feng and Li2021), so the current study provides the dynamic force calibration at higher frequencies of O(101–102) Hz.
First, for the phase accuracy, according to Schlegel et al. (Reference Schlegel, Kieckenap, Glöckner, Bu and Kumme2012) and Zhang et al. (Reference Zhang, Wang, Yin, Schlegel and Kumme2018), the current dynamic force calibration was conducted using a sinusoidal calibration system in Changcheng Institute of Metrology & Measurement (CIMM). It was reported that the sinusoidal calibration at frequency from 20 Hz to 2000 Hz in CIMM was consistent with the similar system in Physikalisch-Technische Bundesanstalt (PTB) in Germany. The calibration system is shown in figure 23. The load cell to be calibrated was mounted on an electro-dynamic shaker, and a mass block was screwed on the tool side of the load cell. As a result, the x- and y-axes of the load cell were calibrated. The sinusoidal actuation was realized by the shaker with sinusoidal acceleration feedback control. The surface of the mass block was illuminated by a laser beam from a laser interferometer to measure the velocity and acceleration of the mass. Based on Newton's law, the dynamic force acting on the load cell is traceable to mass and acceleration by F(t) = mam(t), where m is the total mass acting on the sensing element of the load cell and am(t) is the time-dependent acceleration of the corresponding mass. The temperature was 15 °C and relative humidity was approximately 30 %. The actuation frequency (fa) was from 10 Hz to 500 Hz, covering the range of FSI characteristic frequencies in the current study (110 Hz, 220 Hz and 330 Hz). Each case was sampled at 10 kHz over 20 s.
Set-up of dynamic force calibration system.

Figure 24 displays the time histories of velocities and forces at the two frequencies fa = 100 Hz and 300 Hz. The measured velocity of the mass block from the laser interferometer is denoted as  $V_m^{measured}$. The measured dynamic force from the load cell is denoted as
 ${F^{measured}}$. Due to the purity of the frequency spectrum, the velocity signal
 $V_m^{measured}$ can be directly fitted by a sine wave with the goodness of fit (R 2) larger than 0.99. The fitted velocity is denoted as
 $V_m^{fit}$. Accordingly, the acceleration
 $a_m^{fit}$ can be obtained by derivation of
 $V_m^{fit}$ and the corresponding force is also calculated by
 ${F^{fit}}= ma_m^{fit}$. Finally,
 ${F^{fit}}$ and
 ${F^{measured}}$ are compared for dynamic calibration. For fa = 100 Hz, the amplitudes and phases of
 ${F^{fit}}$ and
 ${F^{measured}}$ agree well. For fa = 300 Hz, the phase of
 ${F^{fit}}$ slightly leads ahead of
 ${F^{measured}}$, while their amplitudes are still similar.
Time histories of velocities and forces: (a) fa = 100 Hz; (b) fa = 300 Hz.

Phase difference between  ${F^{fit}}$ and
 ${F^{measured}}$ at all of the calibrated frequencies are further presented in figure 25. It can be found that the phase difference tends to increase monotonically with the increase of actuation frequency. Specifically, ΔΦ are approximately −5°, −10° and −13° for fa = 100 Hz, 200 Hz and 300 Hz, respectively. Compared with the phase information during the unsteady coupling process in the manuscript (taking figure 20 for example), the phase lags of the load cell have little influence on the judgement on the phase relationship among aerodynamic forces, membrane vibrations and swirl strength of vortices.
Phase difference between  ${F^{fit}}$ and
 ${F^{measured}}$ at all calibrated frequencies.

Second, for the spectral characteristics, we have explored the resonance behaviour (Cl related PSD) of the current experimental set-up according to Bleischwitz (Reference Bleischwitz2016). As shown in figure 26, three cases are evaluated: without actuation case at wind-off, hammer test case at wind-off and actuation case of  $({f^ + },{V^ + }) = (3.52,1)$ at wind-on. The PSD amplitude of each spectrum is increased by 102 in turn. It can be found based on the hammer test that the eigen frequencies of the entire set-up of the actively controlled airfoil are approximately 10 Hz, 76 Hz and 156 Hz. For the actuation case, FSI characteristic frequencies (110 Hz, 220 Hz and 330 Hz) appear in the spectrum with high levels. Although the eigen frequencies remain, their PSD levels are quite low with respect to the FSI characteristic frequencies. Additionally, the eigen frequencies of the set-up are clearly isolated from the FSI characteristic frequencies. Hence, the eigen frequencies do not influence the FSI results significantly in the current study.
Resonance behaviour of the current experimental set-up based on Cl. Eigen frequencies of the set-up are shown by green shaded regions, which are isolated from the characteristic frequencies during FSI.

Appendix B. Evaluation of 2-D property of spanwise control
As shown in figure 27(a), the chordwise deformation at section A and the spanwise deformation at section B are measured in the current study. Section A is the same cross-section as PIV measurement (shown in figure 1), while section B is the spanwise cross-section passing through the location with the maximum vibration amplitude of membrane. Accordingly, the chordwise and spanwise vibration amplitudes ystd with  $({f^ + },{V^ + }) = (3.52,1)$ are plotted in figures 27(b) and 27(c), respectively. It is seen in figure 27(b) that the chordwise vibration amplitudes have two obvious peaks (x/c ≈ 0.24 and 0.74) near the leading- and trailing-edges of the active controller. The maximum vibration amplitude is located at x/c ≈ 0.74, which is denoted as L1 in figure 27. Meanwhile, it can be discovered from figure 27(c) that the non-dimensional spanwise vibration amplitudes maintain around 4 × 10⁻³, indicating the quasi-2-D property of the active controller along the spanwise direction.
Membrane vibration amplitudes of the actively controlled airfoil at α = 12°. (a) Diagram of measurement sections; (b) chordwise vibration amplitudes; (c) spanwise vibration amplitudes. The black and red curves indicate the parts of pure membrane and active controller, respectively.