Introduction
Body size correlates with physiological, behavioral, and population-level traits that influence survival prospects over time (Peters Reference Peters1983; Schmidt-Nielsen Reference Schmidt-Nielsen1984; Calder Reference Calder1984; Brown Reference Brown1995), making it an ideal variable for examining controls on macroevolution across geological time. Despite longstanding interest in the topic (e.g., Newell Reference Newell1949; Nicol Reference Nicol1966; Stanley Reference Stanley1973a; Jablonski Reference Jablonski1996, Reference Jablonski1997; Trammer and Kaim Reference Trammer and Kaim1997; Alroy Reference Alroy1998; Dommergues et al. Reference Dommergues, Montuire and Neige2002; Trammer Reference Trammer2005; Twitchett Reference Twitchett2007; Bell and Braddy Reference Bell and Braddy2012), however, the pattern of body-size change remains incompletely documented. Whereas synoptic data on the stratigraphic ranges of marine animal genera are nearly two decades old (Sepkoski Reference Sepkoski1996, Reference Sepkoski2002), there exists no comparable data set regarding the body sizes of marine animals even for a single class or phylum. The largest published data sets comprise only a few hundred genera each of bivalves, brachiopods, and gastropods (Payne Reference Payne2005; Novack-Gottshall Reference Novack-Gottshall2006; Novack-Gottshall and Lanier Reference Novack-Gottshall and Lanier2008; Kosnik et al. Reference Kosnik, Alroy, Behrensmeyer, Fürsich, Gastaldo, Kidwell, Kowalewski, Plotnick, Rogers and Wagner2011) and only one of these studies (Kosnik et al. Reference Kosnik, Alroy, Behrensmeyer, Fürsich, Gastaldo, Kidwell, Kowalewski, Plotnick, Rogers and Wagner2011) spans the Phanerozoic. Consequently, it remains unclear whether documented examples of size increase over tens to hundreds of millions of years (e.g., Newell Reference Newell1949; Hunt and Roy Reference Hunt and Roy2006; Novack-Gottshall Reference Novack-Gottshall2006; Novack-Gottshall and Lanier Reference Novack-Gottshall and Lanier2008; Hunt et al. Reference Hunt, Brown and Macleod2010) and decrease across mass extinction events (e.g., Arnold et al. Reference Arnold, Kelley and Parker1995; Smith and Jefferey Reference Smith and Jeffery1998; Fraiser and Bottjer Reference Fraiser and Bottjer2004; Payne Reference Payne2005; Twitchett and Oji Reference Twitchett and Oji2005) reflect general rules or, alternatively, a bias toward publication of the most readily recognizable patterns.
Brachiopods present an ideal test case for examining Phanerozoic trends in organism size. They are diverse and abundant in the fossil record and their systematics have been studied in depth for more than a century. Their predominantly calcite shells make them comparatively resistant to diagenetic loss from the fossil record (Cherns and Wright Reference Cherns and Wright2000, Reference Cherns and Wright2009; Wright et al. Reference Wright, Cherns and Hodges2003). Moreover, studies of representative brachiopod genera suggest an early Paleozoic interval of substantial body-size increase (Stanley Reference Stanley1973a; Novack-Gottshall Reference Novack-Gottshall2006; Novack-Gottshall and Lanier Reference Novack-Gottshall and Lanier2008; Kosnik et al. Reference Kosnik, Alroy, Behrensmeyer, Fürsich, Gastaldo, Kidwell, Kowalewski, Plotnick, Rogers and Wagner2011), perhaps as part of an ecosystem-wide trend (Novack-Gottshall Reference Novack-Gottshall2006). However, the largest brachiopods, such as the Carboniferous giant Gigantoproductus giganteus, lived during Paleozoic time (Payne et al. Reference Payne, Boyer, Brown, Finnegan, Kowalewski, Krause, Lyons, McClain, McShea, Novack-Gottshall, Smith, Stempien and Wang2009) and visual inspection of the representative data compiled by Kosnik et al. (Reference Kosnik, Alroy, Behrensmeyer, Fürsich, Gastaldo, Kidwell, Kowalewski, Plotnick, Rogers and Wagner2011: Fig. 5D) suggests that size increase did not persist to the present day. The cause, timing, and even the existence of this possible shift in the trend of brachiopod size have yet to be tested quantitatively.
In this study, we present a synoptic, genus-level size database for the phylum Brachiopoda and use it to test whether the mean size across all brachiopod genera increased during the Paleozoic, whether this size increase is distinguishable from a random walk, and whether the statistical mode of size change differs between Paleozoic and post-Paleozoic time. The revised edition of the Treatise on Invertebrate Paleontology (Williams et al. Reference Williams, Brunton and Carlson1997, Reference Williams, Brunton and Carlson2000a,Reference Williams, Brunton and Carlsonb,Reference Williams, Brunton and Carlsonc, Reference Williams, Brunton and Carlson2006, Reference Williams, Brunton and Carlson2007) illustrates representative specimens for more than 3400 brachiopod genera and provides stage-resolved stratigraphic range information for most of these genera. Brachiopods are also well represented in the Paleobiology Database (www.paleobiodb.org; PaleoDB), enabling a sensitivity test of the pattern of size change implied by stratigraphic range information in the Treatise versus the PaleoDB.
Data and Methods
Body-size Data
We collected size data from the revised brachiopod volumes of the Treatise on Invertebrate Paleontology (Williams et al. Reference Williams, Brunton and Carlson1997, Reference Williams, Brunton and Carlson2000a,Reference Williams, Brunton and Carlsonb,Reference Williams, Brunton and Carlsonc, Reference Williams, Brunton and Carlson2006, Reference Williams, Brunton and Carlson2007), which contains scaled photographs illustrating 4802 brachiopod species across 3414 genera. Of these, 3377 genera were reported with stage-resolved stratigraphic ranges. We measured holotype specimens when they were available. If there was no illustration of a holotype specimen for a given species, we moved to a paratype, neotype, or best-resolution illustration, in that order. Barring significant differences in the quality of image for the ventral and dorsal shell, we measured the ventral shell. If neither the ventral nor the dorsal shell was depicted or both were depicted at low resolution, we measured other available illustrations, such as the posterior and lateral profiles of the dorsal or ventral shells. In total, we measured non-dorsal or non-ventral profiles for 1.7% of the specimens. We made all measurements using digital calipers with resolution to the nearest tenth of a millimeter (prior to correction for image magnification).
Stratigraphic Range Data
We collected stratigraphic range data from two sources: (1) the Treatise and (2) the PaleoDB (accessed 1 August 2011). To reflect the time scheme for stage assignments used in both sources, we correlated brachiopod occurrences to the stages listed in the Gradstein et al. (Reference Gradstein, Ogg and van Kranendonk2008) geologic timescale. Resolution for the Cambrian stages was enhanced by using Russian stage boundaries from the GeoWhen Database (http://www.stratigraphy.org/bak/geowhen/index.html). For ranges from the Treatise, the Hirnantian stage was merged with the Llandovery stage because according to the Treatise, no genera originated during Hirnantian time, and only one genus went extinct within that stage.
Data Treatment
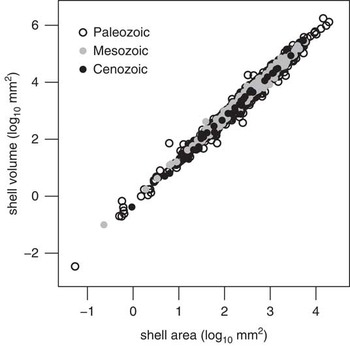
For all analyses, we used log-transformed shell area (i.e., the product of width and length) as a measure of body size. For 3068 genera with stage-resolved stratigraphic ranges, only one specimen was illustrated such that area could be determined and so the size of this specimen was used to represent the genus. For 309 genera (9.1%), more than one species was illustrated (up to a maximum of five species). In these cases, we took the mean of the log-transformed shell area across illustrated species as the representative size for the genus. We did not use shell volume because nearly half of all brachiopod genera were not illustrated in a view illustrating specimen height. However, the use of shell area rather than shell volume is unlikely to influence our results because variation in log-transformed area explains 98% of the variation in log-transformed volume (ordinary least-squares linear regression: slope=1.50±0.008, intercept=−0.21±0.02, adjusted R 2=0.98, p<2×10⁻¹⁶) for specimens of known volume in our data set and the form of this relationship does not change meaningfully across geological time (Fig. 1). This finding is consistent with previous studies showing that shell length or area typically captures most of the variation in volume within and among higher taxa (Novack-Gottshall Reference Novack-Gottshall2008). Moreover, the volume of type specimens and specimens illustrated in monographs generally correlate with the median size of a typical adult individual of the species for marine invertebrate fossils, including brachiopods (Kosnik et al. Reference Kosnik, Jablonski, Lockwood and Novack-Gottshall2006; Krause et al. Reference Krause, Stempien, Kowalewski and Miller2007). Thus, although there is often a positive bias in the sizes of illustrated specimens and type specimens relative to specimens from bulk collections, representative specimens should still be sufficient to capture trends in the distribution of sizes across species and genera. In addition, the existence of these biases does not necessarily affect the interpretation of the trend in the mean. Such biases would only affect analyses of trends in mean size if the nature of the bias varied substantially and systematically as a function of geological time. We are not aware of any evidence that the size bias in the illustration of specimens or the selection of representative species for the Treatise does in fact vary systematically with respect to the stratigraphic ranges of brachiopod genera. Data used in analyses are archived within the Stanford Digital Repository (http://purl.stanford.edu/sw967vm0154) as Supplementary Tables 1 and 2.
Scatter plot of brachiopod shell volume versus shell surface area, illustrating the strong linear correlation between area and volume in logarithmic space. The tight correlation between these measures of size demonstrates that shell area is a reliable proxy for shell volume. Variation in log-transformed area explains 98% of the variation in log-transformed volume (slope=1.50 (SE=0.008), intercept=−0.21 (SE=0.02), adjusted R 2=0.98, p=<2×10⁻¹⁶).

Analysis of Evolutionary Mode
We used the “joint” parameterization of the “paleoTS” package (v. 0.4-1; Hunt Reference Hunt2011) in R (v. 2.13.1; R Development Core Team 2011) to examine support across three statistical models of body-size change: unbiased random walk, directional trend, and stasis. An unbiased random walk is the null mode in the absence of any selective pressure on body size (McShea Reference McShea1994). A directional trend is the expected mode when selective pressures favor size increase or decrease to a constant extent over time, whether due to species sorting or within-lineage trends. Stasis is expected when size is optimized to invariant biological, ecological, and environmental factors (Kingsolver and Pfennig Reference Kingsolver and Pfennig2004). We compared support across these three models using the small-sample corrected version of Akaike’s information criterion (AICc) and the associated Akaike model weight (Akaike Reference Akaike1974; Hunt Reference Hunt2006).
Based on visual evidence for an increasing trend in size that ended late in Paleozoic time, we examined statistical support for a case in which the evolutionary mode was allowed to shift at some point during the Phanerozoic, either from one mode to another or from one set of parameter values to another within a given mode. The optimal breakpoint in the Phanerozoic for the two-phase model was identified by comparing the AICc value of aggregate models for every possible breakpoint. The best evolutionary mode for each subset was identified using the AICc. We required each interval within a given mode to be at least six geologic stages long in order to constitute a true, long-term evolutionary mode.
Analysis of Size Selectivity in Extinction and Origination
To test for size bias in the extinction and origination processes, within each stage we compared the mean shell area of originating genera with that of genera surviving from the previous stage, and the mean of extinction victims with the mean of genera surviving into the subsequent stage using two-tailed, two-sample t-tests assuming unequal variances. We also calculated the effects of extinction and origination on the overall size distribution following the methodology of Rego et al. (Reference Rego, Wang, Altiner and Payne2012). This approach accounts for the fact that the effect of extinction and origination on the overall size distribution depends both on the differences in mean values between victims and survivors (or between originators and survivors from the previous stage) and on the number of genera in each category. For example, extinction may be strongly size biased but have only a small effect on the overall mean size if extinction intensity is low.
Results
Pattern of Body-size Evolution
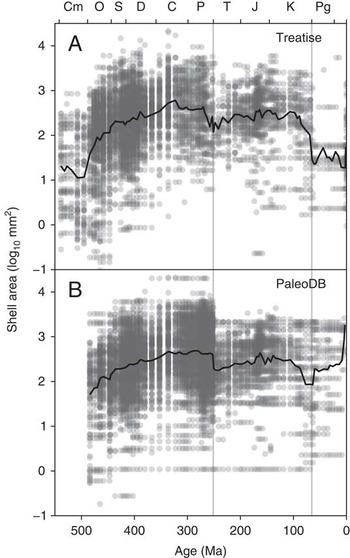
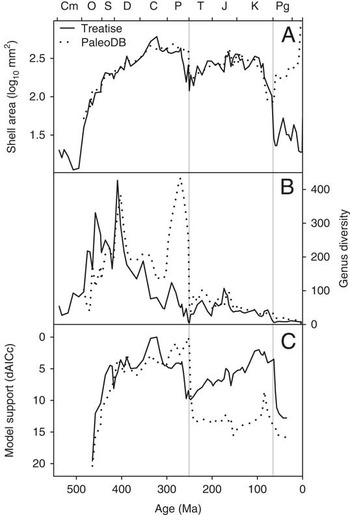
Figure 2 illustrates the sizes of all brachiopod genera and stage-level mean values across the Phanerozoic using stratigraphic range constraints from the Treatise (Fig. 2A) and the PaleoDB (Fig. 2B). The two treatments agree closely in trend and absolute value across Paleozoic and Mesozoic time (Pearson’s r=0.89, p<0.0001), despite dissimilar diversity trends during the late Paleozoic (Fig. 3). Mean body size increased steadily from the Late Cambrian to the Early Carboniferous (Mississippian) before stabilizing during the Late Carboniferous (Pennsylvanian) and Permian. This trend toward larger size persists across large increases and decreases in total genus diversity. Both data sets show decreases in mean and maximum size across the Permian–Triassic transition, although the decrease appears gradual during Late Permian time when using stratigraphic ranges from the Treatise versus abrupt when using ranges from the PaleoDB (Fig. 3A). Both data sets show an increase in mean size from the Early Triassic to the Middle Jurassic. The Treatise data indicate a decrease in mean size across the Cretaceous–Paleogene transition and stable small body sizes during the Cenozoic. The PaleoDB data suggest, instead, a slight size decrease during the Late Cretaceous followed by a return to typical Mesozoic sizes during Cenozoic time. The small number of genera present within Cenozoic stages (<25 in the PaleoDB and <10 in the Treatise) and the limited reporting of Cenozoic brachiopod occurrences from Cenozoic strata make it difficult to interpret the differing trajectories of mean size between the Treatise and PaleoDB data treatments over the past 66 Myr but suggest that they result from effects related to small sample size.
Plot of brachiopod body sizes across the Phanerozoic illustrating the range of sizes as well as trends in the mean. A, Shell area applied to stratigraphic ranges from the Treatise. B, Shell area applied to stratigraphic ranges from the PaleoDB. Each dot represents the size of a genus within a geological stage. The black lines illustrate the trend in the mean for each data treatment.

Histories of stage-level mean body size (A) and sampled biodiversity throughout the Phanerozoic (B). C, Plot of relative AICc values generated from the breakpoint analysis quantify the fit of all two-phase models based on the location of the breakpoint. For each analysis, the model with the minimum AICc value (i.e., the best-supported model) was set to zero and all other breakpoints are presented in terms of relative support, where larger positive numbers indicate weaker model fit. The best-supported breakpoint for the Treatise data is in the Serpukhovian (Mississippian) and in the Changhsingian for the PaleoDB data.

Analysis of Evolutionary Mode
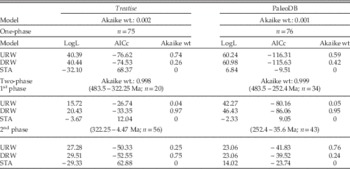
In the analysis assuming a single mode of body-size variation across the entire Phanerozoic, unbiased random walk modestly outperforms the directional trend model when stratigraphic ranges from either the PaleoDB or the Treatise are used (Table 1). Neither data set provides meaningful statistical support for stasis (Table 1).
Comparison of model support between best one- and two-phase treatments and among unbiased random walk (URW), directional random walk (DRW), and stasis (STA) for each phase.

In the analysis allowing for two intervals with potentially different modes, the optimal breakpoint occurs in the terminal Mississippian (Serpukhovian stage) for stratigraphic ranges determined from the Treatise, and in the terminal Permian (Changhsingian stage) for stratigraphic ranges determined from the PaleoDB. Using ranges from the Treatise, both pre- and post-Serpukhovian body-size change are best described by directional trends. Directionality is positive throughout the Paleozoic (μstep=0.0069; σ2step=0.0004;), and negative thereafter (μstep=−0.0043; σ2step=0.0011). Using ranges from the PaleoDB, pre-Changhsingian body-size evolution is best described by a directional trend (μstep=0.0035; σ2step=0.0002), whereas post-Changhsingian body-size evolution is best described by an unbiased random walk (σ2step=0.0013). The two-phase model is overwhelmingly supported relative to the one-phase model in in both data treatments (Table 1). In aggregate, there is clear evidence for a driven trend toward larger body size in brachiopods during most of Paleozoic time but substantial uncertainty in the dynamics thereafter, due to both greater differences between data treatments and smaller evidence ratios among models within data treatments (Table 1).
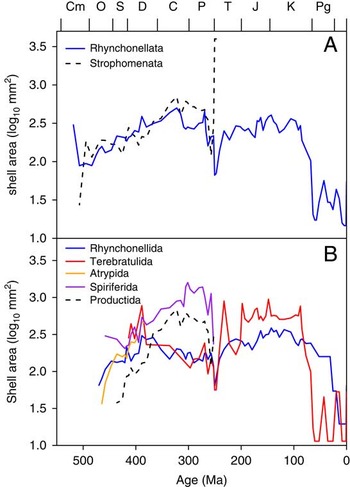
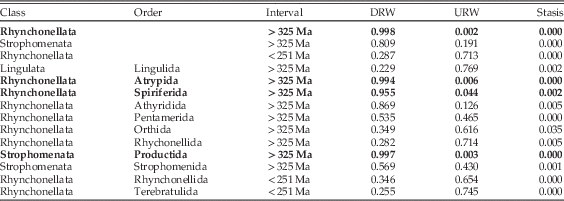
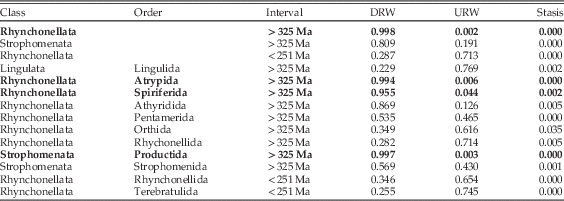
Analysis of evolutionary mode by class and order using the more complete set of stratigraphic ranges from the Treatise suggests that the shift in evolutionary mode between the Paleozoic, especially the early Paleozoic, and the post-Paleozoic results from a change in evolutionary mode within Class Rhynchonellata due to a shift in the identities of the most diverse constituent orders. Classes Strophomenata and Rhynchonellata exhibit similar mean sizes and trajectories in mean size across Paleozoic time (Fig. 4A). A driven trend toward larger size is strongly favored in Class Strophomenata (AICc weight=0.998) and modestly favored in Class Rhynchonellata (AICc weight=0.809) for the interval prior to the overall transition in evolutionary mode across the entire data set ca. 325 Mya (Table 2). In contrast, an unbiased random walk is modestly favored for Rhynchonellata in post-Paleozoic time (AICc weight=0.713) and Strophomenata became extinct. At the order level, two rhynchonellate orders (Atrypida and Spiriferida) and one strophomenate order (Productida) receive strong support for a driven trend toward larger size and all of the orders for which the driven trend is the best-supported model exhibit increasing trends (Table 2, Fig. 4B). No order exhibits strong support for any other model of size change. The one order that is sufficiently abundant for analysis both during the early Paleozoic and during the post-Paleozoic, Rhychonellida, receives modest support for an unbiased random walk during both intervals (Table 2); and the other abundant and diverse post-Paleozoic order, Terebratulida, also receives modest support for an unbiased random walk (Table 2). The differences in size trajectories are apparent when comparing mean values between the Paleozoic orders for which a driven trend is favored and the rhynchonellids and terebratulids, for which an unbiased random walk is better supported (Fig. 4B). Because the unbiased random walk is a special case of the driven trend model, in which the mean step size is exactly zero, it is impossible for the unbiased random walk to receive more than 0.75 AICc weight (Hunt Reference Hunt2006). Consequently, the support for the unbiased random walk in these cases is nearly as high as is possible given the nature of the model comparison, indicating that nearly all support is for a random walk with a mean step size indistinguishable from zero.
Line graph illustrating close similarity of mean size and trends in mean size for brachiopod classes and orders. A, Classes. A driven trend is the favored model for the interval prior to 325 Ma in both classes, whereas a random walk is the best-supported model for Rhynchonellata during post-Paleozoic time (Table 2). B, Trends in mean size for representative orders (full results presented in Table 2). An unbiased random walk is favored for the two most diverse post-Paleozoic orders (Terebratulida and Rhynchonellida) during post-Paleozoic time and for Rhynchonellida during Paleozoic time. In contrast, three Paleozoic orders (Spiriferida, Atrypida, and Productida) exhibit strong driven trends toward larger size during Paleozoic time. The differing trajectories between the former and latter groups, even during Paleozoic time, suggest that the overall transition in body-size trend may result from clade replacement rather than a change in pattern within any order.

Comparison of model support among unbiased random walk (URW), directional random walk (DRW) and stasis (STA) for brachiopod classes and orders during the early Paleozoic (>325 Ma) and the post-Paleozoic (<251 Ma), illustrating that the only model that receives strong support (AICc weight >0.90) is the directional random walk during the Paleozoic.
Effects of Extinction and Origination on Size Evolution
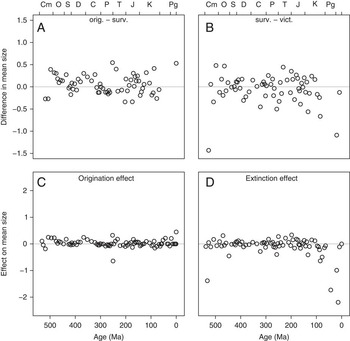
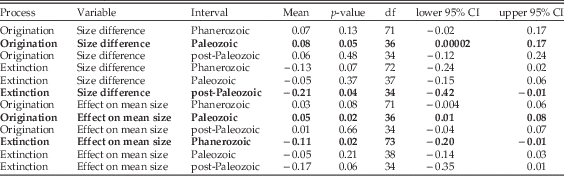
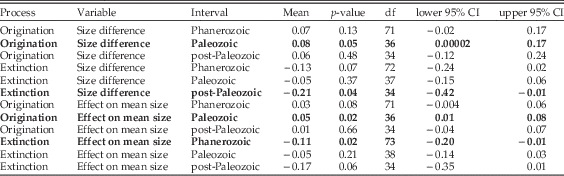
Changes in the distribution of brachiopod sizes across stages in our data set are necessarily caused by the differential effects of extinction and origination. Figure 5 illustrates the differences in mean body size between newly originating genera and those that survived into the stage from the previous stage (Fig. 5A) and the differences in mean body size between extinction victims and survivors for each stage (Fig. 5B), using the more complete stratigraphic range information from the Treatise. The direction of the size difference varies from stage to stage for both origination and extinction (Fig. 5), and two-sample t-tests indicate that few of these differences are statistically distinguishable from zero (Supplementary Tables 3, 4). Similarly, the effects of origination and extinction on the size distribution (integrating effects from the differences in mean size with the number of originators versus survivors from the previous stage and with the number of extinction victims versus the number of survivors to the subsequent stage) are variable in direction from stage to stage (Fig. 5C,D). A t-test of the distribution of size differences between originators and survivors shows that there is a significant bias toward the preferential origination of larger genera during the Paleozoic (Table 3), which appears to be the primary control on the overall increase in mean size across this era. In contrast, there is no significant overall bias in the size difference between extinction victims versus survivors (Table 3). The origination effect is also significantly different from zero (Table 3). There is also a significant bias toward size decrease from the extinction effect in the post-Paleozoic but no significant bias in the extinction effect during the Paleozoic (Table 3). Thus, Paleozoic size increase in brachiopods occurred more through size bias in origination than in extinction.
Scatter plots of the difference in mean body size between newly originating genera and those that survived into the stage from the previous stage (A), and between extinction victims and survivors into the next stage (B) for stages in which there were at least five victim and survivor genera. Positive values indicate that originating genera (or victims) were larger than survivors. Analysis is based upon the more comprehensive Treatise data set. Panels C and D are scatter plots illustrating the change in mean size attributable to origination (C) and extinction (D) across each stage boundary. The bias toward origination of larger genera and the significantly positive effect of origination on overall mean size during Paleozoic time are confirmed by t-tests (Table 3).

Comparison of model support among unbiased random walk (URW), directional random walk (DRW) and stasis (STA) for brachiopod classes and orders during the early Paleozoic (>325 Ma) and the post-Paleozoic (<251 Ma), illustrating that the only model that receives strong support (AICc weight >0.90) is the directional random walk during the Paleozoic. For origination the size difference is calculated as originators minus survivors and for extinction as survivors minus victims.
Discussion
Synoptic data on brachiopod body sizes indicate that this phylum experienced two distinct phases of body-size change: a Paleozoic trend toward larger size followed by a post-Paleozoic interval that cannot be clearly distinguished from an unbiased random walk. The evidence for a driven trend toward larger size during Paleozoic time corroborates findings from previous studies of more limited scope. Novack-Gottshall and Lanier (Reference Novack-Gottshall and Lanier2008; see also Novack-Gottshall Reference Novack-Gottshall2008) found evidence for a driven trend toward larger size from the Cambrian through the Devonian in a data set of 369 genera known from deep-subtidal, soft-bottom fossil assemblages. Kosnik et al. (Reference Kosnik, Alroy, Behrensmeyer, Fürsich, Gastaldo, Kidwell, Kowalewski, Plotnick, Rogers and Wagner2011) used a data set of the 328 most commonly occurring genera in the Paleobiology Database and found that the Phanerozoic pattern of size evolution was best characterized by an unbiased random walk, but that there was support for a driven trend toward larger size in the early Paleozoic component of their data set. The consistency between these previous findings and our synoptic results demonstrates that the Paleozoic trend toward larger size is not confined to the most common or abundant ~10% of genera; rather, it characterizes the evolution of the entire phylum.
The difference in the timing of the shift in mode of size change implied by the Treatise versus PaleoDB stratigraphic ranges reflects emerging data from south China that most dramatically affect the stratigraphic ranges of Permian genera as well as a distinct Carboniferous peak in mean size in the Treatise data that is not expressed in the PaleoDB treatment (Figs. 2, 3). Many genera that have last occurrences in the Middle Permian rock record of North America have recently documented Upper Permian occurrences in south China (Clapham et al. Reference Clapham, Shen and Bottjer2009), which have recently been incorporated into the PaleoDB but were likely not available to be incorporated into the Treatise at its time of publication. These occurrences have prompted a substantial downward revision in the magnitude of the end-Guadalupian (latest Middle Permian) mass extinction (Clapham et al. Reference Clapham, Shen and Bottjer2009) and, based on the results presented here, appear also to impact the apparent dynamics of body-size evolution. Based on the general agreement between the Treatise and PaleoDB records and the identifiable cause for the latest Paleozoic discrepancy, we ascribe more weight to the results from the PaleoDB regarding the precise timing of the shift in evolutionary mode.
The coincidence of the shift in mode for brachiopod body size with the end-Permian mass extinction adds to an already voluminous body of evidence testifying to the lasting effects of this biotic catastrophe on macroevolutionary dynamics. Response to the end-Permian extinction is the most important feature distinguishing the Paleozoic versus Modern faunas in Sepkoski’s (Reference Sepkoski1981) factor analysis of diversity dynamics in the fossil record. At the same time, the abundance distributions of marine animal communities changed in ways that suggest an increase in ecological complexity (Wagner et al. Reference Wagner, Kosnik and Lidgard2006). The terminal Permian event was also an important event in the rise of bivalves as the most diverse, abundant, and ecologically important benthic suspension feeders in the oceans (Gould and Calloway Reference Gould and Calloway1980; Fraiser and Bottjer Reference Fraiser and Bottjer2007; Payne et al. Reference Payne, Heim, Knope and McClain2014) within a longer-term trend from brachiopod to bivalve dominance at the community level (Sepkoski and Miller Reference Sepkoski and Miller1985; Kidwell and Brenchley Reference Kidwell and Brenchley1994; Clapham and Bottjer Reference Clapham and Bottjer2007). Foraminifera also exhibit a shift in the dynamics of size evolution across the Permian–Triassic transition, from environmental control to stasis (Payne et al. Reference Payne, Groves, Jost, Nguyen, Moffitt, Hill and Skotheim2012), suggesting that the effects of the Permian extinction on body-size evolution may have been as pervasive as those on the taxonomic and ecological structure of marine communities. As with brachiopods, the post-Paleozoic shift in foraminiferan body-size dynamics reflects a shift in the dominant orders rather than a change in mode within any order (Payne et al. Reference Payne, Groves, Jost, Nguyen, Moffitt, Hill and Skotheim2012).
In contrast to the end-Permian shift in the mode of body-size change, the causes of the Paleozoic trend toward larger body size remain difficult to pinpoint. The coincidence of size increase across several phyla and classes during the early Paleozoic (Novack-Gottshall Reference Novack-Gottshall2008) suggests that size increase was controlled by factors affecting the entire biosphere, rather than processes influencing brachiopods alone. Molybdenum isotope evidence indicates a gradual increase in oxygen availability in Paleozoic seawater, which could potentially explain ecosystem-wide increases in animal size through progressive removal of oxygen limitation on respiration and growth (Dahl et al. Reference Dahl, Hammarlund, Anbar, Bond, Gill, Gordon, Knoll, Nielsen, Schovsbo and Canfield2010). Alternatively, increases in the quantity and nutritional quality of primary production could account for the trend if food resources were limited during early Paleozoic time (e.g., Vermeij Reference Vermeij1995, Reference Vermeij2004; Martin Reference Martin1996; Bambach Reference Bambach1999; Martin and Quigg Reference Martin and Quigg2012). A further possibility is that the advent of predation not only enabled the diversification of macroscopic marine animals (Stanley Reference Stanley1973b; Marshall Reference Marshall2006; Sperling et al. Reference Sperling, Frieder, Raman, Girguis, Levin and Knoll2013), but also promoted evolution toward larger size as a refuge from predation pressure. Because these factors are not mutually exclusive, determining their relative contributions to the observed trend in size will require improved quantification of both the redox history of seawater and the structural evolution of marine ecosystems.
Conclusions
Brachiopod body-size evolution has been characterized by two distinct phases: an interval of size increase spanning the Paleozoic, and an interval indistinguishable from a random walk characterizing the post-Paleozoic. Synoptic data thus confirm previous findings of a driven trend toward larger size during Paleozoic time from data sets of more limited temporal and taxonomic coverage (e.g., Novack-Gottshall Reference Novack-Gottshall2006; Novack-Gottshall and Lanier Reference Novack-Gottshall and Lanier2008; Kosnik et al. Reference Kosnik, Alroy, Behrensmeyer, Fürsich, Gastaldo, Kidwell, Kowalewski, Plotnick, Rogers and Wagner2011). The coincidence of the shift in dynamics with the end-Permian mass extinction adds yet another line of evidence for the rapid and permanent effects of this biotic crisis on the long-term evolution of the marine biosphere (Sepkoski Reference Sepkoski1981; Erwin Reference Erwin1993; Wagner et al. Reference Wagner, Kosnik and Lidgard2006; Payne and Clapham Reference Payne and Clapham2012; Payne et al. Reference Payne, Groves, Jost, Nguyen, Moffitt, Hill and Skotheim2012). Although the cause of the 200-Myr-long trend toward larger size in Paleozoic brachiopods remains difficult to fingerprint, these data greatly strengthen the evidence for a global trend toward larger body sizes across the first half of animal life.
Acknowledgments
We thank K. Mathur, N. O’Keefe, and S. Sanghvi for assistance in data collection and the contributors to the Paleobiology Database for compiling information on brachiopod occurrences. J. Payne was supported by a CAREER grant from the U.S. National Science Foundation (EAR-1151022). Z. Zhang was supported by grants from the Stanford University Vice Provost for Undergraduate Education. M. Augustin was supported by the SURGE Program at Stanford University. This is Paleobiology Database publication 224.
Supplementary material
Supplemental materials archived at Stanford Digital Repository: http://purl.stanford.edu/sw967vm0154