1. Introduction
Trust plays an essential role in financial decision-making. Prior research finds that trust is an important predictor of stock ownership, and conditional on participating in the stock market, is positively correlated with the amount held in equities (Guiso et al., Reference Guiso, Sapienza and Zingales2008; El-Attar and Poschke, Reference El-Attar and Poschke2011). Trust also influences retirement savings behavior – individuals with low trust in financial institutions are more likely to opt-out of automatic enrollment in their defined contribution (DC) plan than their counterparts with higher levels of trust (Agnew et al., Reference Agnew, Szykman, Utkus and Young2012).
Investing in the stock market, and engaging with financial products and services more broadly, requires a great deal of confidence that the financial sector is fair. Investment options include an increasingly diverse array of complex financial instruments, and the typical investor does not have the knowledge and capacity to evaluate many of these offerings (Hilgert, et al., Reference Hilgert, Hogarth and Beverly2003; Agnew and Szykman, Reference Agnew and Szykman2005; Lusardi and Mitchell, Reference Lusardi and Mitchell2007, Reference Lusardi, Mitchell, Lusardi and Mitchell2011). A professional financial advisor (particularly one with a fiduciary responsibility) can provide better insight into investment options and help households plan for long-term goals, such as retirement. However, usage of professional financial advice in the United States is relatively low. In a survey of American households, Hung et al. (Reference Hung, Clancy, Dominitz, Talley and Berrebi2008) find that only 34% of respondents had received advising, management, or planning services from a financial professional. Similarly, responses to the 2007 Retirement Confidence Survey indicate only half of interviewees would obtain advice from retirement plan managers (Lusardi Reference Lusardi2008). And even when investors receive financial advice, they may not necessary follow it: Two-thirds of respondents in the 2007 Retirement Confidence Survey said they would only follow the advice if it were in line with their own ideas, and one-tenth said they would not follow it at all. Despite the fact that investors often express the desire for more advice, it is unclear how and under what conditions they implement the advice they are given (Helman et al., Reference Helman, VanDerhei and Copeland2007).
A variety of factors may influence why investors do not consult with a financial advisor, or follow the advice that they receive. Prior work has found that financial literacy influences advice seeking, though the direction of the association is not always clear (Hung and Yoong, Reference Hung, Yoong, Mitchell and Smetters2013; Calcagno and Monticone, Reference Calcagno and Monticone2015). A TIAA-CREF (2013) survey in 2013 finds that 40% of respondents think financial advice is too expensive and one third of respondents report that they don't have time to meet with an advisor.Footnote 1 Trust may be a particularly important driver in advice seeking and usage. In the same TIAA-CREF survey, almost half (48%) of respondents indicate that they do not know which sources of financial advice to trust.
In this paper, we draw from the RAND American Life Panel (ALP) to examine how trust in the financial system is related to behaviors, attitudes, knowledge and preferences related to utilizing professional financial advice. Using survey data, we find that financial trust measures an underlying construct separate from other individual characteristics that affect financial behavior, namely financial literacy and risk tolerance. Financial trust is correlated with advice usage and likelihood of seeking advisory services, but we cannot establish causality with the survey data. We also use data from a hypothetical portfolio allocation experiment in which subjects are randomized into different conditions with varying levels of access to (and provision of) financial advice. We find that trust is an important predictor of advice take-up, even after controlling for demographic characteristics and financial literacy, and that individuals who choose to receive advice perform significantly better in the allocation task than individuals who forgo receiving advice. Despite this, we find that the form of advice provision is important – providing unsolicited advice has little impact on behavior, even for individuals with high levels of trust.
2. Survey and experimental design
The data for our analysis come from the RAND ALP. The ALP is a nationally representative Internet panel of over 5,000 respondents aged 18 and above. Respondents in the panel either use their own computer to log on to the Internet or a Web TV, which allows them to access the Internet using their television and a telephone line. The technology allows respondents who did not have previous Internet access to participate in the panel.
Upon joining, respondents to the ALP complete a separate survey about individual demographic, work history and other household information, which they are prompted to update each time they log in to a new module. This provides a series of self-reported demographic characteristics of interest, including birthdate, gender, education, ethnicity, occupation, state of residence, and income. About once or twice a month, respondents receive an email with a request to visit the website and fill out questionnaires. Interviews typically take less than 30 min and respondents are paid an incentive of about $20 per 30 min of interviewing. For our analysis, we take advantage of the panel nature of the ALP and use data from three surveys.
2.1 MS189: financial trust, financial behaviors, and other individual-level characteristics
We take measures of financial trust and financial behaviors, as well as other individual characteristics such as risk preferences and financial literacy, from wave MS189 of the ALP, which was administered between June and August of 2011.
Our measure of trust is composed of five items: trust in the stock market, banks, insurance companies, stock brokers, and investment advisers. In addition to questions about trust, the survey also investigated numerous financial behaviors. Respondents were asked about DC plan participation, contribution behavior (such as total amount contributed in the previous year), withdrawal behavior, plan balances, and stock ownership (overall and within a DC plan). Importantly for our study, the survey also examined whether respondents received retirement saving and investing advice from numerous sources including financial planners, friends, books, and television programs.
MS189 also posed questions designed to measure financial literacy and risk preferences. Respondents were presented with a series of nine questions drawn from the financial literacy measure developed by Lusardi and Mitchell (Reference Lusardi and Mitchell2007). Respondents were also presented with a series of ten hypothetical paired lottery choices, as in Holt and Laury (Reference Holt and Laury2002), which can be used to create a measure of risk aversion.Footnote 2
In this wave of the survey, 2,946 respondents answered the questions on financial trust, financial literacy, and risk preferences. Our analysis is based on this sample.
2.2 MS73: financial advice survey and experiment
We use data on financial advice behavior from a survey and experiment that were administered to 2,224 respondents as wave MS73 of the ALP in June of 2009. MS73 respondents who are enrolled in an employer-sponsored DC plan were asked about whether they had used a financial advisor for defined-contribution related advice the previous year, and whether they planned to do so in the current year.
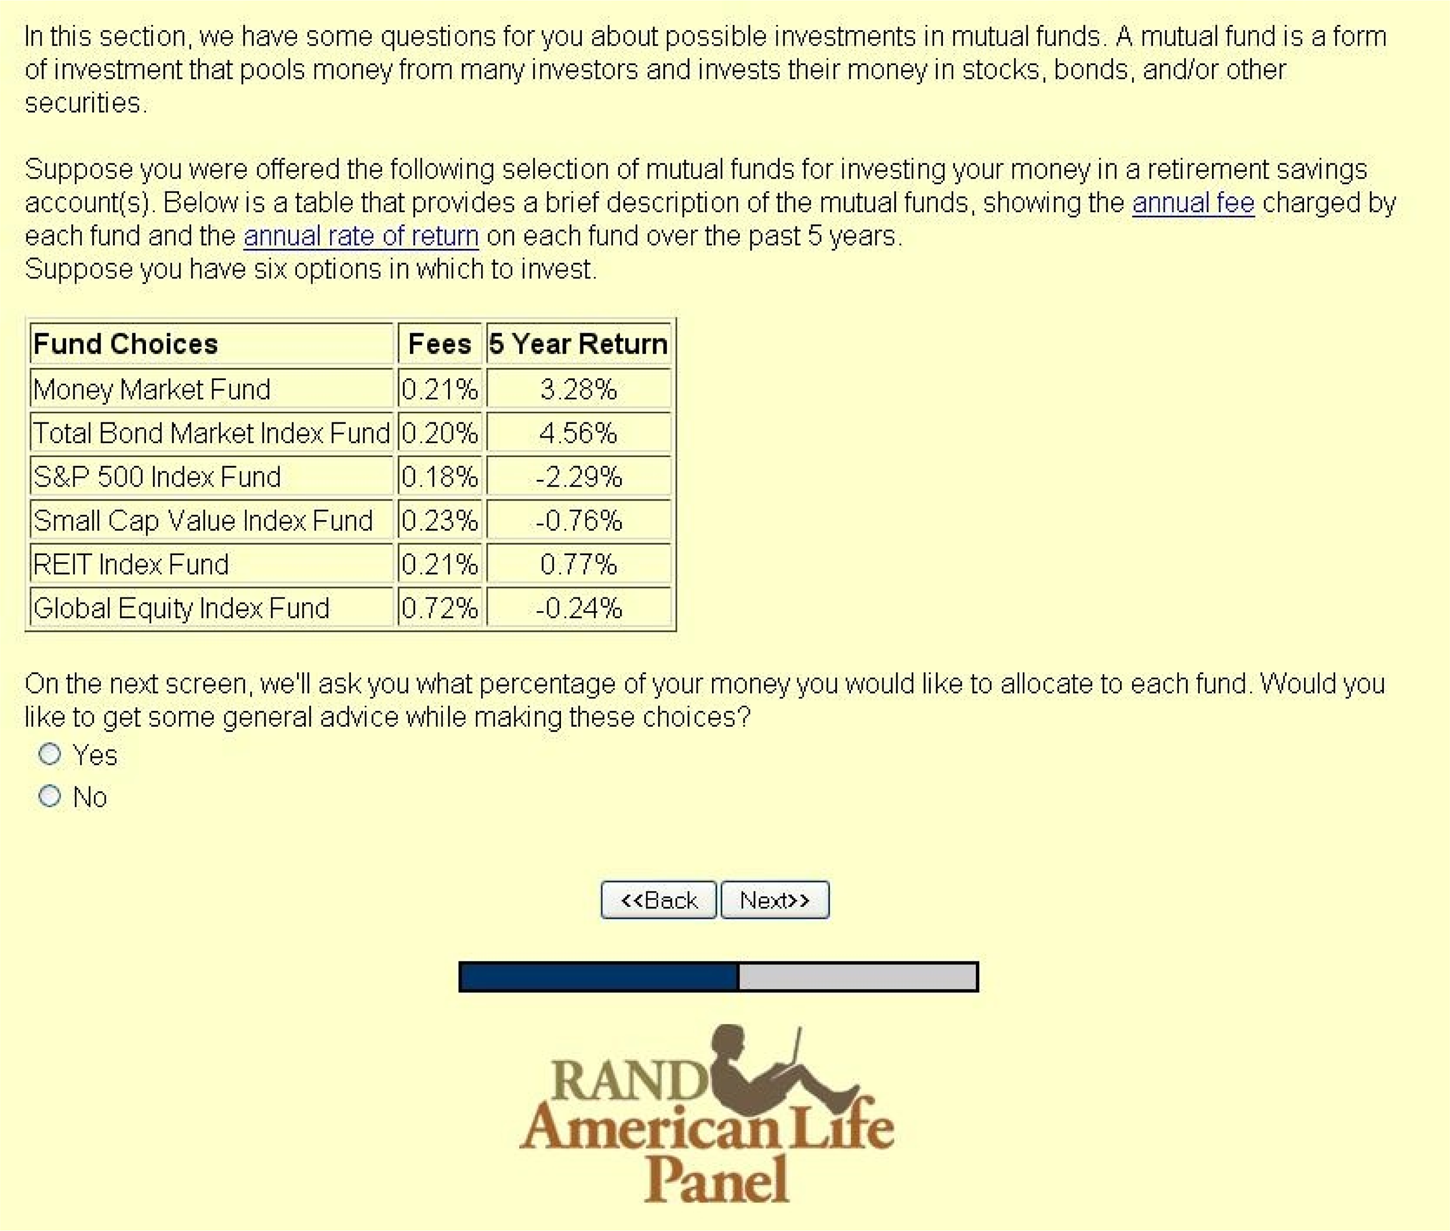
We also examine data from an experiment conducted on advice seeking and usage in the same module (irrespective of whether the respondent was participating in a DC plan). In the context of a hypothetical portfolio allocation task, participants were presented with six investment options: a money market fund, a bond market index fund, an S&P 500 index fund, a small cap value index fund, a real estate investment trust index fund, and a global equity index fund. Participants received basic information on the funds, namely fees and returns, and were then asked to allocate the funds among a hypothetical portfolio.
Participants were randomly assigned to either a control group or one of two experimental conditions. In all conditions, participants were informed that they would be asked to allocate their portfolio. The control group received no further information or support before performing the task. In one treatment, the default treatment, all participants received advice regarding optimal portfolio allocation. In the other treatment, the affirmative decision treatment, participants were given a choice and received advice only if they chose to do so. Figure 1 shows the task description for the affirmative decision treatment.
Screenshot of affirmative decision treatment.

Participants who received advice were given simple rules based on avoiding common portfolio ‘mistakes’ described by Mottola and Utkus (Reference Mottola, Utkus and Lusardi2008): (1) a zero balance in equities is not recommended; (2) an equity balance of less than 40% is considered overly conservative; (3) holding more than 95% equity is considered overly aggressive; and (4) a portfolio that is 100% in a single asset class may be underdiversified.Footnote 3
2.3 MS13: financial advice survey
Lastly, we use data on individuals' knowledge about legal distinctions between types of financial advisors, experiences interacting with the financial service industry, likelihood of seeking financial advice, and level of trust in financial advice from wave MS13 of the ALP. MS13 was administered to 654 respondents between September and November 2007. Because we use trust measures from MS189, we restrict our analysis of MS13 to the 530 households who responded to MS189.
Respondents were asked about the legal distinctions associated with investment professionals. Next, respondents were asked whether they currently use a financial service provider for advice. Those who answered affirmatively were asked detailed questions about their interactions with their providers. Finally respondents were presented with definitions of broker and investment adviser, including a description of common job titles, legal duties, and typical compensation. Respondents were then asked to report the likelihood of their seeking services (in general) from a broker or investment adviser, the likelihood of seeking investment advice (in particular) from a broker or investment adviser, and the degree to which they would trust investment advice from a broker or an investment adviser.
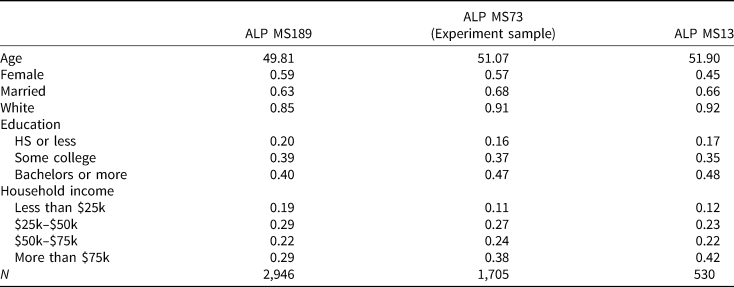
Table 1 describes demographic characteristics for respondents in the three survey waves. Our sample is observably similar to the population distribution as reported by the US Census' Current Population Survey, though our sample tends to be slightly older, more likely to be female, married, and white, more educated, and less likely to be low income.
Sample demographics

3. Trust measures
As previously noted, participants in MS189 were asked to rate how much they trust the stock market, banks, insurance companies, stock brokers, and investment advisers on a five point scale from (1) ‘I do not trust at all’ to (5) ‘I trust completely’.
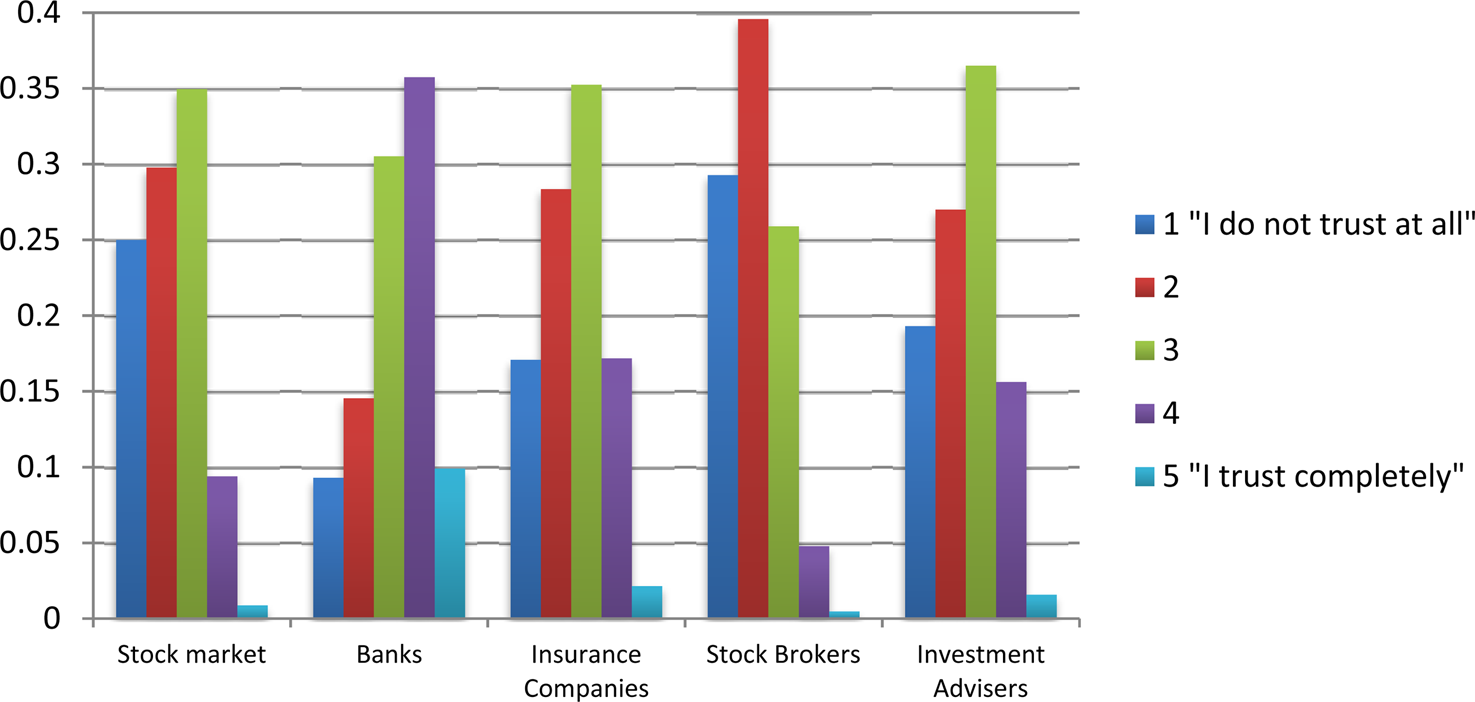
Overall, trust in the financial system is quite low among the respondents. The distributions of responses show that respondents tend to distrust the stock market, insurance companies, stock brokers, and investment advisers (Figure 2). For the stock market, insurance companies, and investment advisers, the modal response is the midpoint of the scale. Respondents report the most trust in banks, for which the modal response leans toward trusting, and report the least trust in brokers, for which the modal response leans toward distrusting.
Distributions of responses to trust questions.

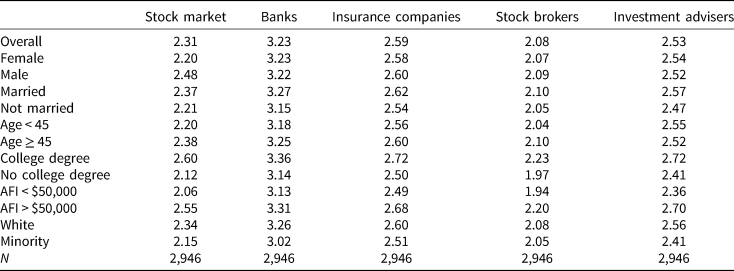
Looking at average trust scores across financial institutions and professionals, we see a similar pattern: trust in the stock market, insurance companies, brokers, and investment advisers all tend toward the distrust end of the scale. Banks are most trusted, and stock brokers are least trusted. Trust is fairly stable across demographic characteristics, with a few notable exceptions (Table 2). On average, those with a college degree or an annual family income (AFI) above
Financial trust

Source: ALP, Wave MS189.
$50,000 are more trusting than their less educated or financially well-off counterparts. Additionally, men are about twice as likely as women to place a large amount of trust in the stock market. Further, minorities and unmarried individuals place less faith in banks than whites and married persons.
As expected, numerical levels of trust across categories are positively correlated, and vary between 0.31 and 0.66 (Table 3). As a result, we summarize respondents' levels of trust into a ‘trust index’ by aggregating the trust information collected in the five questions of interest through factor analysis using the iterated principal factor method. The factor analysis suggests there is one main factor, representing overall trust in the financial system. A table of factor loadings is in the Appendix. Using these factor loadings, we create factor scores using the regression method.
Correlation in trust across financial sectors

Source: ALP, Wave MS189.
3.1 Trust and stock market participation
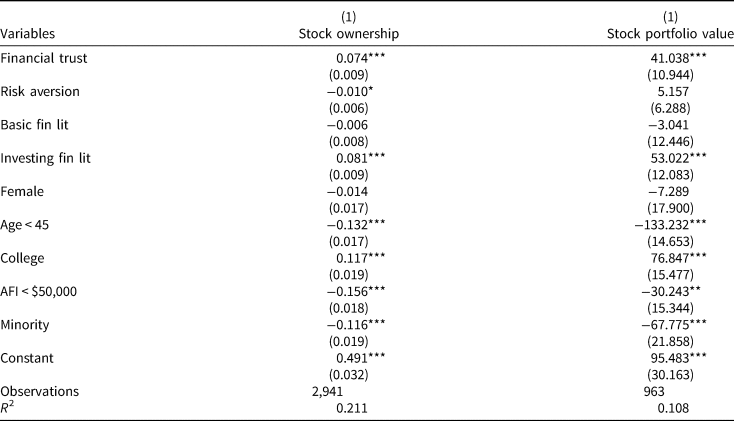
How does trust relate to asset market participation? Using Dutch household survey data, Guiso et al. (Reference Guiso, Sapienza and Zingales2008) finds that less trusting individuals are less likely to buy stock and have less conditional on ownership. To further validate our trust measure, we conduct a similar analysis and find similar results with a sample of U.S. households (Table 4).
Stock market participation and financial trust

Robust standard errors in parentheses. We excluded the top 1% of observations, corresponding to individuals who claimed to own more than $2.3 million in stock.
Source: ALP MS189.
*** p < 0.01, ** p < 0.05, * p < 0.10.
Participants in MS189 were asked if they owned any shares of stock or stock mutual funds. If a participant responded affirmatively, he was then asked for the approximate value. A little over one-third of our sample indicated that they participated in the stock market. Similar to solicitation of professional advice, respondents who are male, married, older, have higher incomes, college educated, and white are more likely to own stock than their respective counterparts.
3.2 Relationships between trust, knowledge, financial literacy and risk preferences
It is possible that financial trust is simply a proxy for other individual characteristics such as knowledge, financial literacy or risk preferences. For example, it is possible that we are measuring familiarity with the financial system rather than trust. Likewise, it is possible that our financial trust measure is measuring the degree of perceived riskiness associated with each of the sectors, rather than underlying trust.
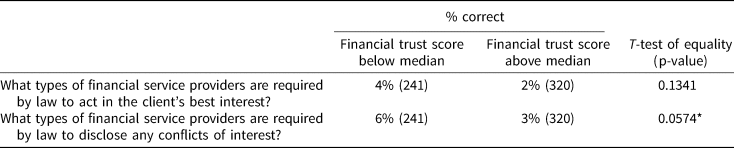
Since the focus of the paper is how trust impacts professional financial advice-seeking, we want to know whether there is correlation between financial trust and knowledge about the financial advice industry. Respondents to wave MS13 were asked knowledge questions about the legal distinctions associated with investment professionals. They were asked: ‘What types of financial service professionals are required by law to act in the client's best interest?’ and ‘What types of financial service professionals are required by law to disclose to clients any conflicts of interest?’ Respondents were asked to check all that apply from a list of: Brokers, Investment Advisers, Financial Advisors or Financial Consultants, Financial Planners, and None of the Above. Very few respondents had correct answers for these two questions: 3% knew that only investment advisers have a fiduciary duty to act in a client's best interest, and 5% knew that only investment advisers are required to disclose conflicts of interest. When we compare correct responses by trust scores, we find that respondents whose financial trust scores are below the median are more likely to get these questions correct than respondents whose financial trust scores are above the median, but these differences are small (Table 5). Only the difference in the response pattern to the question on conflicts of interest is significant at the 10% level.
Knowledge about financial advisors

Source: ALP MS13 and MS189.
*** p < 0.01, ** p < 0.05, * p < 0.10.
Next we use data from MS189 to examine correlations between our financial trust index and financial literacy and risk preferences to investigate whether our measure of trust is measuring a construct independent of financial literacy and risk preferences.
For financial literacy, we first conducted a factor analysis on all nine financial literacy questions. Consistent with the underlying knowledge the questions attempted to measure, the factor analysis indicate there are two main factors with loadings on the two series of questions: the four basic financial literacy questions and the five investment related questions. As a result, we constructed two separate indices, one attempting to measure basic knowledge and one attempting to measure investment knowledge, by performing a factor analysis on each set separately, similar to the construction performed by van Rooij et al. (Reference Van Rooij, Lusardi and Alessie2011). When constructing our indices, we explicitly take into account that incorrect answers may connote different levels of financial sophistication than responses of ‘Don't know’ (Lusardi and Mitchell, Reference Lusardi, Mitchell, Lusardi and Mitchell2011) by constructing two dummy variables for each question; one indicating whether the respondent answered correctly and the other indicating whether the respondent chose ‘Don't know’.
On the basis of the sequence of hypothetical gambles, we created a risk aversion index ranging from 1 to 6, where 1 represents accepting the risky asset under any presented gamble and 6 represents never accepting the risky asset regardless of the possible payout. A sizeable portion of the sample appears to be fairly risk averse with 31% unwilling to accept any gamble.
Table 6 presents the correlation between each of our measures. As one might expect, the correlation between basic and investment financial knowledge is fairly strong, but the correlation between trust and the other measures is quite low. Although there is a positive correlation between trust and financial literacy, and a negative correlation between trust and risk aversion, these correlations are low and trust appears to be accounting for underlying characteristics separate and apart from financial knowledge or risk tolerance.
Correlation between financial trust, financial literacy, and risk aversion

Source: ALP MS189.
4. Trust and financial advice
All three survey waves asked respondents about usage of financial professionals for advice, though questions differed across waves. Respondents to ALP module MS189 who had not yet retired were asked what sources of information they rely upon when making financial decisions concerning retirement:
‘How do you make decisions about saving and investment related to retirement? Choose all that apply’
(1) Ask relatives/friends
(2) Talk to financial planners/brokers
(3) Talk to lawyers
(4) Read magazines/newspapers/books
(5) Get advice from television
(6) Other (please specify)
Respondents in MS73 who were enrolled in an employer-sponsored DC plan were asked ‘In 2008, did you consult a financial advisor for individual recommendations regarding your defined contribution plan?’ Respondents in MS13 were asked ‘Do you currently use any professional service providers for: (1) Conducting stock market and/or mutual fund transactions; and/or (2) Advising, management and/or planning?’
For ease of exposition, we describe respondents whose financial trust scores are below the median as less trusting of the financial system, and those whose financial trust scores are above the median as more trusting of the financial system. Since we are particularly interested in the relationship between trust and financial advice, we also separately explore respondents who distrust brokers and advisers. Respondents who rate their trust in brokers or investment advisers as either 1 or 2 are described as distrusting of brokers or advisers, respectively.
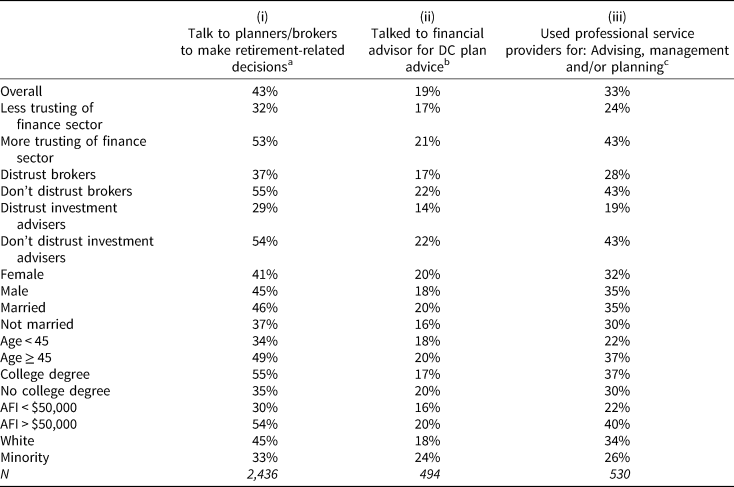
Despite low levels of trust in the financial system, and in brokers and financial advisors in particular, a considerable proportion of respondents report using professional advice: over 40% of MS189 respondents have consulted with a broker or financial planner when deciding how to save and invest for retirement; 19% of DC plan holders in MS73 for whom we have a financial trust score consulted a financial advisor for individual recommendations regarding their DC plan in the year previous to the survey; and 33% of MS13 respondents for whom we have a financial trust score were currently using a financial professional for ‘advising, management, and/or planning’ (Table 7).
Reported advice seeking behavior

a Source: ALP MS189.
b Source: ALP MS73.
c Source: ALP MS13.
Across all survey modules, we find that those who have less trust in the financial sector are less likely to seek professional financial advice. Of MS189 respondents whose trust scores were below the median, only 32% reported seeking retirement-related advice from planners or brokers, whereas 53% of respondents whose trust scores were above the median reported seeking retirement-related advice (Column i). We find a similar pattern when we use individual trust items on brokers and investment advisers. Of respondents who reported that they do not trust brokers, 37% consult financial planners or brokers when making retirement savings decisions, compared to 55% of respondents who do not distrust brokers. We find the widest disparity by comparing those who distrust investment advisers to those who do not distrust investment advisers: 29% compared to 54%. We find similar results when comparing advice seeking behavior by levels of trust across MS73 and MS13 (Columns ii and iii).
We also observe variation across demographic characteristics. Unsurprisingly, individuals who are married, older than 45, college educated, or have incomes above the national median are more likely to seek financial advice from a professional than their respective counterparts. Given the variation in behavior across demographic characteristics, we also investigate how trust impacts advice seeking using regression analysis. Specifically, we use linear probability models with the propensity to seek advice as our binary outcome variable.Footnote 4 We use ordinary least squares to estimate the equation:
 $$ Y_i = \alpha + \beta \;trust_i\; + X_i^{\rm ^{\prime}} \; \delta + \varepsilon $$
where Y i represents the source of information (taking a value of 1 if an advisor is consulted), X i, is a vector of commonly-used observable demographic and individual characteristics (including financial literacy), trust denotes our trust index, and ɛ is an individual error term.
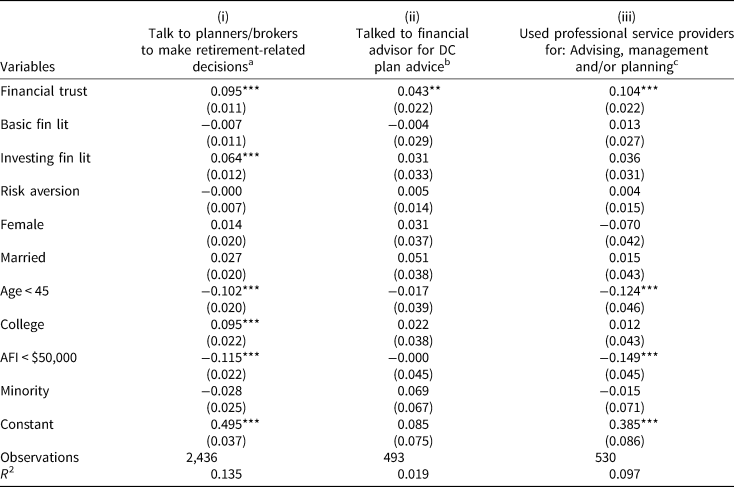
The multivariate analysis (Table 8) yields similar insights to the descriptive statistics in Table 7. As we found in the descriptive statistics, individuals with higher levels of trust in the financial system are more likely to seek professional financial advice for retirement decisions, for DC plan advice, and in general. Note that trust in the financial system and financial literacy were measured in 2011 while MS73 was completed in 2009 and MS13 was completed in 2007. Consequently, it is likely that our trust index and measures of financial literacy are only noisy proxies at the time of the previous two surveys. As a result, it is likely that our analytical results are attenuated.Footnote 5
Financial trust and propensity to seek professional advice

Robust standard errors in parentheses.
a Source: ALP MS189.
b Source: ALP MS73.
c Source: ALP MS13
*** p < 0.01, ** p < 0.05, * p < 0.10.
Investing knowledge is also highly related to the use of a planner or broker for retirement-related decisions, similar to the result found in van Rooij et al. (Reference Van Rooij, Lusardi and Alessie2011). Furthermore, we find that older respondents and higher income respondents are more likely to consult professionals when making retirement saving and investing decisions or for general planning (Columns i and iii).
4.1 Experimental evidence
Across different waves of the ALP, we have consistently found that respondents' trust in the financial sector is positively correlated with seeking professional financial advice. However, it is impossible to establish causality with these survey data. Does trust lead to the solicitation of advice, or does the relationship with a financial advisor lead to higher levels of trust, or both? We examine the experiment conducted in MS73 to shed light on the issue. While the analysis can't rule out the possibility that a relationship with a financial advisor engenders trust, it can address whether trust influences the receipt of advice.
Of the 2,224 respondents who participated in module MS73, 2,070 completed the hypothetical portfolio allocation experiment. Of these respondents, we have a trust score (and non-missing demographic characteristics) for 1,705 of them from MS189. In our analyses, we also control for financial literacy as Hung and Yoong (Reference Hung, Yoong, Mitchell and Smetters2013) found evidence of selection based on financial knowledge.
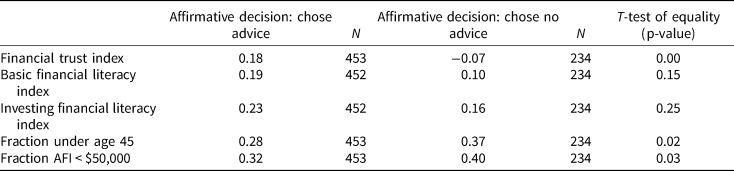
Despite the fact that advice was free, not all individuals in the affirmative decision treatment chose to get advice: only 66% elected to receive it. We find some evidence that individuals who are more financially literate are more likely to accept the offer of advice, though differences are not statistically significant (Table 9). Older individuals and those with higher incomes were more likely to solicit advice. Importantly we find that trust is a significant predictor of advice solicitation. Those with higher levels of trust in the financial system were much more likely to accept the offer of free advice.
Take-up of advice

Source: RAND ALP MS73, MS189.
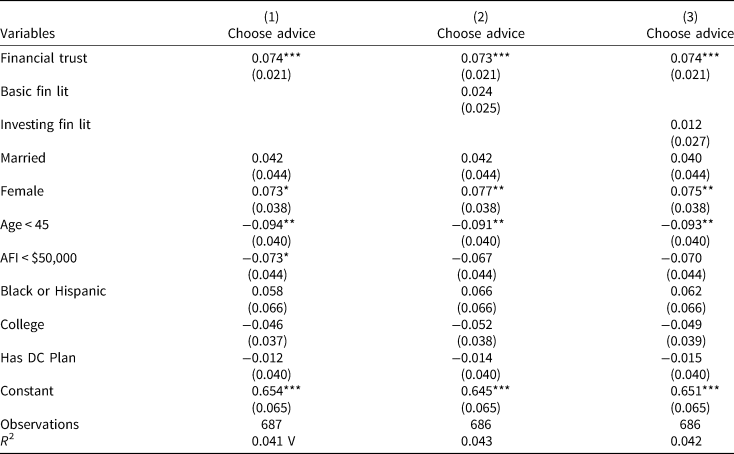
Table 10 shows the propensity to accept advice in the affirmative decision treatment estimated using equation (1). After controlling for demographic characteristics, returns and advice presentation treatments, and financial literacy, trust remains highly significant, indicating that trust in the financial sector is an important predictor of who takes up advice. However, the relatively low R 2 indicates that a large amount of variation in the solicitation remains unaccounted for even after including our measure of trust.
Propensity to seek advice (affirmative decision treatment)

Robust standard errors in parentheses. Regressions also control for two (orthogonal) treatments, one that varied the rate of return on investment options and one that varied the format of advice presentation.
Source: ALP MS64, MS73, MS189.
*** p < 0.01, ** p < 0.05, * p < 0.10.
4.2 Trust and use of advice
The previous section established that individuals with higher levels of trust are more likely to request advice. But are they more likely to follow the advice they receive? We examine this question by investigating how the receipt of advice, both solicited and unsolicited, affects performance on the hypothetical portfolio selection task. As in Hung and Yoong (Reference Hung, Yoong, Mitchell and Smetters2013), we measure performance by the absence of ‘mistakes’ as defined by Mottola and Utkus (Reference Mottola, Utkus and Lusardi2008).Footnote 6
We first examine whether advice itself has an effect and whether those with higher levels of trust are less likely to make ‘mistakes’. We compare the performance of the control group (no advice) with that of the default (unsolicited advice) and affirmative decision (optional advice) treatment groups using the following equationFootnote 7:
 $$Y_i = \alpha + \beta \;trust_i + \beta _d\;default_i + \beta _a\;affirmative_i + X_i^{\rm ^{\prime}} \delta + \varepsilon $$
where default and affirmative are dummy variables capturing treatment assignment.
Consequently, β d and β a measure the intent-to-treat estimate of the default and affirmative decision treatments respectively.
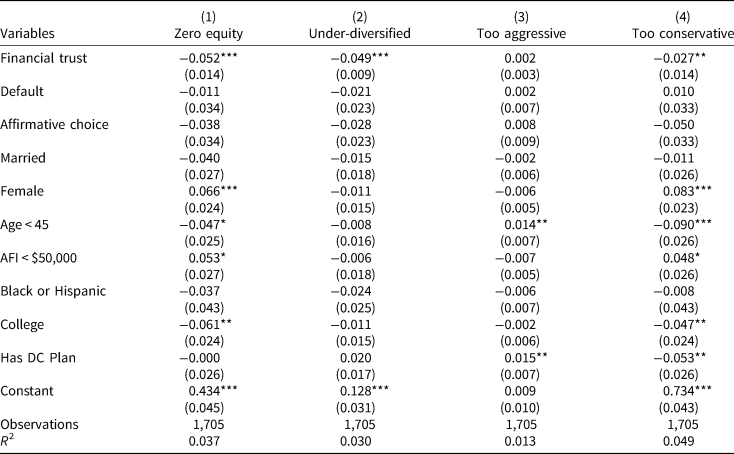
Table 11 shows that after controlling for trust, neither advice treatment had an effect on investment allocation performance. Importantly, those with higher levels of trust perform better – they are less likely to hold no equity, be under-diversified, or too conservative.Footnote 8
Financial trust and portfolio quality

Robust standard errors in parentheses. Regressions also control for two (orthogonal) treatments, one that varied the rate of return on investment options and one that varied the format of advice presentation.
Source: ALP MS64, MS73, MS189.
*** p < 0.01, ** p < 0.05, * p < 0.10.
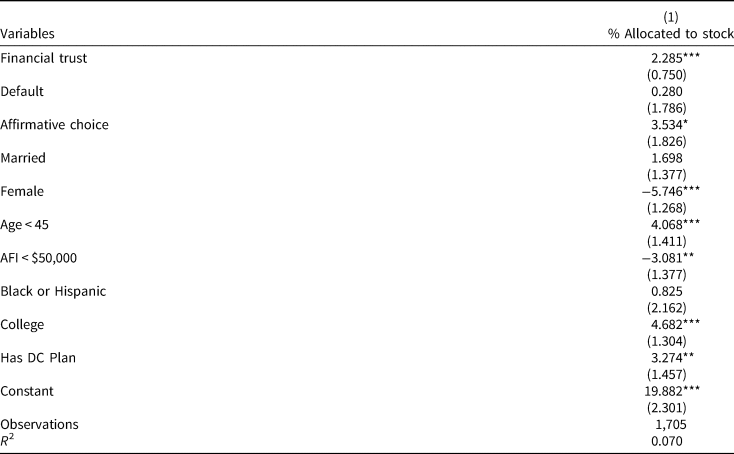
Individuals who adherently followed advice would allocate a significant fraction of their portfolio to stocks, but not more that 95%. Table 12 shows that when controlling for trust, participants in the affirmative choice treatment assigned a larger percentage of their portfolios to stocks than those in the control group, though the result is only significant at the 10% level. Further, those who have higher levels of trust also tended to allocate a larger fraction of their portfolio to equities.
Financial trust and stockholding

Robust standard errors in parentheses. Regressions also control for two (orthogonal) treatments, one that varied the rate of return on investment options and one that varied the format of advice presentation.
Source: ALP MS64, MS73, MS189.
*** p < 0.01, ** p < 0.05, * p < 0.10.
4.3 Heterogeneous effects in the default treatment group
The previous section suggests that those who have higher trust in the financial system performed better on the portfolio allocation task, but that the treatment groups didn't perform any better, on average, than the control group. The average effect, however, might mask important differences across subgroups. In particular, although providing compulsory advice didn't improve decision making on average, it is possible that those with higher levels of trust paid more attention to the advice and improved their performance.
To investigate this possibility we focus on individuals in the default and control groups, and create dummy variables interacting trust and default treatment status. For this analysis, we characterize individuals with ‘high trust’ as those who lie above the sample median on our trust index.Footnote 9
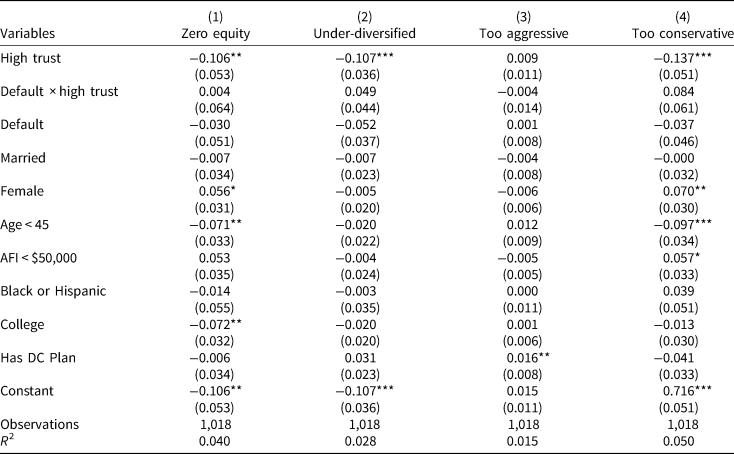
Once again we find that those with higher levels of trust make better decisions, but we do not find that those who are more trustful of the financial system perform better than those who are less trustful when unsolicited advice is provided (Table 13). This result is rather striking. Even amongst individuals prone to soliciting advice, mandatory advice seems to have little impact on behavior.
Heterogeneous treatment effects (default treatment vs. Control)

Robust standard errors in parentheses. Regressions also control for two (orthogonal) treatments, one that varied the rate of return on investment options and one that varied the format of advice presentation.
Source: RAND-USC ALP MS64, MS73, MS189.
*** p < 0.01, ** p < 0.05, * p < 0.10.
4.4 Selection effects and treatment-on-the-treated estimates
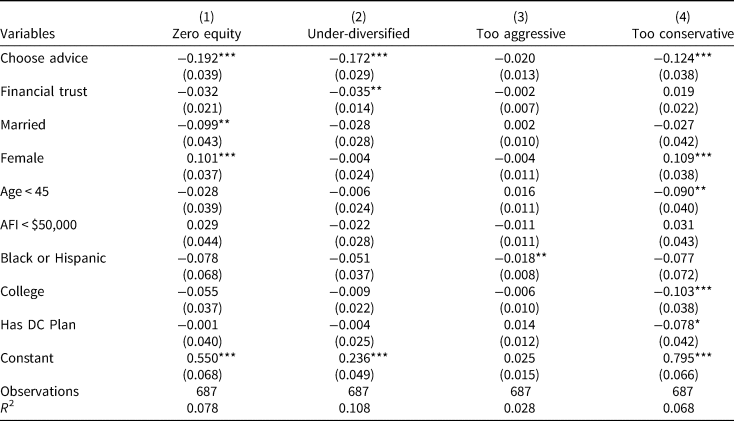
As shown in Table 11, controlling for trust, individuals offered the opportunity to receive advice performed no better, on average, on the allocation task than individuals in the control group. However, within the affirmative decision treatment did those who chose to receive advice perform better than those who did not? Table 14 shows that after controlling for trust and other covariates, those who chose to receive advice were significantly less likely to hold zero equity, be under-diversified and be over-conservative than their counterparts. Additionally, those who received advice didn't improve performance on these dimensions by becoming excessively aggressive, as they were no more likely to be over-aggressive than those who did not receive advice.
Selection effects (affirmative decision treatment)

Robust standard errors in parentheses. Regressions also control for two (orthogonal) treatments, one that varied the rate of return on investment options and one that varied the format of advice presentation.
*** p < 0.01, ** p < 0.05, * p < 0.10.
Although there are large differences in behavior between those who chose to receive advice and those who did not, these differences may be due to selection rather than the receipt of advice. Indeed, the intent-to-treat analysis described above found no differences between the control group and the affirmative decision group on average, suggesting that the behavioral differences observed between those who chose to receive advice and those who chose not to may be largely driven by selection on unobservable characteristics that influence both receipt of advice and performance on the allocation task, such as motivation or interest.
To further investigate this possibility, we examine the effect of advice on those who chose to receive it by estimating the impact of treatment-on-the-treated. Particularly, we estimate the following equation (excluding participants assigned to the default advice treatment):
 $$Y_i = \alpha + \beta \;trust_i\; + \beta _{\rm 1}\; advice_i\; + X_i^{\rm ^{\prime}} \delta + \varepsilon $$
where assignment to the affirmative decision treatment is used as an instrument for receipt of advice.
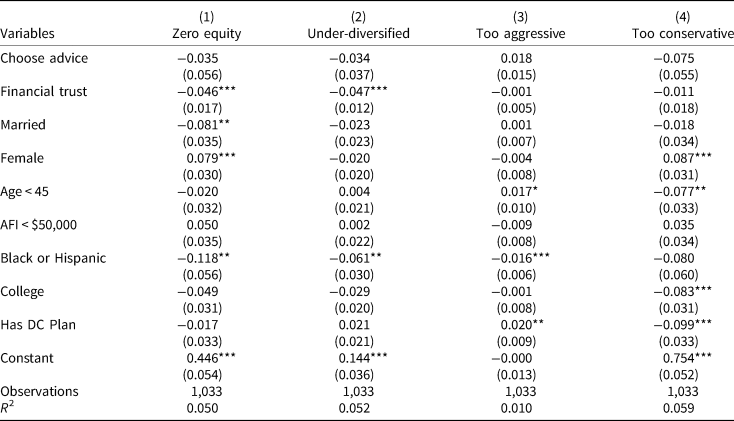
Table 15 shows that after controlling for self-selection, receipt of advice has a negligible impact on performance on the portfolio allocation task. Compared with the estimates presented in Table 14, the estimated impact of treatment is far more muted, and not statistically significant, on any of the four dimensions. This implies that the sizeable gap in behavior observed between those who choose to receive advice and those who choose against it is driven largely by self-selection, rather than the receipt of advice.
IV Regression: treatment-on-the-treated

Robust standard errors in parentheses. Choice of receiving advice is instrumented using random assignment and covariates. Regressions also control for two (orthogonal) treatments, one that varied the rate of return on investment options and one that varied the format of advice presentation.
*** p < 0.01, ** p < 0.05, * p < 0.10.
5. Conclusion
Though financial advice, particularly from a fiduciary, may be beneficial to households looking to make important financial decisions, financial advice usage is relatively low. Despite this, relatively few empirical studies have investigated who seeks financial advice. Previous work has found that demographic characteristics such as age, education, and income, and individual characteristics such as financial literacy can help explain advice-seeking (Hung and Yoong, Reference Hung, Yoong, Mitchell and Smetters2013; Calcagno and Monticone, Reference Calcagno and Monticone2015). At the same time, there are few studies that investigate the impact of trust on financial behaviors. In the literature, stock market participation has been the main financial behavior of interest in investigating the impact of trust, and evidence shows that trust has a positive impact on stock market participation (Guiso et al., Reference Guiso, Sapienza and Zingales2008). In this paper, using both survey data and data from a randomized experiment, we find that trust in the financial sector is an important predictor of financial advice-seeking behavior. We show that, across three different survey waves that span 2007 to 2011, our measure of financial trust is highly correlated with different types of financial advice-seeking: specifically related to retirement advice, specifically related to DC plan advice, and in general. With survey data, it is difficult to determine causality, so we supplement our survey evidence with data from a randomized controlled trial that exogenously varied access to (and provision of) financial advice. Our analysis of a hypothetical choice experiment shows that higher levels of trust do indeed increase one's propensity to seek advice. Moreover, individuals who actively solicited advice performed better on the hypothetical portfolio task, though our analysis suggests this effect was driven primarily by self-selection rather than the receipt of advice. Indiscriminately providing unsolicited advice, however, has little impact on behavior, even for individuals that place a significant amount of trust in the financial system.
Our results have several implications for (retirement) financial advice markets. First, low levels of trust may be significantly reducing the demand for financial advice. While increasing the level of trust in the general financial marketplace may be difficult, consumers appear to be confused about the roles and obligations of various financial professionals (Hung et al., Reference Hung, Clancy, Dominitz, Talley and Berrebi2008). Increased understanding that investment advisors are bound to a fiduciary standard (legally required to act in their advisee's best interest) may increase trust and by extension demand for these professionals' services. Second, we find essentially no evidence that increasing the provision of advice by providing it to consumers without their request will improve financial decisions or outcomes. Unsolicited advice in our experiment had no impact on behavior. Instead of increasing its distribution, it may be more effective to increase consumers' understanding of, and trust that, high quality sources of financial advice exist and let consumers self-select into advice.
Acknowledgement
We thank the Department of Labor, Employee Benefits Security Administration (EBSA) for financial support for this project and Katie Wilson for research assistance. All views and errors are our own.
Appendix
Factor loadings corresponding to trust in the financial system

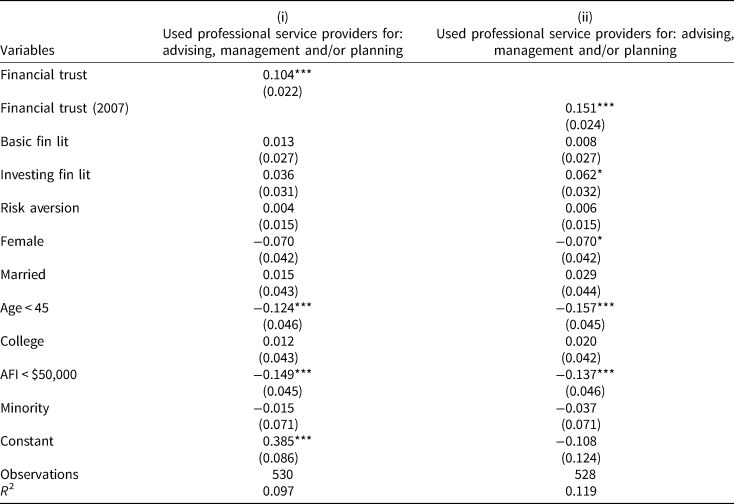
Financial trust and propensity to seek professional advice robustness to trust measurement