INTRODUCTION
The general concern about climate change and global warming has triggered, over the past years, research efforts concerning the development of analytical procedures and certified protocols for the determination of the proportion between biogenic/fossil carbon in different kinds of samples such as plastics (Quarta et al. Reference Quarta, Calcagnile, Giffoni, Braione and D’Elia2013; Jou et al. Reference Jou, Macario, Carvalho, Dias, Brum, Cunha, Ferreira and Chanca2015), waste, synthetic gases (Palstra et al. Reference Palstra, LPLM and Meijer2015), and flue gases from industrial sources (Hämäläinen et al. Reference Hämäläinen, Jungner, Antson, Räsänen, Tormonen and Roine2007; Quarta et al. Reference Quarta, Ciceri, Martinotti, D’Elia and Calcagnile2015). This is related to the policies, promoted at both the national and international level, aiming at mitigating the anthropogenic release of CO2, a well recognized greenhouse gas, into the atmosphere. For instance, in the European Union these policies have been structured in the so called 20-20-20 strategy which sets three main objectives to be pursued by member states by 2020 and namely the reduction of 20% of greenhouse gases emissions (compared to 1990), the increase to 20% of the share of renewable energy sources and of 20% of energy efficiency (European Union 2008).
Among the strategies through which these objectives are implemented, one is related to the promotion, also from the financial point of view, of the production of energy from non-fossil sources and the use of bio-derived materials. Through this approach a “balance” is expected and achieved between the carbon dioxide released into the atmosphere and that sequestered during the life-cycle of the used biomass without mobilising fossil resources.
In this context the development of methods for measuring and assessing the proportion between fossil and biogenic carbon dioxide in flue gases from industrial sources (for instance WTE: Waste to Energy Plants) received significant attention in recent times (Mohn et al. Reference Mohn, Szidat, Fellner, Rechberger, Quartier, Buchmann and Emmenegger2008; Palstra and Meijer Reference Palstra and Meijer2010; Calcagnile et al. Reference Calcagnile, Quarta, D’Elia, Ciceri and Martinotti2011). Indeed the clear difference in terms of 14C isotopic signature between fossil and biogenic material makes accelerator mass spectrometry (AMS) a very powerful tool in this field. Different studies have shown the high potential of the method such as the possibility to obtain direct information on the CO2 released into the atmosphere and the possibility to tune sampling methods and times in order to have either average values over long periods of time or high temporal resolution depending on the required information. Nevertheless different aspects had to be properly addressed before including it in internationally accepted protocols such as sampling strategies and the development of the proper calculation procedures allowing to obtain, from the measured radiocarbon content, the bio-derived content with the highest possible precision and accuracy. Nowadays different protocols have been established and validated at the international levels regulating the use of radiocarbon in this field such as the protocol ISO 13833:2013 “Stationary source emissions -- Determination of the ratio of biomass (biogenic) and fossil-derived carbon dioxide -- Radiocarbon sampling and determination”.
In this paper we present the results of a study performed in order to validate the use of the 14C method for the determination of the biogenic fraction in flue gases from stationary sources and to assess the achievable precision and accuracy levels. This was obtained by using an experimental setup capable of creating “synthetic atmospheres” simulating the typical compositions of flue gases from industrial stacks but with a controlled proportion between fossil and biogenic carbon dioxide. By using this experimental setup, the composition of the gas mixture and thermodynamic parameters such as gas velocity, temperature, and humidity could be controlled in a much more accurate and reliable way than what it is typically possible on real plants.
MATERIALS AND METHODS
The “Loop” pilot setup was designed and built by RSE (Ricerca sul Sistema Energetico) in Milan (Italy) for the simulation of the emissions from combustion sources and for the validation of the 14C-based method for the determination of the biogenic/fossil fraction in flue gases in controlled conditions.
System Description
From the functional point of view the facility is formed by three sections: the “loop” where synthetic atmospheres are maintained, the supply unit of pure gases and the analysis unit.
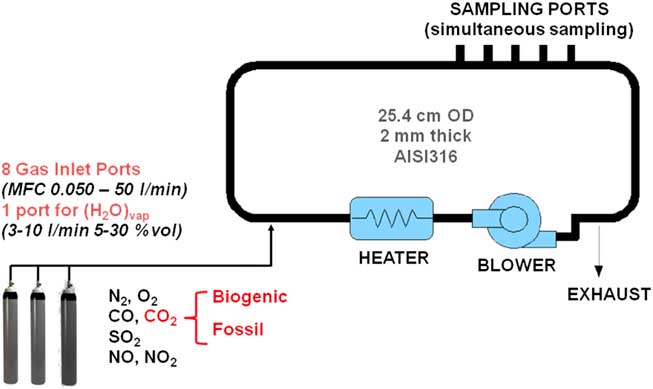
The “loop”, with a footprint of 5×18 m, is a wind tunnel schematized in Figure 1. It is formed by a 10′′ OD, 2 mm thick, stainless steel pipe, a blower (Mod. FG630 by Novavit, Turin, Italy) used to keep the gas flowing (flow rate range 1’000–5’000 Nm3/h) at the set velocity (measured by a Pitot probe) and a natural gas boiler heater (maximum power 30 kW) used to control gas temperature and prevent water vapor condensation (Cipriano et al. Reference Cipriano and Fialdini2015). The pressure of the gas mixture in the system is kept >1 bar (maximum overpressure 60 mbar) by continuously adding pure gases in order to compensate leaks towards the external part while an automatically controlled gas release system is used to keep the pressure constant. The difference between the inlet and exhaust flow is used to monitor leaks.
A scheme of the “Loop” test plant with the indication of the main functional blocks and its technical features.

The “closed loop” configuration allows to reduce the consumption of pure gases and to better control the chemical and physical parameters of the gas mixture.
The supply unit is used to generate in a continuously controlled way the gas mixture feeding the “loop” both during the plant filling stage and during tests (with durations ranging from 4 to 24 hr). The gas mixture is generated by means of a dynamic dilution devices bench which is used to mix the pure gases stored in certified cylinders by calibrated mass flow controllers (MFC) with an adjustable flow rate (0.05–50 L/min). The H2O content in the mixture is adjusted by transferring through a heated pipeline to the loop unit the steam generated by an HovacalTM calibration gas-generator for gas vapor mixtures.
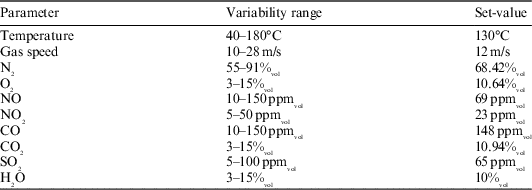
The concentration level in the gas mixture is continuously monitored by a calibrated Fourier transform infrared (FTIR) gas analyzer. Table 1 summarizes the different parameters that can be adjusted during the experiments in order to simulate conditions in real plants. The variability ranges of each parameter are also shown. The system accommodates five sampling ports (max sampling flow: 1 L/min, DN100 coupling), placed at the end of a linear part of the system in order to have uniform sampling conditions.
Variability ranges and set values for different parameters in the “Loop” plant.

Experimental Conditions
Gas mixtures with different proportions of fossil/biogenic carbon dioxide were generated by mixing certified fully fossil (14C=0 pMC) and biogenic CO2 supplied by Sapio, Italy. The radiocarbon content in the fully biogenic CO2 was measured to be 102.0±0.4 pMC at the Centre for Dating and Diagnostics (CEDAD) at the University of Salento. In the present study the composition of the flowing gas was set in order to simulate typical conditions in real plants (Table 1) with CO2 concentration adjusted at 10.94 (±0.96)%vol.
Four different scenarios were then simulated, depending on the proportion of the biogenic carbon dioxide in the gas mixture: 0%, 20%, 50%, and 100% biogenic. Four different laboratories independently and simultaneously sampled the gas mixture by using the sampling port of “Loop” in order to compare the results. The four laboratories were Force Technology (Denmark), Lab Analysis (Italy), SIBE (Italy), and RSE (Italy). They were only requested to collect the samples which were then sent to CEDAD, which was responsible for the AMS 14C determinations.
Carbon dioxide was sampled as described in details in Calcagnile et al. (Reference Calcagnile, Quarta, D’Elia, Ciceri and Martinotti2011) and essentially by bubbling the filtered gas mixture in an alkali (100 mL, 4 M KOH) solution for 3 hr according to the protocol defined in ISO 13833-2013 “Stationary source emissions -- Determination of the ratio of biomass (biogenic) and fossil-derived carbon dioxide -- Radiocarbon sampling and determination”. The same solution was used by the four laboratories. Sample solutions were then sealed and sent to CEDAD for CO2 extraction and AMS radiocarbon measurement. Carbon dioxide extraction was performed as soon as the samples arrived in the laboratory. Chemical processing consisted in the release of the dissolved carbon dioxide by acidification with 85% H3PO4, cryogenic cleaning and the following reduction to graphite with H2 at 600°C (D’Elia et al. Reference D’Elia, Calcagnile, Quarta, Rizzo, Sanapo, Laudisa, Toma and Rizzo2004). The 14C/12C isotopic ratios were measured at the AMS beamline of CEDAD (Calcagnile et al. Reference Calcagnile, Quarta, D’Elia, Rizzo, Gottdang, Klein and Mous2004, Reference Calcagnile, Quarta and D’Elia2005).
For the calculation of the biogenic/fossil fraction the procedures described in Calcagnile et al. (Reference Calcagnile, Quarta, D’Elia, Ciceri and Martinotti2011) have been used. In particular the biogenic fraction in the sampled CO2 was calculated as:
 $${\rm x}_{{{\rm bio}}} {\equals}{{{\rm f}_{{{\rm meas}}} {\minus}{\rm f}_{{{\rm back}}} {\rm x}_{{{\rm back}}} } \over {{\rm f}_{{{\rm bio}}} }}$$
where fmeas is the measured 14C concentration in the sample, fbio the 14C concentration in the fully biogenic sample, fback and xback is the 14C isotopic content and the mass fraction of the “contaminant” present in the used sampling solution or introduced during sampling and storing before processing. It is worth noting that fback xback has to be properly estimated for accurate determinations of the biogenic/fossil fraction from dedicated experiments and by using the condition xback+xbio=1.
The 14C concentration fmeas, corrected for mass fractionation and radioactive decay, was calculated according to Quarta et al. (Reference Quarta, Ciceri, Martinotti, D’Elia and Calcagnile2015):
 $$f_{{meas}} {\equals}{}^{{14}}a_{N}^{S} \left( {pMC} \right){\equals}150.61{{{}^{{14}}A_{{sample}}^{{bg}} \cdot \left[ {{{1{\plus}\delta {}^{{13}}C_{N} } \over {1{\plus}\delta {}^{{13}}C_{{sample}} }}} \right]} \over {{}_{{\rm }}^{{14}} A_{{C6}}^{{bg}} \cdot \left[ {{{1{\plus}\delta {}_{{\rm }}^{{13}} C_{N} } \over {1{\plus}\delta {}_{{\rm }}^{{13}} C_{{C6}} }}} \right]}} \cdot e^{{{\rm \lambda }\left( {{\rm t}_{0} {\minus}{\rm t}_{{\rm s}} } \right)}} $$
where:
 $${}^{{{\rm 14}}}{\rm A}_{{{\rm sample}}}^{{{\rm bg}}} $$
and
 $${}^{{{\rm 14}}}{\rm A}_{{{\rm C6}}}^{{{\rm bg}}} $$
express the measured 14C/12C ratios for the sample and the used standard (IAEA C6) both corrected for machine and processing background; δ13CN is the reference value of –25‰ (relative to PDB); δ13CC6 and δ13Csample the measured δ33C values for IAEA C6 and the sample, respectively; and λ, t0, and ts are the decay constant of radiocarbon, the reference year 1950 CE and the sampling year, respectively.
RESULTS AND DISCUSSION
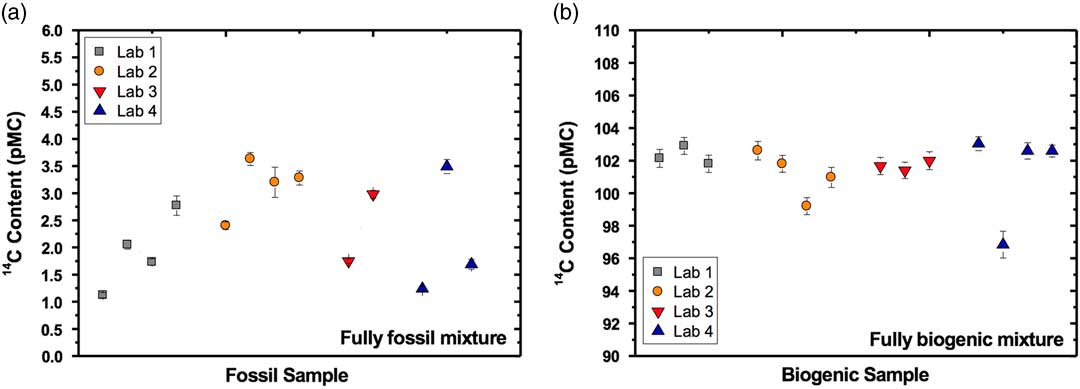
Figure 2 shows the results (in an anonymous way) obtained by the four different laboratories for the two scenarios: fully fossil (Figure 2a) and fully biogenic gas mixtures (Figure 2b). Each data point represents an independent, 3 hr, sampling action. For the fully fossil mixture the average measured 14C concentrations were 1.91±0.69, 3.12±0.52, 2.36±0.87, 2.14±1.19 pMC for the four different laboratories, respectively. The measured values are statistically consistent between each other and an average value of 2.39±0.53 pMC can be calculated. This value is significantly higher than machine background (~0.03 pMC) and chemical processing background (~0.2 pMC) indicating an additional, relevant source of contamination in the analyzed samples.
Measured 14C concentration for the fully fossil (a) and fully biogenic (b) gas mixtures. Error bars indicate the 14C measurement uncertainty with a confidence level of one standard deviation.

For the fully biogenic mixture the average values for the four different laboratories are: 102.28±0.56, 101.45±1.5, 101.69±0.30, 102.74±0.26 pMC where the last value (for Lab4) is obtained averaging three of the measurements performed after removing an outlier.
Also in this case, then, the measured values are statistically consistent between each other and an average value of 101.96±0.69 pMC can be calculated. The analysis of the results obtained on the fully fossil and biogenic mixtures indicates that the induced contamination is essentially modern and corresponds to xback=2.4%. This indicates that the highlighted contamination can be ascribed to modern CO2 probably dissolved in the alkali solution either during sampling or storage. Further studies will allow to clarify this aspect and also explain the measured scatter between the values measured for each laboratory.
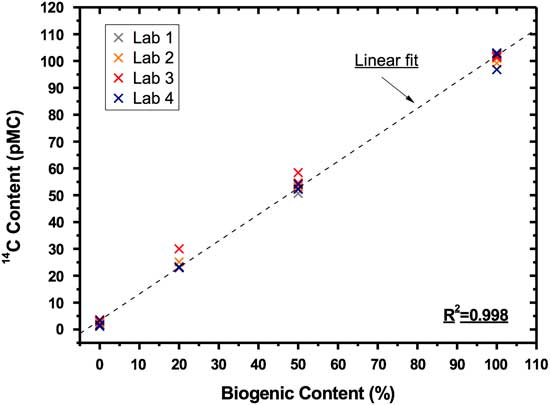
The results obtained for all the analyzed samples, each corrected for the measured contamination for that laboratory, are shown in Figure 3 reporting the measured radiocarbon concentration versus the expected bio content: a very good linear correlation is found with a slope of 0.99, an intercept of 3.0 and a R2 value of 0.998.
14C concentrations measured on the solution sampled by the different laboratories and for the different gas mixtures versus the expected biogenic content.

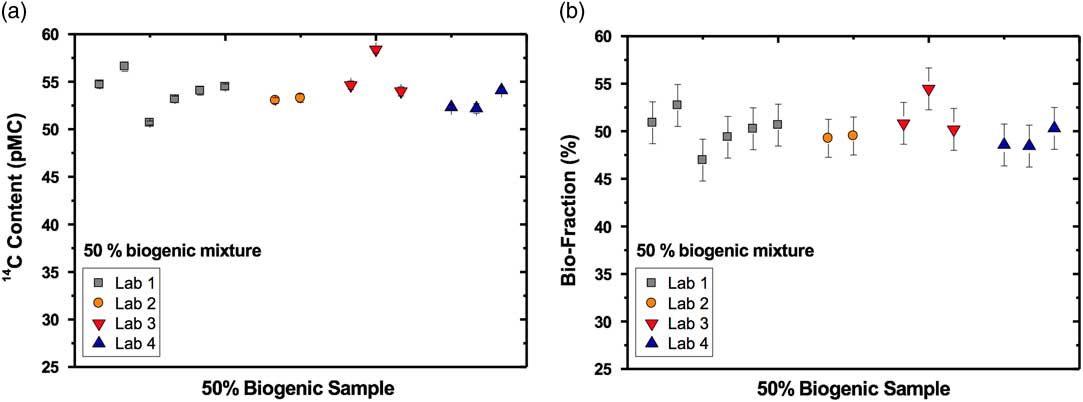
Figure 4 shows the measured 14C concentration (Figure 4a) and the corresponding calculated biogenic fraction (Figure 4b) for the gas mixture containing 50% biogenic carbon dioxide. The average 14C concentrations were 53.93±1.96, 53.15±0.18, 55.67±2.36, 52.87±1.06 pMC for the four laboratories, respectively. These values were then used to calculate the biogenic fraction in the gas mixture (Figure 4b) and the corresponding average values which were: 50.1±2.0, 49.4±0.2, 51.8±2.3, and 49.1±1.0%, where the uncertainty is calculated as the scattering of the data measured for each laboratory. It can be seen that all the calculated biogenic fraction overlap, within one standard deviation, with the expected value of 50% with an average calculated value of 50.1±1.2%.
Measured 14C concentrations (a) and calculated biogenic fractions (b) for the gas mixture containing 50% of bio-derived carbon dioxide. Error bars indicate the radiocarbon measurement uncertainty with a confidence level of one standard deviation.

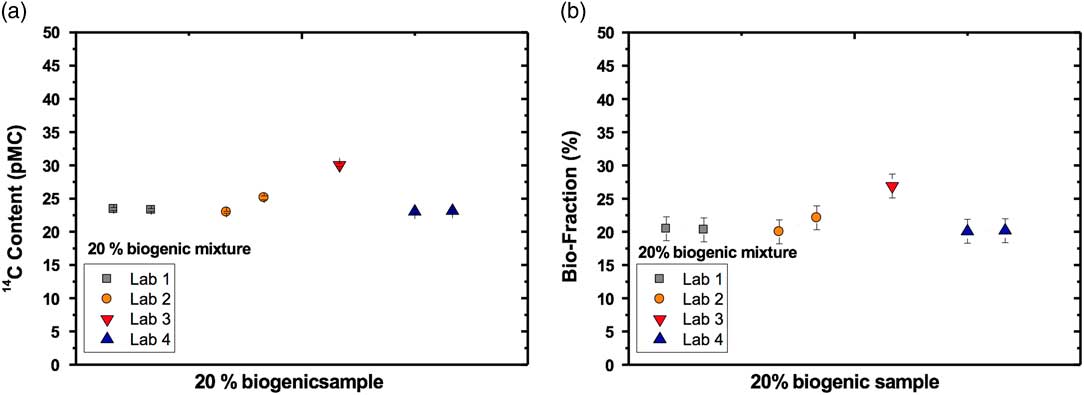
The results obtained for the 20% biogenic mixture are shown in Figure 5. In this case the average 14C concentrations were 23.34±0.11, 24.02±1.5, 30.08±0.1, and 23.08±0.1 pMC. It can be immediately seen that the result obtained for one of the samples taken by laboratory No. 3 is significantly different from the others and it was not considered in the following analysis being probably due to a bad sampling with a possible contamination from modern carbon. The corresponding biogenic concentration were then calculated as 20.4±0.1, 21.0±1.5 and 20.1±0.1 (with an overall average of 20.5±0.5%), all overlapping, within one standard deviation with the expected value of 20.0%.
Measured 14C concentrations (a) and calculated biogenic fractions (b) for the gas mixture containing 20% of bio-derived carbon dioxide. Error bars indicate the 1σ uncertainty associated with the measurement for the radiocarbon concentrations. For the bio-fraction the uncertainty was obtained by error propagation.

CONCLUSIONS
AMS 14C analysis is now a robust and well established method for the determination of the biogenic/fossil fraction in different kinds of products and in particular in carbon dioxide released from industrial stationary sources. The method, based on the large difference in the 14C isotopic content between fossil and biomass-derived material, is simple in its basic principle but presents some issues and drawbacks which had to be properly addressed. Nowadays the method is included in different internationally accepted protocols.
The analysis of synthetic atmospheres, created in a dedicated experimental setup, having composition and thermodynamic conditions emulating those at the stack of real plants gave a contribution to the validation of the methodology. Different scenarios were simulated from pure fossil to pure biogenic gas mixtures. The analysis allowed assessment of the magnitude and the possible sources of contamination and comparison of the results obtained by different laboratories sampling the same gas. When proper calculation procedures were used, the obtained results were fully consistent with the expected ones and confirmed that the accuracy level of 1–2% (absolute) was achieved by the method after two outliers had been removed, at least with the presented experimental setup.