Implications
A large proportion of the world’s cattle are raised under extensive grazing conditions. Very little is known about the methane emissions from these animals, thus making estimates of national inventories subject to error and limiting the ability to benchmark and quantify emissions abatement strategies. This research demonstrates the opportunities and limitations of using a laser-based measurement system for herd-based emissions of methane from cattle under extensive grazing conditions. The data suggest that this technique can be used to obtain reliable measurements of methane emissions under extensive grazing conditions and can have application for national methane inventory development and methane abatement strategies.
Introduction
Grasslands account for ~40% of the global landmass and while a small proportion is dedicated to intensive ruminant production, 80% of grasslands are associated with extensive grazing systems. These are predominantly found in low rainfall areas, both in temperate and tropical regions and often in developing countries (Roxburgh and Pratley, Reference Roxburgh and Pratley2015). Such extensive systems support large numbers of domestic ruminants but are characterised by low stocking rates and low animal productivity (Food and Agriculture Organization of the United Nations, 2006). They contribute a significant proportion of global livestock methane (CH4) emissions (Herrero et al., Reference Herrero, Havlik, Valin, Notenbaert, Rufino, Thornton, Blummel, Weiss, Grace and Obersteiner2013). Holechek (Reference Hristov, Oh, Firkins, Dijkstra, Kebreab, Waghorn, Makkar, Adesogan, Yang, Lee, Gerber, Henderson and Tricarico2013) estimated that global rangelands provide ~70% of ruminant feeds, implying that they contribute at least as much of global ruminant CH4 emission. The savannas and rangelands of Australia are representative of many extensive grasslands around the world and support approximately half the Australian beef herd of 27 million head (Meat and Livestock Australia, 2014). They are characterised by marked seasonal variations in productivity, are dominated by grasses of low nutritive value and support very low stocking densities (Ash et al., 1997; Hunt et al., Reference Hunt, Petty, Cowley, Fisher, Ash and McDonald2007). CH4 emissions from ruminants grazing these regions of Australia have been estimated to account for ~4% of Australia’s greenhouse gas emissions or 23 million tonnes CO2-equivalent/year (Australian Greenhouse Emissions Information System, Reference Ash, McIvor, Mott and Andrew2014). However, few direct measurements have been made in the field. It is desirable to have robust, reliable measurement systems in order to quantify, understand and mitigate CH4 emissions in these extensive grazing environments (Bentley et al., Reference Bentley, Hegarty and Alford2008) but low stocking densities, harsh environmental conditions and remoteness makes measurement difficult. Open-path lasers (OPL) have been used successfully to measure CH4 emissions from feedlots (McGinn et al., Reference McGinn, Chen, Loh, Hill, Beauchemin and Denmead2008; Todd et al., Reference Tomkins, O’Reagain, Swain, Bishop-Hurley and Charmley2014) and small numbers of cattle in relatively small paddocks (several hectares) over short periods of time (Laubach, Reference Laubach2010; McGinn et al., Reference McGinn, Turner, Tomkins, Charmley and Chen2011; Tomkins et al., Reference Todd, Altman, Cole and Waldrip2011). Extensively managed cattle congregate around water or supplementation points for several hours during the hottest part of the day after an initial grazing bout (Tomkins et al., Reference Tomkins, McGinn, Turner and Charmley2009). This behavioural pattern offers the opportunity of collecting CH4 data when animals are densely concentrated and the CH4 flux would be expected to be measurably above background levels. The objective of this work was to quantify CH4 emissions under extensive Australian grazing conditions using an in-field measurement method combining indirect open-path spectroscopy with a micrometeorological model.
Material and methods
The experimental protocol complied with the Australian Code of Practice for the care and use of Animals for Scientific Purposes (National Health and Medical Research Council, 2004) and was approved by the organisational Animal Experimentation and Ethics Committee (RH259/09 and A4/2010).
Research sites, animals and dates of study
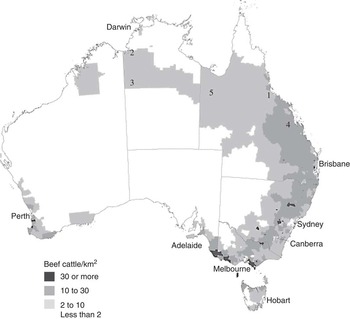
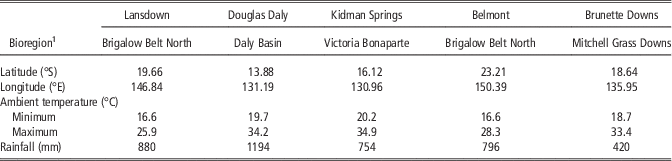
Five research sites were selected and measurements made over a 3-year period from 2010 to 2012 (Figure 1, Table 1). The sites were chosen so as to be representative of the dominant beef grazing areas of northern Australia and reflect a range of stocking densities and bioregions (Interim Biogeographic Regionalisation for Australia, 2012).
Map of Australia showing approximate locations where measurements were taken and cattle density in 2001 (Australian Bureau of Statistics, 2005).1 Lansdown Research Station; 2 Douglas Daly Research Station; 3 Kidman Springs Research Station; 4 Belmont Research Station; 5 Brunette Downs.

Geographical location of the study sites and their mean (100 year average) annual climate conditions

1 Interim Biogeographic Regionalisation for Australia, version 7 (2012).
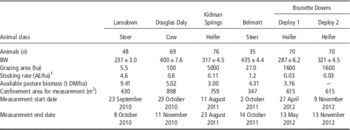
Descriptions of the cattle, grazing conditions and timing of measurements are given in Table 2. Cattle at all sites were weighed before and after the CH4 measurements and a mean BW used to estimate stocking density and CH4 emissions as g/kg BW. Pasture biomass and botanical composition was estimated using a modification of the ‘Botanal’ method described by Tothill et al. (Reference Tothill, Hargreaves, Jones and McDonald1992).
Description of the study areas, animals and pastures used in the research

1 AE (adult equivalent)=450 kg steer.
The CSIRO Lansdown Research Station near Townsville in north Queensland represented the Northern Brigalow Belt bioregion. This first study was designed to test the method under controlled conditions. CH4 emissions were measured in beef steers; 15 Brahman (Bos indicus) and 33 Belmont Red (Bos taurus×African Sanga), continuously grazing a 5.5 ha established mixed sward of (~67%) sabi grass (Urochloa mosambiensis), (~18%) Siratro sp., (~10%) Stylosanthes sp. with some blue pea (Clitoria turnatea) and green panic (Panicum maximum). CH4 measurements were made in the mid to late dry season (September to October) 2010. Following this deployment, laser CH4 measurements were conducted under extensive grazing conditions at the Northern Territory Government Department of Resources Douglas Daly Research Farm in the Daly Basin in October to November during the late dry season. CH4 emissions were recorded in Brahman and Brahman cross cows grazing a 100 ha pasture containing (~48%) buffel grass (Cenchrus ciliaris), (~35%) sabi grass (U. mosambiensis) and (~14%) wynn cassia (Chamaecrista rotundifolia).
Two studies were conducted in the dry season (August and October) of 2011. The first of these at the Kidman Springs Research Station in the Northern Territory, represented the Victoria Bonaparte bioregion. This region has a hot, seasonally dry monsoonal climate, with most rain falling between December and March. Measurements were taken from Brahman×Senepol cross heifers, continuously grazing a 5000 ha native pasture consisting of open woodland of Bauhinia sp. with an understorey of native couch (Brachyachne convergens), golden beardgrass (Chrysopogon fallax) and occasional mitchell grass (Astrebla sp.) patches. In October 2011, measurements were conducted at the Belmont Research Station near Rockhampton in coastal central Queensland. This land type represented the southernmost extent of the Northern Brigalow Belt bioregion noted for superior pasture and livestock performance compared with other bioregions in the north. Measurements were conducted on a herd of 35 Brahman steers (mean±SEM BW of 435±4.4 kg) continuously grazing a 27 ha established mixed sward. The sward consisted of (~18%) Rhodes grass (Chloris gayana), (~16%) sabi grass and (~15%) Bothriochloa sp. with some Black speargrass (Heteropogon contortus) and (<15%) introduced tropical grasses.
In 2012, two deployments were conducted on the Australian Agricultural Company Ltd (AACo) property, Brunette Downs in April (early dry season) and October (late dry season). This property was selected to represent the Mitchell Grass Downs bioregion typified by open rolling grasslands. On both occasions CH4 emissions were measured using the same herd of AACo Composite heifers (Senepol×Charolais×Santa Gertrudis), continuously grazing an unimproved pasture (1600 ha) dominated by hoop michell grass (Astrebla elymoides) and barley mitchell grass (Acianthera pectinata) with some Flinders grass (Iseilema sp.). On both occasions animals grazed the same paddock and samples of available pasture were collected along three transects radiating from the water point.
CH4 measurements
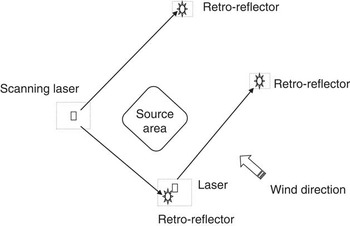
Under extensive grazing situations, cattle are dispersed widely across large areas, conditions unsuited to laser measurements. However, observational data has shown that cattle congregate in groups around water points during the daytime. We exploited this behaviour by confining cattle in defined areas around water points to facilitate measurements using the backward Lagrangian stochastic (BLS) dispersion model (Flesch et al., Reference Flesch, Wilson, Harper and Crenna2004 and 2005). In these studies it was assumed that the area represented a uniform source of CH4 (Figure 2).
Schematic diagram of laser deployment. Dashed boxes represent fenced off areas for protection of equipment.

The methods employed were based on those developed in earlier studies by Tomkins et al. (Reference Todd, Altman, Cole and Waldrip2011) and McGinn et al. (Reference McGinn, Turner, Tomkins, Charmley and Chen2011). CH4 concentration from each group of cattle at each of the field sites were measured by OPL (GasFinder 2.0; Boreal Laser Inc., Spruce Grove, Alberta, Canada) for 6 to 7 h/day for up to 16 days (Figure 2). Following morning grazing animals were confined to an area (Table 3), established around the only water point in the study paddock. This confinement assumes a uniform distribution of animals within the area and surface-source assumptions were used in a BLS dispersion model to derive CH4 flux (McGinn et al., Reference McGinn, Flesch, Coates, Charmley, Chen, Bai and Bishop-Hurley2015). The surrounding area at each site was flat and considered to present no major impediments to wind characteristics.
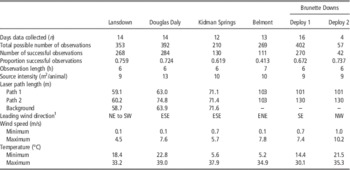
Description of the open-path laser characteristics used at six study areas in northern Australia

1 NE=north-east, SW=south-west, ESE=east-south-east, ENE=east-north-east, SE=south-east, NW=north-west.
In five of the six campaigns, two OPL were used to measure line-averaged CH4 mixing ratio for each path; one set upwind to measure the background CH4 mixing ratio and another mounted on a motorised scanner measured line-averaged CH4 mixing ratios from the source area along two perpendicular paths. The physical arrangement of equipment at each site was determined by historical meteorological data for wind direction to ensure that paths were predominantly measuring background or enhanced CH4 flux relative to each source area. Retro reflectors were used to terminate each laser path with lengths ranging from 59 to 144 m (Table 3). Path lengths unique to each measurement campaign were used in BLS modelling to estimate herd-scale emission values. For the Belmont campaign in October 2011, only one OPL was available. This laser was mounted on a scanner and measured line averaged background CH4 mixing ratio and CH4 mixing ratios from the source area along two paths ±19.2° relative to a centre line between the scanner and centre of the source area.
Before each campaign, in the absence of animals, continuous line averaged concentration data was collected for each OPL along parallel paths for cross-calibration purposes. This allowed for direct calibration between the two sensors and generated a correction factor which was applied to data collected for each independent measurement period. This protocol developed multipliers for each measurement campaign to force the line averaged concentration of multiple laser paths to match that of the standalone laser used at that time. In principle this is a good approach as it eliminates systematic measurement errors due to errors in the measured laser path lengths, the possibility of errors due to different laser signal levels on the different paths and reflector differences (Flesch, T.K., personal communication). Harper et al. (Reference Harper, Flesch, Weaver and Wilson2010) includes an appendix tabulating several WindTrax verification studies and indicates that the period-to-period relative uncertainty in a WindTrax calculation is 0.20 (given by the standard deviation of the fractional uncertainty in the various experimental datasets). Therefore, given the commonalities in the open-path methodology we assume a similar relative uncertainty; δK/K=0.20. Recording interval for line-averaged CH4 mixing ratio (ppm) for all paths was every second for 60 s. CH4 mixing ratios from each OPL for each campaign was averaged over 10-min periods. Laser return light levels were also checked throughout each campaign to ensure values between 3000 and 11 000 (no units). This range is recommended by the manufacturer and associated CH4 concentration readings can be considered reliable.
At each site a micrometeorological tower was located upwind and adjacent to each source area (Figure 2). The tower was fitted with a three-dimensional sonic anemometer (CSAT3; Campbell Scientific Inc., Logan, UT, USA) mounted at a height of 2.4 m which sampled wind components at 10 Hz. A barometric pressure sensor (CS106, PTB 110; Campbell Scientific Inc.), temperature humidity sensor (HMP45C; Campbell Scientific Inc.), and a 3-cup anemometer and wind vane mounted on a small cross arm (03002-L; Campbell Scientific Inc.) were also mounted on the tower. Micrometeorological data including wind speed, direction and wind component variance were recorded at 10 Hz, averaged over 10 min intervals using a data logger (CR1000; Campbell Scientific Inc.) and all records were extracted daily onto a laptop computer.
Data processing
Laser, sonic anemometer and micrometeorological data were merged and managed with SAS (1999) statistical software as described by Tomkins et al. (Reference Todd, Altman, Cole and Waldrip2011) before using BLS modelling in WindTrax (WindTrax dispersion model V.2.0.8.3; Thunder Beach Scientific, Halifax, NS, Canada). The location, by GPS, of source boundaries and sensors is also required in this model to provide relative spatial orientation of the source area to individual sensors and measurement paths so that assumptions based on wind direction can be validated. In addition, unique to each site is the use of an offset value in cardinal degrees relative to true north (0 to 360°) which is applied to sonic anemometer data. The filtering criteria used throughout the studies for pre- and post-simulation (using WindTrax) were similar to that described by Flesch et al. (Reference Flesch, Wilson, Harper, Crenna and Sharpe2007) and McGinn et al. (Reference McGinn, Beauchemin and Flesch2009) and included; 3000<light level<11 000, surface roughness (Z; m) 0.0000001<Z 0<0.9, atmospheric stability (L; m), absolute <2, friction velocity (u*; m/s) >0.15 m/s, where <0.15 indicates calm conditions and unsteady wind directions, and fraction covered by touchdown >10% with ∆CH4>10 ppb. In addition, if the wind direction relative to either path varied by >15° then these data was considered unreliable and excluded from modelling. The CH4 mixing ratio for each path was converted to an absolute concentration based on air pressure and temperature. Individual 10 min data points were plotted against time for each site. Mean individual animal (within a herd) CH4 emission were then calculated (g/day) for each study site based on the total number of 10 min average data that satisfied the filtering criteria as described and the number of animals confined in that source area.
Results and discussion
Across all sites the mean CH4 emission rate was 190±12.3 g/day. This value was based on 1182 measurements over 73 days across six separate deployment campaigns across northern Australia. It was planned that measurements would begin and end at the same time of day on consecutive days within any particular deployment. However, start and end times did vary and on some days no measurements were taken due to operational limitations (Table 3). Based on operational measurement periods there were 1794 theoretical observations, however, only 66% of these observation points resulted in useable data. This was attributed to data filtering for OPL light level, low wind speed, inappropriate wind direction and turbulence and equipment malfunction. Data were also removed from the analysis if the value was negative or >2 SD from the mean. Nevertheless a 66% success rate is considered acceptable and higher than those recorded by McGinn et al. (Reference McGinn, Turner, Tomkins, Charmley and Chen2011) of 34% and McGinn et al. (Reference McGinn, Flesch, Coates, Charmley, Chen, Bai and Bishop-Hurley2015) of 40% under similar northern Australian field conditions. This discrepancy may have been related to the basis for calculating operational measurement periods which inadvertently removed some failed measurement periods; the operational measurement period on each day commenced and ended with the first and last successful measurement observation.
CH4 emissions at the herd scale for cattle grazing extensive pastures typical of northern Australia have been estimated using OPL and an inverse-dispersion technique as described by Laubach. (Reference Laubach2010) and McGinn et al. (Reference McGinn, Flesch, Coates, Charmley, Chen, Bai and Bishop-Hurley2015). In brief, line averaged concentration of CH4 is recorded by a number of sensors relative to a source area at each site. Micrometeorological data is also collected at each site and provides wind statistics that are used in a BLS model (WindTrax). Simulation of up to 50 000 particles in the BLS model using local wind statistics and line averaged concentrations with a temporal resolution of 10 min generates an estimated CH4 plume relative to each measurement path and the source area. The footprint of this plume over the source area provides a degree of confidence in the model’s ability to define the source and concentration of emitted CH4. However, not all measurement periods allow for good calculations and filtering criteria are routinely used to eliminate periods in which: (1) the concentration measurements are believed to be inaccurate or unrepresentative; and (2) when WindTrax dispersion calculations are potentially inaccurate. Laser-based criteria are applied to remove potentially inaccurate or unrepresentative line averaged concentration values, especially when observations correspond to <5 min of a 10-min period, R 2 min (a measure of observed concentration relative to internal cell reference) is <98, and/or when reported light levels (an operating, unitless parameter related to the signal level of the returning laser beam) falls outside an operating range; 3000 to 11000. Criteria applied to the BLS output, intended to remove error-prone periods, have been applied in previous studies and are based on low wind speed periods (Flesch et al., Reference Flesch, Wilson, Harper, Todd and Cole2014), periods of extreme atmospheric stratification (Flesch et al., Reference Flesch, Wilson, Harper and Crenna2004), where actual wind conditions violate WindTrax assumptions, and/or when the fractional coverage (footprint) of the downwind OPL measurement relative to the source area is marginal (Flesch et al., Reference Flesch, Wilson, Harper, Crenna and Sharpe2007). The application of the criteria removes outliers in the emission dataset (WindTrax output) unique to location and conditions during measurement periods.
Mean CH4 emissions
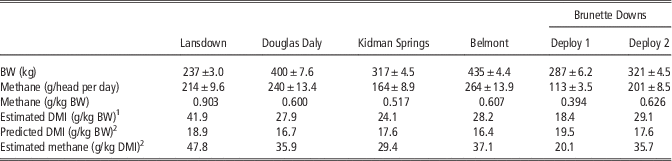
Table 4 summarises the CH4 emission estimates for the six deployment campaigns. Except for the Lansdown site, CH4 emissions expressed on a BW basis varied between 0.39 and 0.63 g/kg BW, which is in agreement with emission values previously reported using similar methodology (Tomkins et al., Reference Todd, Altman, Cole and Waldrip2011). The mean emission value for the Lansdown site was 0.90 g/kg BW, which is outside the expected range. Kennedy and Charmley (Reference Kennedy and Charmley2012) measured CH4 emissions from a range of tropical forages using open circuit CH4 chambers and obtained a linear relationship between CH4 production and dry matter intake (DMI). The relationship of 19.7 g/kg DMI can be used to estimate DMI according to the equation,
 $${\rm DMI}{\,=\,}({\rm methane\ emission}/{\rm 19}.{\rm 7})/({\rm BW}/{\rm 1}000)$$
where DMI is in g/kg BW and CH4 emission is in g/head per day. These values were then compared with predicted DMI using the equation of Minson and McDonald (Reference Minson and McDonald1987);
 $${{\rm DMI}{\,=\,}({\rm 1}.{\rm 185}{\plus}0.00{\rm 454BW}-0.00000{\rm 26BW}^{{\rm 2}} {\plus}0.{\rm 315BWG})^{{\rm 2}} $$
where BWG is BW gain in kg/head per day. For all deployments excluding Lansdown, the calculated DMI using the assumed CH4 yield (19.7 g/kg DMI) was in the range 18 to 29 g/kg BW (Table 4); 44% higher than expected, relative to the predicted DMI (Minson and Mcdonald, Reference Minson and McDonald1987) of 18 g/kg BW. It is apparent that the calculated DMI for the Lansdown site is approximately double what might be expected, indicating a large overestimation of CH4 emissions at this site. Confirmation that the Lansdown measurements overestimated emissions is provided by McGinn et al. (Reference McGinn, Flesch, Coates, Charmley, Chen, Bai and Bishop-Hurley2015) who conducted a separate study at Lansdown using similar animals and paddocks. In that study CH4 emission averaged 250 g/day for cattle weighing 425 kg, which equates to 0.59 g CH4/kg BW. Given the relatively similar precision observed for the Lansdown data (SE=11 v 4 to 14 for other deployments), we conclude that the poor accuracy was attributed to some unidentified, yet consistent error in the measurement or calculation of emissions.
Mean (±SD) animal BW, methane emissions and estimated and predicted feed intake by cattle at five measurement sites in northern Australia

DMI=dry matter intake.
1 DMI estimated using a methane yield of 19.7 g/kg DMI (Kennedy and Charmley, Reference Kennedy and Charmley2012).
2 DMI predicted according to the equation of Minson and McDonald (Reference Minson and McDonald1987).
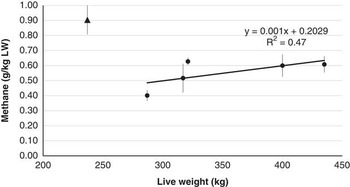
Growing cattle including steers and heifers were used for all deployments except Douglas Daly where mature cows were used. The mean BW of cattle across six deployments ranged from 237 to 435 kg, thus closely covering the BW range of cattle from post-weaning to maturity under extensive Australian conditions. When the Lansdown data were removed from the analysis, BW accounted for 47% of the variation in emissions per kg BW with a trend towards higher emissions in larger cattle (Figure 3). Even though Lansdown cattle were the lightest, their emissions per kg BW were contrary to the trend for other cattle, further casting doubt on the veracity of the Lansdown data. There was no discernible effect of sex, physiological state or breed on CH4 emissions, although these studies were not designed explicitly to study these effects.
The relationship between BW of cattle and their methane emission (g/kg BW). The black triangle is the Lansdown data, black circles represent data from the other deployments.

Extensive grazing implies a dispersed emission of CH4 from cattle over a large area. Under these conditions the CH4 signal strength is too low for accurate estimation of emissions using current OPL technology. Use of tracer gases can be of value under these situations and have been used in open path-Fournier transformed infra-red (OP-FTIR) laser measurements (Phillips et al., Reference Phillips, McPhee, Hegarty and Naylor2013) but are impractical. On-animal tracer release devices can become dislodged and need regular servicing, the OP-FTIR requires a 240 V power source, the equipment is bulky and prone to damage in transit. As an alternative, we measured CH4 emissions at a herd scale during a time of day when free-ranging cattle tend to congregate around an attractant, usually water (Tomkins et al., Reference Tomkins, McGinn, Turner and Charmley2009). It is well known that there are diurnal variations in CH4 emissions, with peaks in CH4 output following grazing bouts (Tomkins et al., Reference Todd, Altman, Cole and Waldrip2011; McGinn et al., Reference McGinn, Flesch, Coates, Charmley, Chen, Bai and Bishop-Hurley2015). Behavioural observations on cattle grazing under northern Australian conditions have demonstrated a crepuscular grazing pattern with a rest period during the hottest part of the day (Tomkins et al., Reference Tomkins, McGinn, Turner and Charmley2009). Thus, constraining cattle around a water point following morning grazing was considered to have the least impact on typical grazing behaviour. However, it was also expected that the measurement period would coincide with a peak in hourly emissions. Several reports where the OPL technique has been used to measure emissions over 24 h have demonstrated that emissions are 12% to 14% higher between 0800 and 1600 h compared with the rest of the 24-h period (McGinn et al., Reference McGinn, Turner, Tomkins, Charmley and Chen2011 and Reference McGinn, Flesch, Coates, Charmley, Chen, Bai and Bishop-Hurley2015; Tomkins et al., Reference Todd, Altman, Cole and Waldrip2011). Consequently, it can be assumed that the observed values in the current studies would be ~8% greater than the daily mean.
As noted earlier (Table 4) we concluded that our measured emissions over 5 to 7 h during the day appeared to be somewhat higher than expected when they were used to estimate DMI. By adjusting for the 8% diel effect, the average emissions across all six deployments inferred a DMI of ~25 g/kg BW (excluding Lansdown data).
CH4 emissions variability within the day
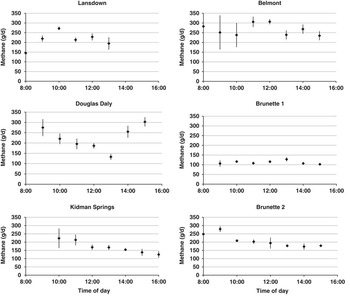
Figure 4 shows the mean hourly emission (multiplied by 24 to present a daily emission rate) for each site during the measurement period (~0800 to 1600 h). There was considerable variation in the hourly mean values within sites. For three of the deployments there was an ~50 g/day range in emissions due to sampling time (Lansdown, Belmont and the first Brunette Downs deployment). For those sites where the hourly range in emissions was high, being 100 to 150 g/day, this was generally attributed to emissions taken during the first 2 h of measurement being considerably higher than emissions taken later in the day. Several factors could have contributed to higher values in the early morning. These include generally lower wind speeds and therefore lower atmospheric stability or a requirement for the OPL to achieve a recommended operating temperature after having been turned off overnight to conserve battery power (McGinn S.M., personal communication). As standard practice OPL were powered up for 2 h before actual measurements but this was not always possible particularly at the more remote sites of Kidman Springs and Brunette Downs. Hourly variation in emissions are typical of data collected using OPL techniques. The method itself contributes to this as data filtering contributes to random missing values, thus influencing hourly mean values for each day. Using similar filtering methods to those employed in our study McGinn et al. (Reference McGinn, Flesch, Coates, Charmley, Chen, Bai and Bishop-Hurley2015) recorded 53% useable data, but the variation in useable data across their treatments ranged from a low of 19% to a maximum of 72% useable values.
Mean (±SE) hourly methane emissions during the measurement period for the six field campaigns.

CH4 emissions are related to feeding bouts, with CH4 peaks typically occurring within 2 h of feeding. Since cattle grazing extensive pastures in the tropics typically have major grazing bouts around dawn and dusk (Tomkins et al., Reference Tomkins, McGinn, Turner and Charmley2009) a post-prandial peak in CH4 emissions is sometimes observed in OPL experiments. Tomkins et al. (Reference Todd, Altman, Cole and Waldrip2011) observed a significant peak between 1000 and 1700 h using OPL when cattle grazed a Rhodes grass pasture, but this peak was not apparent when the same pasture was cut and carried and fed in open circuit CH4 chambers. McGinn et al. (Reference McGinn, Flesch, Coates, Charmley, Chen, Bai and Bishop-Hurley2015) observed a similar but much less pronounced pattern of CH4 emissions. In the current deployments it was not possible to identify the expected post-prandial peak in emissions as observed by Tomkins et al. (Reference Todd, Altman, Cole and Waldrip2011) and McGinn et al. (Reference McGinn, Flesch, Coates, Charmley, Chen, Bai and Bishop-Hurley2015). Such peaks could be difficult to discern without the pre-prandial data for comparison. Patterns in emissions over the 7 to 8 h observation periods were variable and did not adhere to any biologically sensible relationship. These data, however, stress the importance of a suitably long sampling period over many days and at relatively high frequency. Increasing the number of observations reduces the importance of any single data point. While any individual data point will be subject to a range of events affecting the actual reading, by collecting many readings over the day or several days, we believe this method gives an accurate representation of the true emissions over time.
CH4 emissions variability across deployments
As has been noted already, data obtained from the deployment on Lansdown Research Station was outside the expected range and are not considered in this section. Among the five successful deployments CH4 emissions varied between 0.4 and 0.6 g/kg BW. Field-based measurements from grazing livestock using either SF6 or a range of laser-based techniques corroborate our results. Boland et al. (Reference Boland, Quinlan, Pierce, Lynch, Kenny, Kelly and Purcell2013) using the SF6 tracer gas technique recorded CH4 emissions from dairy heifers grazing good quality temperate pastures of 0.35 to 0.4 g/kg BW. Similarly, Chaves et al. (Reference Chaves, Thompson, Iwaasa, Scott, Olson, Benchaar, Veira and McAllister2006) observed values of between 0.3 and 0.45 g/kg BW for grazing heifers in the Canadian prairies, while data from the United Kingdom for perennial ryegrass indicated higher emissions of 0.59 g/kg BW (Hammond et al., Reference Hammond, Humphries, Westbury, Thompson and Crompton2014). Data collected under tropical conditions using the OPL range between 0.52 and 0.56 g/kg BW (McGinn et al., Reference McGinn, Turner, Tomkins, Charmley and Chen2011; Tomkins et al., Reference Todd, Altman, Cole and Waldrip2011; McGinn et al., Reference McGinn, Flesch, Coates, Charmley, Chen, Bai and Bishop-Hurley2015).
This study was designed to obtain data from the major beef regions of northern Australia and the sites cover a wide diversity of soil, climate, management and livestock types. The variability in emissions across sites cannot be meaningfully ascribed to any particular site-specific variable but do suggest that across a wide range of conditions, CH4 emissions are relatively consistent, particularly when compared with the variability in emissions from much more controlled experimental designs (Hammond et al., Reference Hammond, Humphries, Westbury, Thompson and Crompton2014; McGinn et al., Reference McGinn, Flesch, Coates, Charmley, Chen, Bai and Bishop-Hurley2015). However, Figure 3 suggests that there was a tendency for emissions per unit BW to increase as BW increased.
It is widely published that there is a relationship between diet digestibility and CH4 emissions with emissions per unit intake decreasing with increasing diet digestibility (e.g. Benchaar et al., Reference Benchaar, Pomar and Chiquette2001; Yan et al., Reference Yan, Porter and Mayne2009; Hristov et al., Reference Holechek2013). However, DMI increases with increasing diet quality so the effect of diet quality on daily emissions is variable, depending on the magnitude of decreasing emissions (g/kg DMI) and increasing intake as diet quality increases. In the current study, pasture composition was recorded, but not actual diet quality due to the heterogeneous nature of the pastures. However, five of the six deployments occurred in the mid to late dry season of northern Australia. At this time of year forage quality is consistently poor with OM digestibility values between 0.45 to 0.55 and CP content <80 g/kg DM (Ash et al., 1997); conditions conducive to high emissions relative to intake. At Brunette Downs, there were two deployments with the same cattle at the beginning and end of the dry season and a contrast in diet quality was to be expected. CH4 emissions were higher at the end of the dry season, a finding that is consistent with the expected poorer diet quality. However, caution should be exercised in linking diet quality to daily emissions when DMI is not known.
The direct measurement of enteric CH4 emissions from livestock under extensive grazing systems is challenging. This paper demonstrates that the OPL technique is a satisfactory option, when employed on aggregations of grazing cattle for 7 to 8 h a day over 7 to 14 days. Logistical constraints limited the number of deployments, thus it was difficult to draw conclusions regarding factors that influenced the variation in emissions across deployments of between 0.4 and 0.63 g/kg BW (excluding data from one site). Effects of diet quality and BW of cattle may have been contributing factors but cannot be confirmed. The data presented in this paper are within the expected range for emissions from grazing cattle and suggest that this method is a viable option for directly measuring CH4 emissions from cattle at the herd scale in extensive grazing conditions.
Acknowledgements
This work was part of the Reducing Emissions from Livestock Research Program supported by funding from Meat & Livestock Australia and from the Australian Government under its Climate Change Research Program. The generous support of managers and staff on collaborating cattle stations (Brunette Downs), state and commonwealth research stations (Belmont Research Station, Kidman Springs, Douglas Daly, Lansdown) is gratefully acknowledged. Expert technical assistance was provided by Sharon McGavin, Mei Bai, Chris O’Neill, Debra Turner and Jenny Stanford. Dr Tom Flesch, University of Alberta was supported by a McMasters visiting fellowship during the revision of the manuscript and provided significant advice and interpretation regarding data analysis and backward Lagrangian stochastic modelling.