INTRODUCTION
Rice (Oryza sativa) and wheat (Triticum aestivum) grown sequentially in an annual rotation constitute a rice-wheat cropping system (RWCS). The two cereals are the staple food crops and the system occupies nearly 13.5 million ha in the Indo-Gangetic plains (IGP) of South Asia. The RWCS is primarily irrigated, and 85% of the system is concentrated in the IGP, encompassing Northern India, Pakistan, Nepal and Bangladesh (Timsina and Connor, Reference Timsina and Connor2001). During 1960–1990, genetic improvements leading to development of highly fertilizer-responsive rice and wheat varieties, coupled with improved management strategies, resulted in a dramatic rise in productivity and production from the RWCS (Bijay-Singh et al., Reference Bijay-Singh, Yadvinder-Singh, Nayyar, Yadvinder-Singh, Bijay-Singh, Nayyar and Singh2003a). The gains were particularly significant in the northwestern region of India covered by the states of Punjab, Haryana and western Uttar Pradesh, although, of late, growth rates have slowed. The visible problems in the RWCS that require immediate attention are decreasing inherent fertility of the soil, depletion of the water table and increasing biotic stresses.
Intensive cultivation of rice and wheat crops, use of imbalanced and inadequate fertilizers, accompanied by restricted use of organic manures and biofertilizers, have made the soils deficient in nutrients. In addition, the soil health has deteriorated, resulting in declines in crop response to the recommended dose of nitrogen (N) fertilizer. A RWCS that yields 7 t ha−1 of rice and 5 t ha−1 of wheat removes more than 300 kg N, 30 kg phosphorus (P), and 300 kg ha−1 potassium (K) from the soil (Bijay-Singh et al., Reference Bijay-Singh, Yadvinder-Singh, Nayyar, Yadvinder-Singh, Bijay-Singh, Nayyar and Singh2003a). Non judicious enhancement and its bias in favour of N-fertilization further worsen the situation (Singh et al., Reference Singh, Kumar and Pal2008). Indiscriminate use of high analysis chemical fertilizers results in deficiency of nutrients other than the ones applied and causes decline in the organic carbon content (Singh et al., Reference Singh, Sachan, Pandey and Bisht1999). Decreasing soil fertility has been reported as one of the major reason for decline in yields (Sheoran, Reference Sheoran2003). Removal of P and K by the RWCS far exceeds their additions through fertilizers and recycling of organic sources.
Fertilizer use pattern for the RWCS in the IGP varies greatly from one part to another. Diagnostic surveys (Yadav et al., Reference Yadav, Singh, Prasad, Dwivedi, Batta, Singh, Patil, Chaudhary, Yadav and Singh2000) have indicated that farmers are using very high doses of N (130–195 kg N ha−1) for non-basmati rice in Punjab, Haryana and western Uttar Pradesh. Application of 25–32 kg P2O5 ha−1 is common in these areas, but K fertilization is limited. In wheat, use of 95–200 (average 153) kg N ha−1 and 30–55 (average 40) kg P2O5 ha−1 is common throughout the RWCS in South Asia. The need to apply micronutrient fertilizers to soils of the IGP was first felt with the appearance of zinc (Zn) deficiency in rice and wheat (Nayyar et al., Reference Nayyar, Chhibba, Bansal, Yadvinder-Singh, Bijay-Singh, Nayyar and Singh2003). Recommended fertilizers are rarely used by the RWCS farmers in the IGP.
Improving nutrient management supplements and complements the breeding efforts for high yield. Nutrient management implies managing all nutrient sources in such a way that yield is not knowingly jeopardized whilst every effort is made to minimize losses of nutrients to the environment (Yadvinder-Singh and Bijay-Singh, Reference Yadvinder-Singh, Bijay-Singh, Yadvinder-Singh, Bijay-Singh, Nayyar and Singh2003b). Organic manures, particularly farmyard manure, not only supply macronutrients but also meet the requirement for micronutrients, besides improving soil health (Singh et al., Reference Singh, Kumar and Pal2008). The RWCS in the IGP often experiences low N use efficiency due to inefficient management of fertilizer N (Alam et al., Reference Alam, Ladha, Foyjunnessa, Rahman, Khan, Harun-ur-Rashid, Khan and Buresh2006).
The recommendations regarding nutrient application in rice and wheat crops for Haryana were given long ago, and most of the farmers are not aware of fertilizer recommendations and are happy with their present nutrient management practices, which are traditional and location specific. Also the farmers have increased the fertilizer dose during the past decade because of the role of fertilizers in the maintenance of soil health, yield advantage and improvement in economic conditions (Sheoran, Reference Sheoran2003). Now the scenario is different as many changes have occurred in, for example, varietal basket, management options, yield realization, crop residue management (such as zero tillage), use of organic manures, soil status due to imbalanced use of fertilizers, micro-nutrient deficiencies and economic status of farmers. As a result, the farmers themselves are adjusting their nutrient management practices on the basis of their experiences rather than soil-test-based recommendations, but scientific revision of recommendations is yet to come.
The present paper evaluates the results from an empirical farm survey of on-farm nutrient management practices in the irrigated RWCS in Haryana, India, so as to serve as the basis for evaluating and correcting the existing recommendations while keeping in view the practices being followed by the farmers in the region.
METHODOLOGY
Study area
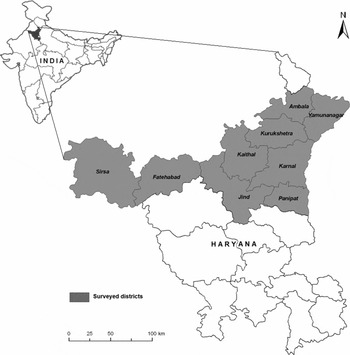
The study domain is the irrigated rice-wheat zone in Haryana State, India, located in the Trans-Gangetic Plains, the northwestern part of the IGP. The surveyed districts are depicted in Figure 1, highlighting the concentration of the surveyed districts in the northern part of the state. The semi-arid climate is continental monsoonal, with some 80% of the total precipitation during the monsoon season from June to September. Wheat is grown in the winter with cold and dry weather during November to April (rabi season), whereas rice is grown during the warm, humid or semi-humid monsoon season from June to October (kharif season) (Timsina and Connor, Reference Timsina and Connor2001). The study area is served by a well-developed canal irrigation system, although groundwater now provides the major share of total farm water supply, compensating for the generally inadequate volume, frequency and timing of canal water in the IGP (Erenstein et al., Reference Erenstein, Farooq, Malik and Sharif2008). The rice and wheat crops are dependent on irrigation, both through surface and groundwater, and flooding is the only method of water management in both crops. The soils in the study area are predominately alluvial, calcareous, very low in organic carbon and weakly structured, with light to medium texture (sandy loam to clay loam). Rice is predominantly grown by transplanting after puddling, while wheat is sown by seed drill after preparatory tillage as well as under no-till conditions.
Survey locations.

The RWCS in the study area is highly mechanized, input-intensive and commercial, and farm holdings are relatively large, particularly when compared to the Eastern IGP. Another distinguishing feature of the study area within the IGP is the popularity of basmati rice, an aromatic, fine-quality rice which takes longer to mature (Timsina and Connor, Reference Timsina and Connor2001). Wheat has traditionally been, and continues to be, the mainstay of food security in the northwestern IGP, and the introduction and widespread cultivation of rice only occurred in recent decades. The introduction of rice has, thereby, increased the use of fertilizers for the RWCS as a whole. Due to intensive cropping and well-developed irrigation facilities, fertilizer (NPK) use in the Trans Gangetic Plains is the highest in the country (211.6 kg ha−1 in Punjab and 178.5 kg ha−1 in Haryana against an all-India average of 115.5 kg ha−1 during 2006/07).
Data sources
The study mainly interprets the details of nutrient management practices of the RWCS. The study area covering nine districts in Haryana (Figure 1) was chosen as it predominantly represents the RWCS (Erenstein et al., Reference Erenstein, Farooq, Malik and Sharif2008). The primary data source for this study was a formal roadmap survey of rice-wheat growers from the rice-wheat zone of Haryana State. The survey used a stratified sampling frame.
Each selected district was visited twice (separately for rice and wheat) during 2006/07 using a predetermined route and three to five farmers were surveyed randomly after every 8–10 km to collect information using a structured questionnaire. The questionnaire covered the details of total area, area under rice/wheat, nutrient management practices (type, source, dose, and method and time of application) and grain yield for both rice (June–October 2006) and wheat (November 2006–April 2007) of individual farmers. The survey yields are farmer-reported yields. Overall, the survey covered 319 rice-growing farmers, including farmers growing one or more type of rice, i.e. superfine (229), evolved basmati (187) and traditional basmati (52), thus making total sample sizes of 468 for rice and 576 wheat growing farmers.
Analytical methods
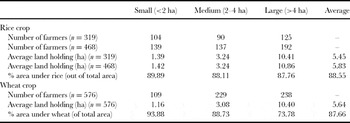
For the subsequent analysis and reporting, the surveyed farmers were classified into small (with land holding up to 2 ha), medium (2–4 ha) and large (>4 ha) based on their land holding size. Amongst the 468 farmers in the survey, 139 were classified as small, 137 as medium and 192 as large for rice crop (however, for organic manure use, out of 319 farmers, 104 were classified as small, 90 as medium and 125 as large); for wheat the corresponding figures were 109, 229 and 238, respectively out of 576 farmers (Table 1). The average land holding size for surveyed rice and wheat growers was 5.45 and 5.83 ha, respectively. This is relatively high compared to the average farm size in Haryana state (2.3 ha), but is consistent with the average reported for rice-wheat systems in Punjab and Haryana (Sharma et al., Reference Sharma, Rao, Murari and Sharma2004).
Sample distribution, average land holding and area under rice and wheat crops across land holding categories.

Out of the total area, the major portion was under rice (88.55%) and wheat (87.66%) during the respective crop seasons (Table 1). Rice and wheat provide the bulk of the farm income, on average an 85% share in the rice-wheat zone of irrigated Haryana (Erenstein et al., Reference Erenstein, Malik and Singh2007). We hypothesized that there are a number of differences between the three land holding size categories, and that these may help explain the observed nutrient management practices. The groups were sufficiently large to allow for statistical comparisons between land holding categories at the farmer level. For the farmer level analysis, tables therefore typically included the averages for each category as well as the overall sample, indicating statistically significant differences between land holding categories where relevant.
Since the N recommendation for different rice types is variable, the rice growing farmers were further divided into three groups: superfine, evolved basmati and traditional basmati growers. The N management practices and grain yield for these three types of rice were separately analysed irrespective of land holding size. When the farmers applied diammonium phosphate [(NH4)2HPO4 – 46% P2O5 and 18% N] or other NPK complex fertilizers as a source of P and/or K, N was also applied and the quantity of N thus applied was also taken into account while calculating the total N applied to the crops. However, this dose of N applied through diammonium phosphate (DAP) or NPK fertilizer was not taken into account while analysing the method and number of splits of N application, and only the N dose applied through straight nitrogenous fertilizers was taken into account. The significance (p = 0.05) between land holding categories or rice groups was calculated using the appropriate statistical tests (e.g. Chi2, ANOVA with post-hoc test) using SPSS statistical software. Unless otherwise stated, the sample size is 468 (319 for organic manure) for rice and 576 for wheat.
RESULTS AND DISCUSSION
Organic manures
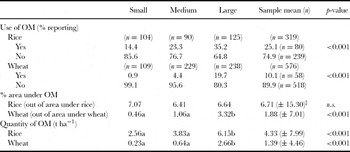
The survey results showed the preference among the farmers to use organic manures for rice (25.1% farmers) over wheat crop (10.1% farmers) (Table 2). Farmyard manure (FYM) was the most commonly used organic manure and it is generally applied about 1–1½ months before the sowing/transplanting of the crop. Most cattle dung (source of FYM) is burnt as dung cakes to meet household energy needs thus limiting the scope for application in the fields. Of the area under rice/wheat crop, on average only 6.71 and 1.88% of the rice and wheat area, respectively, was treated with organic manures. This means that a field is treated with organic manures after 15 years in rice and after 53 years in wheat. This frequency of organic manures among different land holding categories was almost similar in rice, but in wheat this frequency significantly reduced with reduction in farm size.
Organic manure (OM) use pattern in rice and wheat crops.

‡Value in parentheses: ± s.d.
Note: Significance levels are from Chi2 (% data) and one-way ANOVA (numerical data). Data followed by different lower-case letters differ significantly (Duncan multiple range test, significance level = 0.05, within row comparison).
In general, the average quantity of organic manures used was 4.33 t ha−1 in rice and 1.39 t ha−1 in wheat. The use of organic manures increased significantly with increase in the land holding size, irrespective of crop. Sheoran (Reference Sheoran2003) also reported that large farmers used comparatively higher quantities of organic manures than small and medium farmers. Moreover, in wheat, the small farmers used negligible amounts of organic manures. The more widespread use of FYM for rice than wheat has been reported previously (Sidhu et al., Reference Sidhu, Rupela, Beri and Joshi1998) and is associated with the favourable temperature and more turnaround time after the wheat harvest to allow its decomposition and mineralization-immobilization turnover in the field (including the time when rice seedlings are in nursery) resulting in greater availability of nutrients to rice. Large-scale adoption of zero tillage wheat in the region and short turnaround time after rice harvest (Erenstein et al., Reference Erenstein, Malik and Singh2007) have restricted the use of FYM in wheat as application of FYM needs tillage operations for its incorporation and time for decomposition.
Apart from contributing modest quantities of the primary nutrients (0.5–1.5% N, 1.2–1.8% P2O5 and 1.2–2.0% K2O on dry weight basis), FYM also offer a good source of the secondary and micronutrients necessary for plant growth and has an impact on crop productivity brought about by physico-chemical and microbiological factors (Yadvinder-Singh and Bijay-Singh, Reference Yadvinder-Singh, Bijay-Singh, Yadvinder-Singh, Bijay-Singh, Nayyar and Singh2003b). Most farmers in Haryana are also of the opinion that organic manures improve soil structure, crop growth and yield (Sheoran, Reference Sheoran2003). The significant residual effects of organic manures, applied to rice, on the succeeding wheat crop is also one of the reasons for limited use of organic manures in wheat. Most of the landless labourers in the rural areas depend on dairying and generally sell surplus FYM to farmers. The buying capacity of farmers is directly related to their land holding size. Therefore, organic manures are used more by large farmers compared to medium and small farmers. The laborious and bulky nature of organic manures is also highly associated with the lack of application of organic manures by the farmers to their crops (Sheoran, Reference Sheoran2003).
Nitrogen
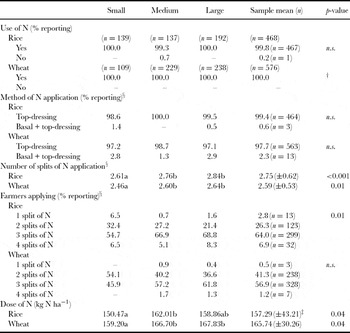
Nitrogen application in rice (99.8%) and wheat (100%) crops was universal, and prilled urea [CO(NH2)2] was its main source. Lathwal et al. (Reference Lathwal, Garg, Malik, Goyal, Dhukia, Chauhan, Singh and Om2008) reported that in Haryana urea was the major source of N and all the farmers used N on their rice and wheat crops. Top-dressing was the most common method of application in both the crops. However, to some extent (0.6% in rice and 2.3% in wheat) farmers also applied N through basal + top-dressing (Table 3). Land holding categories did not affect the use or method of N fertilizer application, and the majority of farmers in all the categories used their own experience/traditional method of fertilizer application.
Nitrogen use pattern in rice and wheat.

†No statistics are computed because ‘Use of N’ is a constant.
§Respective of use of N (total n = 467 for rice; total n = 576 for wheat).
‡Value in parentheses: ± s.d.
Note: Significance levels are from Chi2 (% data) and one-way ANOVA (numerical data). Data followed by different lower-case letters differ significantly (Duncan multiple range test, significance level = 0.05, within row comparison). Some of column sums may not add up to 100% due to rounding.
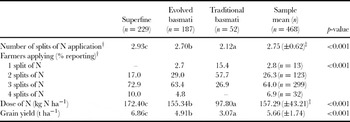
On average, farmers used slightly higher N for wheat (165.74 kg N ha−1) than rice (157.29 kg N ha−1). However, when compared to superfine rice (172.40 kg N ha−1), farmers used less N for wheat (Table 4). The frequency of N application was higher in rice (2.75 splits) compared to wheat (2.59 splits). Most N (90.3% in rice and 98.2% in wheat) was applied in two to three splits in both the crops. Sheoran (Reference Sheoran2003) has also reported that farmers used 195 kg N ha−1 through four splits in rice. The highest dose of N in rice was used by medium farmers but was not statistically different to large farmers. The N dose used in wheat increased significantly with increase in size of land holding and was not statistically different between medium and large farmers. In general, small farmers used the least N irrespective of crop. Land holding categories differed significantly regarding the frequency of N application and increased with increase in the size of land holding in both the crops. Since adequate N supply is needed throughout the active growing period of rice, proper N management is crucial for successful rice production (Stalin et al., Reference Stalin, Ramanathan, Natarajan, Chandrasekaran and Buresh2008.)
Nitrogen use pattern in different rice types.

†Respective of use of N (total n = 467).
‡Value in parentheses: ± s.d.
Note: Significance levels are from Chi2 (% data) and one-way ANOVA (numerical data). Data followed by different lower-case letters differ significantly (Duncan multiple range test, significance level = 0.05, within row comparison). Some of column sums may not add up to 100% due to rounding.
The response of N seems to depend on soil characteristics such as organic carbon content, cropping intensity, length of growing season, irrigation and weed management (Bijay-Singh and Yadvinder-Singh, Reference Bijay-Singh, Yadvinder-Singh, Yadvinder-Singh, Bijay-Singh, Nayyar and Singh2003). Lack of irrigation and labour delays the transplanting of rice thus reducing the growing season for the crops. The small and medium farmers mostly harvest their rice crop manually. Because of the late harvesting of rice crop and lack of own farm machinery, sowing of wheat by small and medium farmers is delayed, again reducing the growing season (Hobbs and Mehla, Reference Hobbs and Mehla2003). However, after harvest of the rice crop, wheat is sown promptly by large farmers thus extending the growing season. Small farmers use less N, have inadequate availability of labour, irrigation water and farm machinery mainly because of their poor economic status, and depend on custom hiring for irrigation, field preparation and sowing. The economic condition of the large farmers is good and most of them have permanent/hired labour and assured irrigation facilities. Since N is used more frequently where assured irrigation facilities are available and the crop growing season is long, large farmers applied N to their crops more frequently. Farmers in this region have almost assured irrigation (particularly during rabi/winter season) and chemical weed management is most common in the wheat crop (Erenstein et al., Reference Erenstein, Malik and Singh2007). All these factors lead to an augmented response of the crop to N application.
The use of N in terms of quantity and frequency in rice crop varied significantly depending on its type. Farmers used 172.40, 155.34 and 97.80 kg N ha−1 in superfine, evolved basmati and traditional basmati, respectively (Table 4). The corresponding values for number of splits of N application were 2.93, 2.70 and 2.12. Erenstein et al. (Reference Erenstein, Malik and Singh2007) also reported similar trend of N use (180, 159 and 103 and 187 kg N ha−1 in superfine, evolved basmati, traditional basmati and wheat, respectively) in the rice-wheat zone of irrigated Haryana. For traditional basmati, farmers restricted the use of N up to three splits (73.1% within two splits); however, increase in number of splits corresponding to the increase in quantity was observed in evolved basmati and superfine rice. In superfine rice, no farmer applied his whole dose of N in one split; rather farmers went for up to four splits (10.0% farmers). The dose as well as frequency of N application in evolved basmati was in between traditional basmati and superfine rice.
The dose of N is directly related to the yield of rice crop. Grain yield was highest in superfine rice (6.86 t ha−1) followed by evolved (4.91 t ha−1) and traditional (3.07 t ha−1) basmati rice. The farmers also use N in accordance to the yield potential of rice types. In general, nutrient use in high yielding rice is inefficient (Alam et al., Reference Alam, Ladha, Foyjunnessa, Rahman, Khan, Harun-ur-Rashid, Khan and Buresh2006). Basmati rice is prone to lodging and requires less N, particularly the relatively tall traditional basmati, explaining the observed differences in N use rate among different rice types (Erenstein et al., Reference Erenstein, Malik and Singh2007). Also the modern dwarf superfine varieties of rice respond well to higher doses of N.
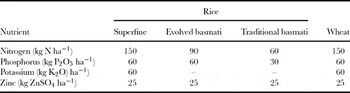
The survey data revealed that farmers used higher than the recommended dose (Table 5) of N in both the crops. The farmers used 14.9, 72.9, 63.0 and 10.5% higher doses of N than the recommended in superfine rice, evolved basmati, traditional basmati and wheat, respectively. Farmers used very high doses of N (101 kg ha−1) in traditional basmati rice (Lathwal et al., Reference Lathwal, Garg, Malik, Goyal, Dhukia, Chauhan, Singh and Om2008). Use of N fertilizer at a higher dose as well as at the wrong time makes plants succumb to lodging, and produces a paradise for insect pests and diseases (Islam et al., Reference Islam, Bagchi and Hossain2007). Farmers tend to use more nitrogenous fertilizer than needed mainly because of the subsidized price and its immediate visible impact on plant growth and leaf colour. The trend is already evident for use of N at more than 150 kg N ha−1 on rice which follows wheat in Punjab, Haryana and western Uttar Pradesh, where grain yield of 10–12 t ha−1 per annum are being obtained in the RWCS (Bijay-Singh and Yadvinder-Singh, Reference Bijay-Singh, Yadvinder-Singh, Yadvinder-Singh, Bijay-Singh, Nayyar and Singh2003).

Phosphorus
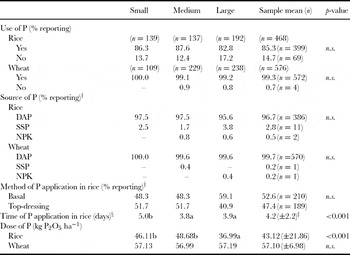
Application of fertilizer P is essential for raising the available P content in soils in order to meet the crop requirements at different stages of growth. Removal of P by the RWCS far exceeds its additions through fertilizers and recycling. Total P uptake by rice-wheat ranges from 17 to 67 kg ha−1. Crop removal of fertilizer P seldom exceeds 30% of applied P (Yadvinder-Singh and Bijay-Singh, Reference Yadvinder-Singh, Bijay-Singh, Yadvinder-Singh, Bijay-Singh, Nayyar and Singh2003a). The survey data showed that P fertilizer was used by 85.3% of farmers on rice and by almost all farmers (99.3%) on wheat (Table 6). Diammonium phosphate was the main source of P in both the crops. The All India Coordinated Agronomic Research Project at different locations in India showed that DAP was a better source of P than single superphosphate in almost all the soils, both for its direct effect in rice and cumulative effect in wheat. Lathwal et al. (Reference Lathwal, Garg, Malik, Goyal, Dhukia, Chauhan, Singh and Om2008) reported use of P on rice and wheat by 74.2 and 96.2% of farmers, respectively, in the RWCS of Haryana.
Phosphorus use pattern in rice and wheat crops.

†Respective of use of P (total n = 399 for rice; total n = 572 for wheat).
§Only for farmers applying P through top-dressing (total n = 189).
‡Value in parentheses: ± s.d.
P: Phosphorus; DAP: Diammonium phosphate; SSP: Single superphosphate; NPK: complex fertilizer.
Note: Significance levels are from Chi2 (% data) and one-way ANOVA (numerical data). Data followed by different lower-case letters differ significantly (Duncan multiple range test, significance level = 0.05, within row comparison). Some of column sums may not add up to 100% due to rounding.
Overall, 52.6% farmers used P on rice just at the time of transplanting and 47.4% top-dressed it after transplanting (4.2 days after transplanting). However, for wheat all the farmers used P as a basal dose at the time of sowing. Application of whole dose of recommended P at sowing of wheat is more beneficial than top-dressing during the later growth stages. At the low temperatures, encountered during wheat growth, more P is required in the early growth stages due to low rate of P diffusion in soils (Yadvinder-Singh and Bijay-Singh, Reference Yadvinder-Singh, Bijay-Singh, Yadvinder-Singh, Bijay-Singh, Nayyar and Singh2003a). The widely followed recommended practice for rice is to apply P at puddling. But the farmers also applied P after transplanting because when P is applied at the time of puddling, the fertilizer reacts with standing water, and the labourers hesitated to enter the rice field for transplanting as it affects their hands and feet badly. Farmers also top-dressed P after mixing it with weedicides to facilitate application of the weedicides and make best use of the labour, which otherwise is not easily available at this time. There was no significant difference among different land holding categories regarding the use and method of P application in both crops.
In general, the dose of P used by farmers was low (43.12 kg P2O5 ha−1) in the rice crop compared to wheat (57.1 kg P2O5 ha−1). Since it has been advocated that P application should be made to the wheat crop and the rice crop be allowed to benefit from the residual P left in the soil, the use (85.3% farmers) as well as dose of P was comparatively less in rice. As P availability changes with alternate submergence and drying, the P applied to wheat shows greater residual effect on the succeeding rice, while P applied to rice has less residual effect on the succeeding wheat (Palmer et al., Reference Palmer, Ismunadji and Xuan1990). In another study Erenstein et al. (Reference Erenstein, Malik and Singh2007) reported that farmers used 44.4 kg P2O5 ha−1 in rice and 57.7 kg P2O5 ha−1 in wheat, which is almost identical to that of the present study. The corresponding figures as reported by Lathwal et al. (Reference Lathwal, Garg, Malik, Goyal, Dhukia, Chauhan, Singh and Om2008) were 34.3 and 56.8 kg P2O5 ha−1.
When seen across the land holding categories, medium (48.68 kg P2O5 ha−1) and small (46.11 kg P2O5 ha−1) farmers showed no statistical difference and used significantly higher P then large farmers (36.99 kg P2O5 ha−1) in rice. Use of relatively less P in rice by large farmers might be because they have also applied comparatively more FYM (Table 2), which supplied considerable amount of P. However, farmers of all the land holding categories used statistically equal doses of P (56.99–57.19 kg P2O5 ha−1) in wheat. Thus P application rate in wheat is similar to the recommended level (Table 5).
Regarding the time of top-dressing of P in rice, farm size categories varied significantly, with medium and large farmers applying it earlier and small farmers late (5.0 days after transplanting).
Potassium
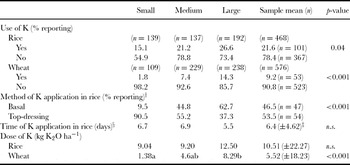
K was not used by the farmers on a large scale in rice and wheat crops, although, it has been recommended for both (Table 5). K was used by 21.6% farmers in rice and by only 9.2% in wheat (Table 7). Use of K fertilizer by farmers increased significantly with increase in land holding size category. Murate of potash (KCl) is a major fertilizer K source for rice and wheat because of its low cost and high K analysis (60% K2O). In the IGP, 99% of the total fertilizer K is applied through KCl. Similar K use pattern (17.8% in rice and 7.6% in wheat) has been reported by Lathwal et al. (Reference Lathwal, Garg, Malik, Goyal, Dhukia, Chauhan, Singh and Om2008).
Potassium use pattern in rice and wheat crops.

†Respective of use of K (total n = 101).
§Only for farmers applying K through top-dressing (total n = 54).
‡Value in parentheses: ± s.d.
Note: Significance levels are from Chi2 (% data) and one-way ANOVA (numerical data). Data followed by different lower-case letters differ significantly (Duncan multiple range test, significance level = 0.05, within row comparison).
K was applied at the time of sowing by all the farmers in wheat; however, for rice 46.5% farmers applied it just before transplanting and 53.5% top-dressed after transplanting (6.4 days after transplanting). The method of K application varied significantly across different land holding categories in rice with most of the small farmers (90.5%) top-dressing the K fertilizer, while large farmers (62.7%) applied it basally as per recommendation, i.e. just before transplanting. However, the medium farmers applied the K fertilizer using both methods. A common recommendation is to apply the full dose of K as basal dressing at puddling for rice and at sowing of wheat. Because rice and wheat require large quantities of K, a sustained supply is necessary up to heading stage when the reproductive stage is complete (Bijay-Singh et al., Reference Bijay-Singh, Yadvinder-Singh, Vashishta, Yadvinder-Singh, Bijay-Singh, Nayyar and Singh2003b). The application of K fertilizer as basal dressing increased significantly with increase in size of land holding categories indicating that even when there is shortage of labour at the time of transplanting, large farmers manage by paying more for basal application of fertilizers.
Regarding the time of top-dressing of K in rice, there was no significant difference among land holding categories and on average farmers applied the K fertilizers at 6.4 days after transplanting.
In general, farmers used a higher dose of K (10.51 kg K2O ha−1) in rice compared to wheat (5.52 kg K2O ha−1). The dose of K fertilizer increased with increasing size of land holding category in both crops, however, the increase was significant only in wheat. Large farmers used more K than small and medium farmers because of their better investment capacity. The average fertilizer K use for rice and wheat in India during 1998 was 9.4 and 3.8 kg K2O ha−1, respectively (Bijay-Singh et al., Reference Bijay-Singh, Yadvinder-Singh, Vashishta, Yadvinder-Singh, Bijay-Singh, Nayyar and Singh2003b). The results are in close conformity with Lathwal et al. (Reference Lathwal, Garg, Malik, Goyal, Dhukia, Chauhan, Singh and Om2008) where farmers used 10.7 and 7.0 kg K2O ha−1 in rice and wheat, respectively.
Rice tends to respond more to K than wheat. In a 5-year field study on a sandy loam soil (ammonium acetate extractable K-123 kg ha−1), application of 25 kg ha−1 resulted in a mean increase in yield of rice and wheat by 280 and 160 kg grain ha−1, respectively (Meelu et al., Reference Meelu, Yadvinder-Singh, Bijay-Singh, Bhandari, Dev and Sidhu1995).
Diagnostic surveys (Yadav et al., Reference Yadav, Singh, Prasad, Dwivedi, Batta, Singh, Patil, Chaudhary, Yadav and Singh2000) have indicated that rice-wheat farmers in the IGP seldom adopt recommended fertilizer doses and K fertilizers are rarely used. Although soils under the RWCS contain large amounts of K as an essential part of their matrix, they often fail to supply adequate amounts of the nutrient to meet the normal needs of the plant. The response of sequentially grown rice and wheat to applied K is influenced by time and method of application of different sources of K and interaction of K with other nutrients (Bijay-Singh et al., Reference Bijay-Singh, Yadvinder-Singh, Imas and Jian-chang2003c).
Zinc
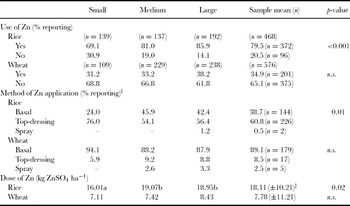
Among all the essential micronutrients, deficiency of Zn is the most widespread micronutrient disorder of rice and wheat in India. The survey showed that 79.5% farmers in rice and 34.9% in wheat crop used Zn. Use of Zn by farmers increased significantly with increase in size of land holding category for rice; however, the increase was non-significant for wheat (Table 8). Awareness among the farmers about the menace of Zn deficiency in soil, particularly in the RWCS, has resulted in the increased use of zinc sulphate (ZnSO4.7H2O with 21.5% Zn). Sheoran (Reference Sheoran2003) and Lathwal et al. (Reference Lathwal, Garg, Malik, Goyal, Dhukia, Chauhan, Singh and Om2008) have reported that 83% farmers used Zn on their rice crop. Irrespective of land holding category, most rice farmers (60.8%) top-dressed the Zn in the standing crop, while in the wheat crop farmers (89.1%) applied it basally at the time of sowing. Standing water in rice favours the top-dressing of Zn. Also labourers hesitate to enter the field for transplanting if fertilizer is applied basally before transplanting. Farmers rarely sprayed the Zn in their crops. For correcting Zn deficiency soil application of Zn has been found to be superior to foliar application. The lower efficiency of the foliar mode is primarily due to delayed supply of Zn as well as the low concentration of Zn in spray solution. Application of Zn to soil just prior to sowing/transplanting gives best results in terms of efficient correction of Zn deficiency (Sadana and Takkar, Reference Sadana and Takkar1983).
Zinc use pattern in rice and wheat crops.

†Respective of use of Zn (total n = 372 for rice; total n = 201 for wheat).
‡Value in parentheses: ± s.d.
Note: Significance levels are from Chi2 (% data) and one-way ANOVA (numerical data). Data followed by different lower-case letters differ significantly (Duncan multiple range test, significance level = 0.05, within row comparison). Some of column sums may not add up to 100% due to rounding.
In general, farmers used a higher dose of Zn in rice (18.11 kg ZnSO4 ha−1) than wheat (7.78 kg ZnSO4 ha−1). The land holding categories differed significantly in terms of dose of Zn in rice only; however, the dose of Zn increased with increase in size of land holding category in wheat also. The medium farmers in case of rice and large farmers in case of wheat used the highest dose of Zn; 19.07 and 8.43 kg ZnSO4 ha−1, respectively. The better economic condition of medium and large farmers allows applying higher dose of Zn compared to small farmers. In another study Lathwal et al. (Reference Lathwal, Garg, Malik, Goyal, Dhukia, Chauhan, Singh and Om2008) reported use of Zn at 20.2 kg ha−1 in rice. The crop utilizes only a small quantity of the applied Zn for their normal growth. Therefore, a considerable amount of Zn remains in the soil, which can be utilized by the subsequent crops (Nayyar et al., Reference Nayyar, Chhibba, Bansal, Yadvinder-Singh, Bijay-Singh, Nayyar and Singh2003). Because of the residual effect of Zn applied in rice on the succeeding wheat crop, farmers applied less Zn in their wheat crop. Since submerged soils, e.g. lowland rice soils, are generally prone to Zn deficiency, which has been attributed to reduced availability of Zn in soil and suppression of its uptake by high levels of Fe2+ and Mn2+ (Ponnamperuma, Reference Ponnamperuma1972), farmers applied higher doses of Zn to their rice crop. Erenstein et al. (Reference Erenstein, Malik and Singh2007) also observed application of more Zn in rice than wheat. The farmers applied the Zn to their rice crop at slightly less than the recommendation (Table 5) and much below recommendation in wheat crop.
Biofertilizers
There was negligible use of biofertilizers by farmers in both rice and wheat crops. Only 3.8% of farmers used the biofertilizers on rice and 1.2% on wheat. The biofertilizers available with various local trade names are enriched with some plant growth regulators and hormones to stimulate crop growth. Most biofertilizer users were small and large farmers. Top-dressing was the most widespread method of biofertilizer application for both rice and wheat. On average, farmers used 1.5 times higher dose of biofertilizers (0.60 kg ha−1) in rice than in wheat (0.40 kg ha−1). The declining sustainability of the RWCS and the higher cost of fossil fuel used in the production of fertilizers may lead to emphasis on the exploitation of biofertilizers. The biofertilizers at their present state of development cannot supply more than 15–40 kg N ha−1. Also the performance of biofertilizers is highly unpredictable; the yield ranges from 10–65% (Gupta et al., Reference Gupta, Kalia, Yadvinder-Singh, Bijay-Singh, Pandher, Yadvinder-Singh, Bijay-Singh, Nayyar and Singh2003). The biological nature of the biofertilizers and their susceptibility to abiotic factors is responsible for highly inconsistent results. Continuous research is needed to produce region-specific and cost-effective biofertilizers.
Grain yield
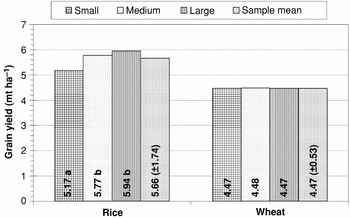
The survey data revealed that grain yield of rice increased significantly with increase in the size of land holding. However, grain yield of wheat across different land holding categories remained almost the same (Figure 2). Higher grain yield of rice in case of large farmers was mainly due to better nutrient management practices in terms of amount, method and time of application. The dose of N in rice used by large farmers was similar to medium farmers, but its application was more frequent in terms of number of splits, thus resulting in increased efficiency and higher grain yield. The lowest dose of N used by small farmers resulted in lower grain yield. The large farmers used significantly less P than small and medium farmers but without sacrificing yields. Most of farmers applied P at the time of puddling (basal), even the P applied through top-dressing (after transplanting) was earlier, under the large land holding category, which may have compensated for lower doses on account of efficiency. The supplement from organic manures as used more in case of large farmers is another possibility.
Reported grain yields (t ha−1) of rice and wheat crops under different land holding categories. Data followed by different lower-case letters differ significantly (Duncan multiple range test, significance level = 0.05, within crop comparison). For small, medium and large land holding categories, respective number of samples: n = 139, 137, and 192 in rice (total n = 468) and n = 109, 229 and 238 in wheat (total n = 576). Values in parentheses indicate ± s.d.

Comparatively more farmers used significantly higher doses of organic manures, K and Zn in the large land holding category. Response of rice to N and P application rates has reached a plateau. Organic manures supply not only primary nutrients but also micronutrients (whose deficiency has started in the RWCS) and have more pronounced positive effect on grain yield (Yadvinder-Singh and Bijay-Singh, Reference Yadvinder-Singh, Bijay-Singh, Yadvinder-Singh, Bijay-Singh, Nayyar and Singh2003b). Comparatively higher dose and largely basal application of K and Zn, as recommended, by the large land holding category farmers increased the rice yield, indicating more response of rice to K and Zn. However, these nutrients are either not used or their use is insufficient (Yadav et al., Reference Yadav, Singh, Prasad, Dwivedi, Batta, Singh, Patil, Chaudhary, Yadav and Singh2000).
In wheat also the nutrient management practices were more or less identical to rice crop across different land holding categories, but did not influence the grain yield. Even though the nutrient use increased with increase in the size of land holding category, no corresponding increase in grain yield was recorded. This suggests that the amount of nutrients applied to wheat by small farmers is enough to get maximum grain yield, and medium and large farmers, due to their better economic condition, apply more nutrients without any beneficial effect on grain yield.
CONCLUSIONS
The average size of farm unit in terms of ownership is decreasing but the cultivation unit is expanding and thus, there may be some yield gain on this count. The on-farm use of N exceeds the recommended levels across the different types of rice and wheat. The nutrient mining over the years and decrease in organic fertility of the soil warrant revalidation of recommendations through factorial studies and on-farm research. The findings of this study show quite explicitly that there is no significant yield gain with the higher doses of N. The separate recommendation of P levels in wheat and rice should be harmonized. K application is negligible while Zn application is becoming common among the farmers. The natural K-status of soil is insufficient, therefore K application as fertilizer in both crops can produce yield margins. The longer turnaround period for the use of organic manures, coupled with smaller doses highlights the fact that nutrient management in the RWCS is largely accomplished through chemical fertilizers.
This study generated comprehensive data on nutrient use pattern in the RWCS, thus providing necessary input to researchers, planners and developmental agencies who wish to enhance food security. The data may be used for rationalization of fertilizer subsidy, such as transferring subsidies from N fertilizers to K fertilizers. Adequate incentives to the farmers adopting the integrated nutrient supply system may help in the endeavour. The supply front needs adequate care. India is self-sufficient in N fertilizers, but the import line for P and K fertilizers should be assured on a lasting basis.
Acknowledgements
We sincerely thank all the farmers who have participated in the survey. The survey was carried out through the financial assistance of Directorate of Extension Education, CCS Haryana Agricultural University, Hisar, India. The views expressed in this paper are those of individual scientists and do not necessarily reflect the views of the donor or the authors’ institution.