I. INTRODUCTION
Semiconductor compounds from the III–V direct band gap family have been extensively studied for the last decades due to their wide range of applications, such as space electronic components, Reference Claeys and Eddy1 replacement of silicon in microelectronic components, Reference Dyksik, Motyka and Rudzinski2,Reference Mayer and Lau3 and solar cells. Reference Radziemska4,Reference Eyderman and Sajeev5 Gallium arsenide (GaAs) has been shown to have superior electronic properties to conventional semiconductors, leading to a large body of research to advance its properties. For instance, GaAs has higher saturated electron velocity and higher electron mobility so as to develop extremely high performance high-electron-mobility-transistors (HEMTs). Reference Alim, Ali and Christophe6 For these compelling reasons, GaAs has been proposed as one of the better alternatives for space-based electronics application, Reference Schermer, Mulder, Bauhuis and Larsen7 but its properties can be altered due to the bombardment of high energy ions from space environment. When accounting for space radiation damage, the GaAs crystal lattice may be heavily damaged by energetic recoils, and atoms are displaced from their lattice sites, resulting in the performance degradation of electronic devices. Therefore, understanding radiation damage mechanisms in GaAs is essential to mitigate radiation induced effects to within acceptable ranges. Reference Messenger, Burke, Walters, Warner and Summers8–Reference Movla, Mohammad and Seyed11 However, often fundamental concepts and/or parameters are overlooked or not properly analyzed. To theoretically estimate the total damage in materials, one of the crucial parameters associated with primary damage production is the threshold displacement energy (E d). This parameter can be defined as the amount of energy required to displace an atom from its ground state lattice position. Reference Ionascut, Carlone and Houdayer12 As shown by Gao et al., it can be determined by the minimum energy required to produce a Frenkel pair of a given atom in the lattice. Reference Gao, Weber and Devanathan13
Currently, a vast amount of research has focused on the basics of ion–solid interaction and irradiation damage of semiconductors, both experimentally Reference Messenger, Burke, Walters, Warner and Summers8,Reference Bjorkas, Nordlund and Arstila9 and computationally. Reference Karaseov, Karabeshkin, Mongo and Titov10,Reference Movla, Mohammad and Seyed11,Reference Lucas and Laurent14,Reference Schick, Morgan and Papoulias15 These studies present a comprehensive description of the semiconductor’s performance under various conditions, including irradiation. Previous work has also examined the threshold displacement energy in GaAs. Experimental results reported a threshold displacement value of approximately 10 eV which was measured by deep-level transient spectroscopy Reference Lehmann and Braunig16 and a frequency-domain technique. Reference Barry, Maxseiner and Wojcik17 Due to the lack of analogous nonelectric methods to determine displacement energies, Nordlund proposed a value of 15 eV that was a reasonable approximation for the effective displacement energy, Reference Nordlund, Peltola, Nord and Keinonen18 as compared to the experimental data. Various computational models have been proposed to elucidate ion–solid interaction mechanisms in GaAs based on different interaction potentials. Reference Albe, Nordlund, Nord and Kuronen19–Reference Sayed, Jefferson, Walker and Cullis21 The threshold energies of GaAs along several principal crystallographic directions were determined but with a modified Si Tersoff semi-empirical many-body potential, Reference Sayed, Jefferson, Walker and Cullis21 which was suggested to be a suitable method for simulating atomic collision in GaAs in the early 1990s. However, the interactions between atoms were still not well understood due to limitations in describing the ground-state structure, surfaces, melting behavior, and point defects, which were noticed to limit its applications. Reference Nordlund and Kuronen22 Subsequently, the adapted Tersoff–Brenner parameterization developed by Albe et al. Reference Albe, Nordlund, Nord and Kuronen19 was confirmed to have better performance, with the closest results to DFT calculations, as compared to two other potentials (Smith et al. Reference Smith20 and Sayed et al. Reference Sayed, Jefferson, Walker and Cullis21 ), especially in describing Ga–As and Ga–Ga bonds. Reference Zollo, Tarus and Nieminen23 While there is a broad interest in understanding radiation damage mechanisms in GaAs, Reference Bjorkas, Nordlund and Arstila9,Reference Movla, Mohammad and Seyed11 the threshold displacement energies’ dependence on crystallographic direction is poorly understood. Therefore, the threshold displacement energy dependence on crystallographic direction was analyzed in this paper to address this lack of understanding.
In this work, we present a systematic computational approach involving MD, which has been proven to be a useful method to show recoil events in both metals Reference Gao, Bacon and Ackland24,Reference Nordlund, Wallenius and Malerba25 and semiconductors Reference Sayed, Jefferson, Walker and Cullis26,Reference Gao, Xiao, Zu, Posselt and Weber27 to study E d dependence on crystallographic orientation in GaAs, with more than 3600 recoil events. We demonstrate the importance and robustness of the current approach used in understanding how the system responds within the radiation environment. Finally, various defect configurations produced by these low energy recoils, together with the separation distances of Frenkel pairs, were identified.
II. SIMULATION METHOD
A. Molecular dynamics approach
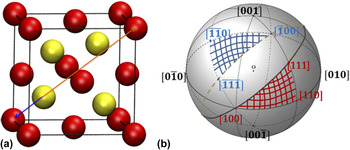
A modified version of the MD code-MOLDY Reference Gao, Bacon, Flewitt and Lewis28 was used to determine the threshold displacement energies along different recoil directions. A simulation box with a size of 10 × 10 × 10 unit cells (consisting of 8000 atoms) was created, with a zinc-blende structure for GaAs, as shown in Fig. 1(a). Periodic boundary conditions were applied to the system. During the simulation, the computational block was held at a temperature at 0 K and equilibrated for 5 ps prior to a recoil event. The interactions between atoms are constructed based on an analytic bond-order-potential which was proposed by Albe et al. Reference Albe, Nordlund, Nord and Kuronen19 Allowing a wide range of properties of GaAs compound configuration, the used potential correctly describes the ground states of Ga, As, and GaAs and also prevents the strong forces by nonequilibrium atoms when in the cutoff region. The potentials have been used to study point defect properties, surface properties, and melting behavior of GaAs, thus validating their accuracy and transferability. Point-defect properties and surfaces with low As content are found to be in good agreement with results in literature, and the molten GaAs is found to be consistent with a structural model based on experiments that indicate a polymerized arsenic phase in the melt. However, it does not provide a satisfactory description for the short-range interactions which are important to simulate atomic displacement and defect creation at high recoil energies. To overcome this deficiency, the potential has been further modified by adding a repulsive potential, ZBL ‘Universal’ potential, Reference Biersack and Ziegler29 which well describes the high energy scattering of atoms in solids. To simulate a recoil event, a recoiling atom was created by defining either Ga or As as a primary knock-on atom (PKA), which was chosen close to the center of simulation block to prevent the PKA from crossing the boundaries. Furthermore, the PKA was given a kinetic energy (starting at 6 eV) along a specific crystallographic direction and the dynamic process was evolved for 5000 MD time steps (about 5 ps in real time). If the amount of energy given was enough to overcome the threshold displacement energy, the PKA was initiated by displacing it from its original site to generate a stable Frenkel pair or anion antisite at the end of the simulation. On the other hand, if a stable defect configuration was not observed, the initial kinetic energy was increased by 2 eV, and so E d, quoted here is ±1 eV.
(a) GaAs crystal structure; (b) illustration of stereographic triangles on a reference sphere.

B. Crystallographic geometry
Consideration of crystallographic geometry has been proven to be a distinctive factor in exploring the displacement damage. Reference Nordlund, Wallenius and Malerba25 In this study, we use the Mercator method Reference Uegami and Tamamura30 to represent the stereographic projection of the crystallographic direction of the zinc-blende crystal, which can be thought to be equivalent to the diamond structure. Each point on the reference sphere in Fig. 1(b) stands for a direction projection, where the sphere center coincides with the origin of the crystal cube.
For zinc-blende, a standard unit stereographic triangle on the sphere is a representative of the area in which all possible recoil directions can take place, with the remaining directions known to exhibit the same behavior.
Reference Uegami and Tamamura30
However, for a compound semiconductor, e.g., GaAs, which has the nearest neighbor of unlike atoms, two triangles are required (with the side of [100]–[110]–[111] and
 $\left[ {\bar 100} \right]$
–
 $\left[ {\bar 1\bar 10} \right]$
–
 $\left[ {\bar 1\bar 1\bar 1} \right]$
, respectively) to investigate the displacement threshold energy for each atom type. For example, an As atom moving along the [111] direction, as indicated by an orange arrow in Fig. 1(a), encounters a Ga atom at the distance of 7.34 Å but at a distance of 2.45 Å when it moves along the
 $\left[ {\bar 1\bar 1\bar 1} \right]$
direction. This should make the displacement of As atoms difficult along [111] and much easier along
 $\left[ {\bar 1\bar 1\bar 1} \right]$
. This fact has been illustrated in Fig. 1(b), with red shaded part corresponding to the triangle in positive direction while the blue one is for negative. Thus, more than 3600 directions in total were simulated for both species as a PKA indicated by the angles in Mercator map.
III. RESULTS AND DISCUSSION
Within the GaAs microstructure, a distinct threshold energy exists for each crystallographic direction. In the following sections, the threshold displacement energies on both sides and for the inner part of unit stereographic triangles will be established. For a detailed description of defect configurations and separation distance, we will present these at the end of the recoil events, which can be used to explain the corresponding values of E d in low index directions.
A. Unit stereographic triangles
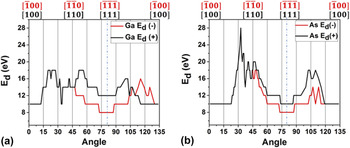
The calculated threshold energies for Ga and As recoil atoms on the three borders of the two unit stereographic triangles are illustrated in Figs. 2(a) and 2(b), respectively. It was noticed that both Ga and As atoms require at least 8 eV kinetic energy to knock off a neighbor atom along a given direction. This is the lowest energy value for which a stable Frenkel pair was created through the simulations. For both triangles considered, the threshold energy of a Ga PKA varies over a range of 8–18 eV along the sides of the triangles, as shown in Fig. 2(a), while As was widely distributed between 8 and 28 eV in Fig. 2(b). A lower value of energy of 8 eV in the
 $\left[ {\bar 1\bar 1\bar 1} \right]$
direction than that of 12 eV in the [111] direction was noticed for Ga. The higher value in [111] for Ga can be explained by the strong repulsive energy between Ga and its first nearest neighbor As, thus forcing it to return to its equilibrium site during collision. However, for the As case [Fig. 2(b)], the displacement threshold energy for these two directions was 8 eV and 10 eV, respectively. This could be explained by the energy transfer efficiency of the heavy PKA to a lighter atom, thus the difference in the two directions for an As atom was not significant, though a larger distance to Ga in [111] direction would make for a slight difference in the value. Furthermore, a Ga atom is 1.13 lighter than an As atom, and thus it should be easier for an As to knock off a Ga from its lattice position than vice versa. However, in monatomic diamond structured semiconductors (e.g., Si), it has been shown that E
d is equivalent in all
 $\lt111\gt$
directions.
Reference Holmström, Kuronen and Nordlund31
The differences noticed here will be further discussed in Sec. III. D.
(a) The displacement threshold energy around the sides of the unit stereographic triangles for Ga; (b) the displacement threshold energy around the sides of the unit stereographic triangles for As.

B. Threshold displacement energy contour maps
In addition to the E
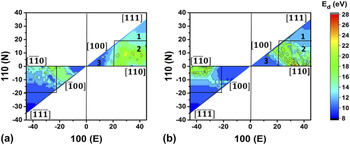
d determined along the main crystallographic directions, a large number of directions within the stereographic projection triangles were also taken into consideration as a function of angles. The results are interpreted by Mercator maps. As mentioned before, over three thousand recoil events were performed for both Ga and As to get a smooth and comprehensive distribution, and an in-depth understanding of E
d dependence on crystallographic orientation, and the results are shown in Figs. 3(a) and 3(b) for Ga and As recoils, respectively, where the different colors indicate different energy scales. Thus, we can consider the E
d as defining three distinctive regimes, namely, zone 1, 2, and 3 as indicated in the figures. An interesting observation is that there is an even higher value of threshold energy of 22 eV for Ga, which occurs to trigger the recoil events in the central part of the stereographic projection triangles, while a maximum of 18 eV is found along the directions on the sides for Ga, as described in Sec. II. A. This may be due to the collision of the PKA with the secondary nearest neighbor atoms after moving a longer distance. Comparing the two triangles depicting the displacement energies of Ga recoils [Fig. 3(a)], there is a clear quantitative difference between the negative and positive directions. This is especially true in the inner region (zone 2) where the fraction of Ga recoils that produce persistent defects appears to be higher in the positive direction, with an initial energy of 18 eV, in consistent with the larger distribution of 18 eV on positive side than that on negative side. Threshold energies for Ga PKAs in the [111] direction and 20° north of the (110) pole, denoted zone 1, are 4 eV greater than those along the
 $\left[ {\bar 1\bar 1\bar 1} \right]$
direction. Further, the region enclosed by zone 2 reaches a maximum threshold of 22 eV, while the corresponding region on the negative side comes with a maximum of 18 eV.
(a) Threshold energy map for Ga; (b) threshold energy map for As.

Similarly, for As PKAs [Fig. 3(b)], a maximum value of 28 eV (E d) has been found in zone 2 which can also be interpreted by the same mechanism of collision with a secondary nearest neighbor as Ga. Overall, while there are small differences in the region adjacent to the [100] direction (zone 3), large differences are noticed in zone 1 and zone 2. This indicates that there is a higher probability of producing a stable defect with small energies in zone 3, than in either zone 1 or zone 2.
C. Overview of E d
The average displacement threshold energies in two oppositely oriented stereographic triangles for each atom type are summarized in Table I. The average threshold energy over the statistically significant sample size (a few thousand directions) combining both positive and negative directions was found to be 13 ± 1 eV for Ga and As. The identical value of E d,ave is to be expected due to the many physical similarities between these two atoms. Moreover, there have also been several experimental studies in GaAs on examining primary damage response. The lowest energy threshold from the experimental estimation of 10.0 ± 0.7 eV Reference Barry, Maxseiner and Wojcik17 and 9 eV Reference Lehmann and Braunig16 is consistent with 8 eV at the minimum for both species from our simulations. This indicates a good match with the established data in crystallographic nonequivalent crystal directions. In addition, since the effective displacement energy is typically about 50% higher than the threshold, Reference Nordlund, Peltola, Nord and Keinonen18 an estimation value of 15 eV on top of experiment data is consistent with what we have obtained through MD simulations (13 ± 1 eV). Hence, they are in satisfactory agreement.
Overview of displacement energies compared with experiment data. E d,ave, average displacement energy over three thousand directions for each type; N direction, number of directions simulated for each type.

D. Point defect configurations and separation distances at E d
The resulting defect configurations, combined with the Frenkel pair separation distances in low index directions, for both Ga and As are summarized in Table II. As outlined in the table, the stable defects created by the recoil events can be mainly described within three configurations: Gavac + Gaocta, Asvac + Astetra and a complex combination of As–As split interstitial, Ga interstitial, As vacancy and Ga vacancy. The second configuration was exclusively observed in the case of the As [110] PKA. These configurations for both Ga and As type are illustrated in Figs. 4 and 5, respectively.
Defect types and Frenkel pair separation distances for Ga and As in low index directions. Gavac: a Ga vacancy; Asvac: an As vacancy; Gaocta: a Ga octahedral interstitial; Astetra: an As tetrahedral interstitial; As–As: an As–As split interstitial; Gaint: Ga interstitial.

Schematic view of defect configurations for Ga PKAs in different crystallographic directions. (a) Ga recoil event in [100] direction; (b) Ga recoil event in [111] direction; (c) Ga recoil event in
 $\left[ {\bar 1\bar 1\bar 1} \right]$
direction. Atoms, interstitials and vacancies are indicated by different colors and sizes. Red circle highlights the initial position.

Schematic view of defect configurations for As PKAs in different crystallographic directions. (a) As recoil event in [111] direction; (b) As recoil event in
 $\left[ {\bar 1\bar 1\bar 1} \right]$
direction; (c) As recoil event in [110] direction. Atomic species and defects are the same as those in Fig. 4. Red circle highlights the initial position.

1. Gavac + Gaocta
Frenkel pair type defect configurations were predominant for most of the sampled PKA directions. The combination of Gavac + Gaocta has been visualized in [100], [110], and
 $\left[ {\bar 1\bar 1\bar 1} \right]$
for Ga atoms. Figure 4(a) shows the initial and final location of a Ga atom displaced along the [100] direction, separated by a distance of 2.58 Å. In order for the atoms to be displaced from the ground state location into an octahedral position, a kinetic energy of 10 eV must be transferred to the atom. In addition, a Ga recoiling event along the
 $\left[ {\bar 1\bar 1\bar 1} \right]$
direction [Fig. 4(c)] generated a Frenkel pair of Ga oriented in the
 $\left[ {\bar 1\bar 1\bar 1} \right]$
direction with a separation distance of 4.78 Å. It should be noted that the same final configuration was found in As
 $\left[ {\bar 1\bar 1\bar 1} \right]$
, as shown in Fig. 5(b) at a separation distance of 4.77 Å. Interestingly, an As PKA along the
 $\left[ {\bar 1\bar 1\bar 1} \right]$
direction results in As setting in the same location as the Ga
 $\left[ {\bar 1\bar 1\bar 1} \right]$
PKA. This is due to the ground state location for each atom, i.e., As being closer to the equilibrium location. The process includes three steps: (i) the Ga atom was displaced once the As recoil was given enough kinetic energy to overcome the energy barrier created by both Ga and its nearest neighbors; (ii) the As atom subsequently returned to its original position, without resulting in a defect atom; and (iii) the Ga was pushed forward from its site to move along
 $\left[ {\bar 1\bar 1\bar 1} \right]$
until it settled into an octahedral site, thus forming a Ga Frenkel pair. Moreover, the defect type and ejection process along the [100] direction have also been observed to be same in the [110] direction, but with a separation distance of 2.58 Å, as compared to 4.81 Å, as shown in Fig. 4(b) and in Table II.
2. Asvac + Astetra
Figure 5(a) shows the resulting defect for an As [111] PKA, where As travels a distance of 4.79 Å to settle in a tetrahedral site as a tetrahedral interstitial. This configuration has also been observed in Ga recoil events in [111] [Fig. 4(b)]. It implies that an intermediate step has to take place where the Ga PKA collides with the nearest As atom along [111] and is rebounded backward to its lattice site, thus resulting in an As vacancy and an As interstitial at tetrahedral site with a slightly larger distance of 4.96 Å. This process requires the PKA to have an initial kinetic energy of 12 eV. It also undergoes a similar process as for an As
 $\left[ {\bar 1\bar 1\bar 1} \right]$
PKA, but results in a Ga vacancy and a Ga octahedral interstitial instead. Furthermore, the recoil events for the As [100] PKA result in the same final configuration as that for the As [111] PKA.
3. Complex configuration
The most complex defect type was observed for the As [110] PKA case. As it travels from the initial position to the tetrahedral site along the [110] direction, the strong repulsive interaction between the As PKA and As atoms results in a trajectory shift causing the nearest face centered Ga atom to be displaced. The final configuration consists of Ga and As vacancies, a Ga interstitial and a 〈110〉 oriented As–As dumbbell sharing the same As atom site which was suggested to be the lowest energy configuration for an arsenic interstitial, Reference Schick, Morgan and Papoulias15 as shown in Fig. 5(c). A distance of 4.00 Å from its initial position to the dumbbell interstitial has been identified. Hence, the higher threshold energy of 18 eV must be associated with the complex defect configurations resulting from several displacements.
Overall, the data suggest that as long as the transferred kinetic energy exceeds the threshold value, both the separation distances and defect types for Ga and As along the 〈111〉 direction are analogous. Additionally, the short separation distance along the [110] direction suggests that the recombination of vacancy and interstitial may be easily achieved once the perturbation by other effects, such as higher temperatures, is taken into consideration.
IV. CONCLUSION
The threshold displacement energies for Ga and As atoms were investigated using MD method with a bond-order potential for GaAs, and the results demonstrated a weak dependence on the crystallographic direction in which the atom is displaced. The different types of lattice-atom vibrational modes and atomic sizes are believed to account for this slight dependence. By considering the crystallographic orientations of GaAs, the total 3600 recoils are simulated to study the special distribution of threshold energies in four stereographic triangles. The threshold energy for As recoils ranged from 8 to 28 eV, while it ranged from 8 to 22 eV for Ga recoils. The average threshold along the directions whose crystallographic projections are located on the central part of a triangle is generally higher than on its sides. Nonetheless, it has also been shown that the average displacement energies were similar for both atoms, which is reasonable since the two atoms have similar physical properties like mass and short-range repulsion. Moreover, for low-energy displacements, the defect types generated by recoil events along low-index crystallographic directions are mostly in a simple form of Frenkel pairs. The separation distances of Frenkel pairs in these directions are mostly around 4.8 Å at an average of 4.69 Å except those along the [100] direction, which become shorter with a small threshold energy of 10 eV and a closer distance from the initial position to a stable octahedral site. However, complex defect configurations along some high-index directions are observed, which results in higher threshold energies.
ACKNOWLEDGMENTS
This research was supported by contract #FA9453-15-1-0084 of the Air Force Research Laboratory (AFRL). DH would like to thank the Air Force Office of Scientific Research (AFOSR) for support.