Implications
Boar taint prevalence varied between farms and between batches, farm as well as slaughter related factors should be taken into account. Skin lesions and time spent in lairage may reflect aggression and stress during the hours preceding slaughter, which suggests that both ought to be minimised but this should be confirmed by further research. Lean meat percentage was found to be linked negatively with boar taint. Breeding leaner entire male pigs could help to reduce boar taint; however this might have other, less desirable effects on meat quality. There could be higher boar taint prevalence in summer.
Introduction
European pork producers have committed to stopping the practice of surgical castration of male piglets from 2018 onwards. One alternative, raising entire male pigs, is associated with the risk of commercialising meat with an undesirable taste known as boar taint. Boar taint is mainly caused by androstenone (AND) and skatole (SKA). There is also some indication that indole (IND) plays a role in boar taint, particularly at low SKA concentrations but this is not yet clear (Moss et al., Reference Mörlein, Grave, Sharifi, Bücking and Wicke1993; Claus et al., Reference Claus, Schopper and Wagner1994; Annor-Frempong et al., Reference Annor-Frempong, Nute, Whittington and Wood1997a; Rius and García-Regueiro, 2001). Androstenone is produced in the testes; SKA and IND are produced by micro-organisms in the gut (Claus et al., Reference Claus, Schopper and Wagner1994; Lanthier et al., Reference Hansen, Larsen, Jensen, Hansen-Møller and Barton-Gade2007). Few recommendations have been made about how farmers can reduce the prevalence of boar taint. Selection against boar taint is a promising route to reduce AND concentrations but this path is associated with negative effects on fertility, daily gain, drip loss and intramuscular fat (Moe et al., Reference Moe, Lien, Aasmundstad, Meuwissen, Hansen, Bendixen and Grindflek2009; Haberland et al., Reference De Kock, Heinze, Potgieter, Dijksterhuis and Minnaar2014). Previous research has indicated that boar taint prevalence may vary from farm to farm (Aluwé et al., Reference Aluwé, Tuyttens and Millet2015). In that study, only one slaughter batch was analysed per farm. The question remained whether these observed differences might be farm specific, slaughter related, animal related or all of the above. In the present study, we evaluated several factors that are measured at the time of slaughter. Some of these factors have short-term effects and have been linked only recently to boar taint (e.g. fresh skin lesions, transport duration, time spent in lairage) but some other factors that also play a role have longer-term effects such as lean meat percentage, slaughter weight and season. All factors were chosen because they are easily measured at time of slaughter and have been studied in relation with boar taint. Mörlein et al. (2012) suggested that entire male pigs that experienced longer transport duration had higher AND, SKA and IND concentrations which was supported by the findings of Wesoly et al. (Reference van Wagenberg, Snoek, van der Fels, van der Peet-Schwering, Vermeer and Heres2015). Skin lesions on the carcass (as a measure of aggressive behaviour during transport) have also been positively linked to SKA and IND (Wesoly et al., Reference van Wagenberg, Snoek, van der Fels, van der Peet-Schwering, Vermeer and Heres2015), but another study found no link (Parois et al., Reference Moss, Hawe and Walker2015), whereas no significant correlation between skin lesions, measured in the home pen, and boar taint compounds was found in yet another study (Prunier et al., 2013). Season may influence boar taint (Claus et al., Reference Borrisser-Pairó, Panella-Riera, Zammerini, Olivares, Garrido, Martínez, Gil, García-Regueiro and Oliver1983; Andersson et al., Reference Andersson, Rydhmer, Lundström, Wallgren, Andersson and Forsberg1998; Prunier et al., 2013) even though differences between seasons are not always seen (Walstra et al., Reference Van den Broeke, Aluwé, Tuyttens, Ampe, Vanhaecke, Wauters, Janssens, Coussé, Buys and Millet1999). When such a seasonal effect was seen, higher levels of AND were observed in fall, which was attributed to decreasing day length (Claus et al., Reference Borrisser-Pairó, Panella-Riera, Zammerini, Olivares, Garrido, Martínez, Gil, García-Regueiro and Oliver1983; Andersson et al., Reference Andersson, Rydhmer, Lundström, Wallgren, Andersson and Forsberg1998; Prunier et al., 2013). Higher levels of SKA have been found in summer and this has been related to higher temperature and soiling (Hansen et al., Reference Hansen, Larsen, Jensen, Hansen-Møller and Barton-Gade1994; Walstra et al., Reference Van den Broeke, Aluwé, Tuyttens, Ampe, Vanhaecke, Wauters, Janssens, Coussé, Buys and Millet1999). Slaughter weight could affect the concentration of boar taint compounds in fat, most notably AND because heavier entire male pigs tend to be older and are thus more sexually developed. Slaughter weight has been found to be correlated with SKA as well. Correlation coefficients have often been found to be positive but are either low or non-significant at commercially relevant slaughter weights (Walstra et al., Reference Van den Broeke, Aluwé, Tuyttens, Ampe, Vanhaecke, Wauters, Janssens, Coussé, Buys and Millet1999). Interactions between slaughter weight and breed have been found as well, reflecting differences in pubertal development between breeds (Walstra et al., Reference Van den Broeke, Aluwé, Tuyttens, Ampe, Vanhaecke, Wauters, Janssens, Coussé, Buys and Millet1999; Zamaratskaia and Squires, Reference Wesoly, Jungbluth, Stefanski and Weiler2009; Aluwé et al., Reference Aluwé, Millet, Bekaert, Tuyttens, Vanhaecke, De Smet and De Brabander2011). Lean meat percentage has been found to be weakly negatively correlated to boar taint compounds (Walstra et al., Reference Van den Broeke, Aluwé, Tuyttens, Ampe, Vanhaecke, Wauters, Janssens, Coussé, Buys and Millet1999). Although several factors have been evaluated in clearly defined studies, only a limited number of large-scale studies have been performed concerning boar taint prevalence on farms that account for slaughter- or farm-specific risk factors (van Wagenberg et al., 2013). Due to the low prevalence of boar taint (Aluwé et al., Reference Aluwé, Tuyttens and Millet2015), large numbers of slaughter pigs must be included in such studies. As 2010 several Belgian farmers have made the transition to keeping entire male pigs, creating an opportunity to conduct a large-scale study.
The present large-scale study of boar taint used olfactory analysis on back fat samples performed by a trained panel to: (1) estimate inter- and intra-farm variation in boar taint prevalence, (2) quantify the effect of factors measured at slaughter on boar taint and (3) evaluate the relationship between sensorial scoring by a trained olfactory panel and the concentration of boar taint components.
Material and methods
Farms and slaughter batches
From 34 participating farms located in Flanders (Belgium), boar taint prevalence was estimated for a minimum of two slaughter batches (i.e. a group of entire male pigs being delivered for slaughter on a particular day) with a minimum of 50 entire male pigs per batch and at least 1 month in between slaughter batches to ensure slaughter of different age groups (born from different sow batches). This yielded 78 slaughter batches in total. Data were collected in three slaughterhouses. Farms were randomly selected with a minimum of 16 farms/slaughterhouse. All farms always delivered their pigs to the same slaughterhouse. Data and samples were collected between October 2013 and August 2014.
Factors measured at slaughter
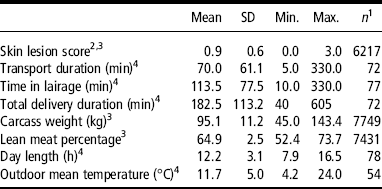
All data were collected at slaughter. The data collected at animal level included skin lesions, carcass weight and lean meat percentage (carcass data were provided by the slaughterhouses, the three slaughterhouses used three different systems, all with a calibrated function to predict lean meat percentage (Ministerial Decision, 2013): (1) the autoFOM III which corrects for carcass weight, (2) PG200 which can give slightly higher lean meat percentage for lower carcass weights, (3) VCS2000-3c, which can give a comparable effect at lower carcass weights). Skin lesions were scored at the slaughter line on the left and right side of the carcass (fresh wounds) on a four-point scale (0=zero lesion, 1=one to eight lesions, 2=nine to 24 lesions, 3⩾25 lesions) (Wesoly et al., Reference van Wagenberg, Snoek, van der Fels, van der Peet-Schwering, Vermeer and Heres2015) for the first 100 entire male pigs per slaughter batch. The left and right side scores were averaged to one lesion score per carcass. Data on slaughter batch level included time of loading at farm, arrival at slaughterhouse and time of slaughter of the first entire male pig. These times were used to calculate the transport duration, the time spent in lairage and the total delivery duration for each slaughter batch. Hours of daylight were determined from an online database for all slaughter dates (US Naval Observatory, 2015). A dummy variable was created to indicate whether at that time of year the days got shorter or longer on the slaughter date. Outdoor mean temperatures for that day were also consulted in an online database for all slaughter dates (National Centers for Environmental Information, 2015). All data except for the skin lesion score and seasonal/day-length data were obtained from the slaughterhouses (Table 1).
Summary of data collected from 34 farms from a minimum of two slaughter batches per farm (total=78)

1 Number of entire male pigs for variables on animal level, number of batches for variables on slaughter batch level.
2 Average of lesion score for left and right side of carcass (0 to 3).
3 Collected at animal level.
4 Collected at slaughter batch level.
Boar taint detection
Neck fat samples (40 g) from all entire male pigs of each slaughter batch (n=9167 entire male pigs) were collected at the end of the slaughter line. Each sample was scored for boar taint by a trained panel in a separate laboratory environment at the Institute for Agricultural and Fisheries Research using the hot iron method (Aluwé et al., Reference Aluwé, Tuyttens and Millet2015). Most of the samples were analysed on the same day. When this was not possible, samples were frozen at −20°C and analysed a few days to weeks later.
Panellist training consisted of five steps. First, eight panellists were selected for AND sensitivity using smell strips in three alternative forced choice tests (3-AFC). Second, they were taught to arrange smell strips with different AND and SKA concentrations in order of intensity. Third, they were taught to use the hot iron method on fat samples and were taught the scoring system. Fourth, they had to complete a series of 3-AFC tests with 27 fat samples of varying concentrations of AND, SKA and IND. Last, they were asked to score three replicate series of 15 fat samples each. After completing these steps without making a mistake in classifying a sample as tainted or non-tainted, a panellist was considered to be trained. In total, eight experts were trained and all participated in the trial. Panellists were made aware of the fact that boar taint is mainly due to AND, SKA and IND. They were also aware that other unknown compounds could contribute to boar taint. In the final stage of training the score given by a panellist was related to the concentrations of AND, SKA and IND and feedback was given to each panellist on how their score related to these concentrations.
The scoring system consisted of an eight-point scale (1=no aberrant odour, 2=some aberrant odour but no boar taint, 3=aberrant odour but no boar taint, 4=very light boar taint, 5=light boar taint, 6=some boar taint, 7=strong boar taint, 8=very strong boar taint). Each sample was scored by a minimum of two panellists with the average as final score. When this final score exceeded 3, the sample was considered tainted (OLF-tainted, i.e olfactory tainted). Prevalence on slaughter batch and farm level were calculated as the percentage of OLF-tainted samples.
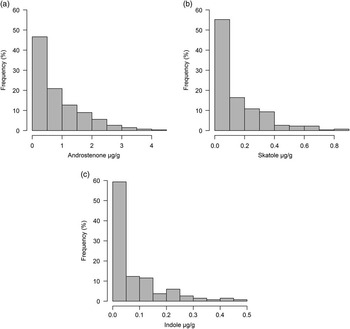
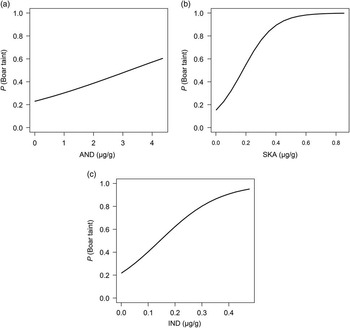
Chemical analysis was also performed to double-check the performance of the panellists. A representative batch of neck fat samples (n=254), corresponding with the full range of possible olfactory scores, was analysed using UHPLC-HR-Orbitrap-MS (Thermo Fisher Scientific, San José, CA, USA) to determine AND, SKA and IND concentrations (µg/g liquid fat) (Bekaert et al., Reference Bekaert, Bussche, François, Tuyttens, De Brabander, Vandendriessche and Vanhaecke2012b) (Figure 1). Sensitivity and specificity were calculated for the panel’s final score with the chemical analysis results as reference (at least one compound above cutoff was considered CHE-tainted, i.e. chemically tainted). Sensitivity and specificity were also calculated for the chemical analysis results with the panel’s final score as reference. For this, we set cutoffs in liquid fat, above which the sample was considered CHE-tainted (cutoff AND=2.00 µg/g, cutoff SKA=0.25 µg/g, cutoff IND=0.15 µg/g). These cutoffs were based on our own analyses as the concentration where there is a 50% chance the sample will be considered OLF-tainted by our panel (according to Figure 2).
Histograms for androstenone (a), skatole (b) and indole (c) concentrations. Analysis performed on a batch of 254 entire male pigs.

Relation between boar taint compounds and olfactory perception of boar taint for a subsample of entire male pigs with only samples where the concentration of the compounds whose relation with boar taint is not shown in the respective plot, under their respective cutoffs. (a) Regression of P (boar taint) as a function of androstenone (AND) (CHE-tainted: n=16, CHE-untainted: n=166), for samples with skatole (SKA) an indole (IND) under cutoff. (b) Regression of P (boar taint) as a function of SKA (CHE-tainted: n=25, CHE-untainted: n=166), for samples with AND an IND under cutoff. (c) Regression lines of P (boar taint) as a function of IND (CHE-tainted: n=13, CHE-untainted: n=166), for samples with AND an SKA under cutoff, and with P (boar taint) as the chance that the olfactory panel would consider an entire male carcass to be tainted.

Data analysis
In our first analysis the effect of factors measured at slaughter was investigated using univariate mixed binomial models considering mean lesion score, transport duration, time in lairage, total delivery duration, carcass weight, lean meat percentage, day length, shortening of day and outdoor mean temperature as fixed effects and farm and slaughter batch (nested in that order) as random effects and the logit P (boar taint), chance of an OLF-tainted carcass, as predicted value (based on the final score).
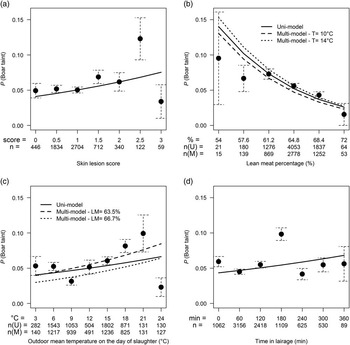
In our second analysis the effect of these same factors was investigated using a multivariate mixed binomial model with again farm and slaughter batch (nested in that order) as random effects and the logit P (boar taint), chance of an OLF-tainted carcass, as predicted value (based on the final score). This model was constructed using an ascending method on the basis of lowest P-value. The correlation between the factors was evaluated. The reason for discussing both analyses is that in the second analysis the number of samples that are considered is much lower (n=5106 in the multivariate model) due to samples with missing values for one of the variables in the model that cannot be used. To show the summarised data, several categories were constructed for each variable and these are graphically represented in Figure 3, these categories are not involved in the analysis (this was done on sample level). Each variable is divided into six to eight categories along the variable’s range, for each class the chance of having an OLF-tainted carcass was calculated as well as the number of samples.
Relation of factors measured at slaughter and boar taint (by olfactory panel) for a subsample (n) of entire male pigs for the univariate model (uni-model) and the multivariate model (multi-model) if applicable. (a) Regression line of P (boar taint) in function of mean skin lesion score (n=6217), with mean skin lesions as the average (0 to 3) given on both sides of each carcass; (b) regression line of P (boar taint) in function of lean meat percentage for the uni-model, n(U)=7431, and for the multi-model, n(M)=5106) for two outdoor mean temperature (T); (c) regression line of P (boar taint) in function of outdoor mean temperature for the uni-model n(U)=6316, and for the multi-model m(n)=5106 for two lean meat (LM) percentage values. (d) Regression line of P (boar taint) in function of time in lairage (n=8989). Dots and dotted line (summarised data not involved in the analysis): mean values and standard error for P (boar taint) with each variable divided into equidistant categories, each dot indicates the P (boar taint) for the average of the corresponding category. P (boar taint): chance that the olfactory panel would consider an entire male carcass to be tainted.

The relationship between sensorial scoring by the trained panel and the concentration of boar taint components was investigated using separate binomial models considering AND, SKA, IND as predicting variables and the logit P (boar taint) as predicted value (based on final score). This analysis was done for each compound on a further subset of the samples were only samples were considered for which the concentrations of the other compounds was below their respective cutoff. To check for interactions, three new variables were constructed signifying for each compound if it was below or over the cutoff value. Then three univariate logistic regression models to predict the P (boar taint) were set up, one for each combination of these new variables (AND and SKA; SKA and IND; and AND and IND). The included variable was each time a factor with four levels indicating if both compounds were below cutoff, if one of the two compounds was higher than the cutoff or if both compounds were higher than the cutoff. Data analysis was done in R 3.2.3 (R Core Team, Reference Parois, Prunier, Mercat, Merlot and Larzul2013) using the lme4 package (Bates et al., Reference Bates, Maechler, Bolker and Walker2015).
Results
Boar taint prevalence
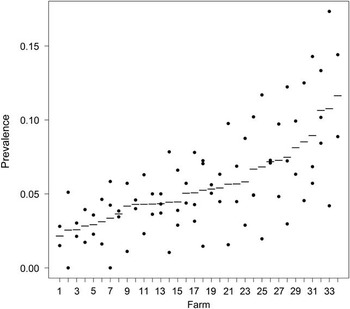
The mean prevalence (according to olfactory panel) of boar taint (of all slaughter batches per farm) on the participating farms ranged from 2.2% to 11.6% with a mean of 5.6±2.5% (Figure 4). The difference between the maximum and minimum prevalence on the various farms ranged from 0.2% to 13.1% with a mean of 4.3±3.2%. The distribution of scores was as follows: 1% to 86.46%, 2% to 6.62%, 3% to 2.38%, 4% to 1.82%, 5% to 1.34%, 6% to 0.93%, 7% to 0.38%, 8% to 0.07%, with samples having a score higher than 3 representing samples with boar taint.
Prevalence of OLF-tainted carcasses for each slaughter batch per farm (34). Each dot represents one slaughter batch from that farm. The black lines represent the average prevalence per farm.

Factors measured at slaughter
Mean skin lesions (average of scores for both sides of the carcass) (P=0.031), lean meat percentage (P<0.001) were significantly linked with the likelihood of boar taint presence. When the mean skin lesion score increased, the chance of an OLF-tainted carcass was higher (Figure 3a). Inversely, when lean meat percentage increased, the chance of an OLF-tainted carcass was lower (Figure 3b). A trend (P=0.078) towards a higher chance of boar taint with increasing outdoor mean temperature was observed (Figure 3c). Time in lairage (P=0.091) showed a trend as well, with a higher chance of boar taint as time in lairage increased (Figure 3d). Carcass weight (P=0.572), transport duration (P=0.161), total delivery duration (P=0.107), day length (P=0.677) and shortening of days (P=0.170) had no significant link with a higher chance of boar taint.
The significant factors of the multivariate model were lean meat percentage (P<0.001) and outdoor mean temperature (P=0.005) (Figure 3). The directions of the effects were the same as in the univariate analysis. Existence of multicollinearity was analysed. Lean meat percentage and carcass weight were linked (r=−0.35, P<0.001), as well as outdoor mean temperature and day length (r=0.83, P<0.001) and shortening of days (average outdoor mean temperature 10.6°C when the days get longer, 14.3°C when the days get shorter, P<0.001).
Boar taint detection
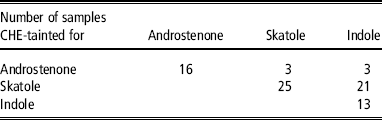
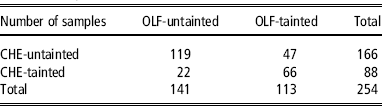
Chemical analysis indicated that 34.6% of the 254 samples were CHE-tainted, whereas according to olfactory panel 44.5% were OLF-tainted. Of the 113 samples considered positive for boar taint by the olfactory panel, chemical analysis revealed that 16.8%, 40.7%, 33.6% and 5.3% had levels above cutoff for AND, SKA, IND and all compounds, respectively. Of the 141 samples considered negative for boar taint by the olfactory panel, 7.1%, 7.1%, 4.3% and 0.7% had levels above cutoff for AND, SKA, IND and all compounds, respectively. The distribution of samples above individual and combined compound cutoffs is shown in Table 2. If we consider olfactory assessment as the reference method and chemical analysis as a predictor, sensitivity was 0.75 and specificity was 0.72. If we consider chemical analysis as the reference method and olfactory assessment as a predictor sensitivity was 0.58 and specificity was 0.84 (Table 3). In the models AND (P=0.044), SKA (P<0.001) and IND (P=0.001) had significant effects on the chance of a carcass being positive for boar taint according to the olfactory panel (Figure 2). For AND, the chance of an OLF-tainted carcass ranges from 0.2 at lowest concentration to 0.6 at highest concentration in more or less a straight line. At more or less an AND concentration of 2.0 µg/g the chance for an OLF-tainted carcass is 50%. For SKA chance of an OLF-tainted carcass ranges from 0.2 at lowest concentration to 1.0 at highest concentration but a plateau is reached at a concentration of 0.5 µg/g. At more or less a SKA concentration of 0.25 µg/g the chance for an OLF-tainted carcass is 50%. For IND the chance of an OLF-tainted carcass ranges from 0.2 at lowest concentration to 1.0 at highest concentration and a plateau is reached at this highest concentration. At more or less an AND concentration of 0.15 µg/g the chance for an OLF-tainted carcass is 50%. There was no difference in odds of an OLF-tainted sample in any of the interaction models between one compound above cutoff or two compounds above cutoff. Hence there was no significant interaction between AND and SKA, between SKA and IND or between AND and IND (Figure 5).
Mean chance of finding a tainted carcass (P (boar taint) by olfactory panel on final score) for combinations of boar taint compounds with concentration below (L) of above (H) cutoff level (respectively: 2.0, 0.25 and 0.15 µg/g) for androstenone (A), skatole (S) and indole (I); (a) combination of androstenone and skatole, (b) skatole and indole (c) androstenone and indole. In each figure the x-axis signifies respectively if both compounds are under cutoff (Lx_Ly), one of the two is over cutoff (Lx_Hy and Hx_Ly) or both are over cutoff (Hx_Hy). Were x and y represent A=AND, S=SKA or I=IND. The lines represent significant differences (*P<0.05).

Number of samples having only one compound above the threshold values (2.0, 0.25, 0.15 μg/g pure fat for androstenone, skatole and indole) when located on the diagonal, or exactly two compounds above the threshold values when located above the diagonal

Number of samples CHE-tainted for all compounds=7; number of samples CHE-tainted for none of the compounds=166.
Cross table of number of OLF- and CHE-tainted samples in the subset of samples

Discussion
Boar taint prevalence
The difference between the maximum and minimum boar taint prevalence (according to olfactory panel) within farms ranged from 0.2% to 13.1%. This indicates that boar taint prevalence is not constant across slaughter batches from the same farm and indicates that factors not related to the farm are at least as important for boar taint as farm-related factors. The overall prevalence of 5.6% is higher than in previous European studies but is still in line with the prevalence found in a previous Belgian study (3%) (Aluwé et al., Reference Aluwé, Tuyttens and Millet2015) and a Dutch study (3 to 4%) (van Wagenberg et al., 2013), and in line with a recent study reporting prevelances based on chemical analysis between 4% and 7% for Spanish farms (Borrisser-Pairó et al., Reference Borrisser-Pairó, Panella-Riera, Zammerini, Olivares, Garrido, Martínez, Gil, García-Regueiro and Oliver2016).
Factors measured at slaughter
Our results from the univariate models showed that carcasses with a higher number of newly incurred skin lesions had a higher chance of boar taint. This might be a result of elevated levels of stress and aggression related to pre-slaughter conditions (Turner et al., Reference Rius and García-Regueiro2006), which may affect SKA and IND formation (Claus et al., Reference Claus, Schopper and Wagner1994). Stress may affect colonic function or SKA-degrading enzymes. Such short-term effects before slaughter have only recently been described and further research is needed in this area (Bailey et al., Reference Bailey, Dowd, Galley, Hufnagle, Allen and Lyte2011; Maksymchuk and Chashchyn, Reference Lanthier, Lou and Squires2012; Wesoly et al., Reference van Wagenberg, Snoek, van der Fels, van der Peet-Schwering, Vermeer and Heres2015), especially as others have not found this link with skin lesions (Bekaert et al., Reference Bekaert, Aluwé, Millet, Goethals, Nijs, Isebaert, De Brabander, Verheyden, De Brabander, Vanhaecke and Tuyttens2012a; Prunier et al., 2013; Parois et al., Reference Moss, Hawe and Walker2015). Skin lesion score was no longer a significant factor in our multivariate model. However the number of samples remaining in the multivariate model containing skin lesion score, lean meat percentage and outdoor mean temperature is only a fraction (n=3709) compared with the number of observations used in the univariate models (Table 1). It is very well possible that there are not enough samples remaining to obtain the same significant link, as also the effect size is halved in this analysis for this factor.
Longer time spent in lairage was associated, as a trend, with increased chances of boar taint. This concurs with the study of Wesoly et al. (Reference van Wagenberg, Snoek, van der Fels, van der Peet-Schwering, Vermeer and Heres2015), who observed increased SKA and IND concentrations with longer pre-unloading time (time spent waiting for unloading at the slaughterhouse, which in the present study was incorporated into lairage time). Wesoly et al. (Reference van Wagenberg, Snoek, van der Fels, van der Peet-Schwering, Vermeer and Heres2015) also reported increased AND concentration in fat with longer transport duration, but in the present study, transport duration did not significantly affect the odds for boar taint as assessed by an olfactory panel. In the present study, transport durations from the same farms were similar, which could clarify the lack of a link for this factor. In the multivariate model, none of these transport related factors had a significant link. The significant factors for the univariate model influencing boar taint on the short term, suggest that boar taint research should not only focus on farm management but also on pre-slaughter conditions. Further research should therefore also evaluate the impact of several strategies to reduce stress and aggressive behaviour during transport and lairage to clarify the link of these factors with the prevalence of boar taint.
The inverse relationship between lean meat percentage and the chance for boar taint has been found previously (Walstra et al., Reference Van den Broeke, Aluwé, Tuyttens, Ampe, Vanhaecke, Wauters, Janssens, Coussé, Buys and Millet1999). Carcass leanness has an effect on fat composition, as it is positively correlated with the percentage of unsaturated fatty acids (Wood et al., Reference Walstra, Claudi-Magnussen, Chevillon, Von Seth, Diestre, Matthews, Homer and Bonneau2008). Fat composition could affect the volatilisation of AND and SKA with a direct effect on odour perception or through increased metabolism of AND and SKA (Rius et al., Reference Prunier, Brillouët, Merlot, Meunier-Salaün and Tallet2005; Mörlein and Tholen, Reference Moe, Lien, Aasmundstad, Meuwissen, Hansen, Bendixen and Grindflek2015) and thus influence olfactory perception. Possibly differences between breeds, feeds or other (unknown) factors may be responsible for the observed relation between boar taint and lean meat percentage, but these were outside the scope of the present study. Selecting for leaner entire male pigs would be a possible strategy to reduce boar taint prevalence (Lean et al., Reference Kempster, Dilworth, Evans and Fisher1972). Recent research showed that selecting towards a favourable Asp298Asn polymorphism of the melanocortin-4 receptor increases the meat percentage and reduces the boar taint risk (Van den Broeke et al., Reference Turner, Farnworth, White, Brotherstone, Mendl, Knap, Penny and Lawrence2015). However, with entire male pigs, there may already be a risk of inferior meat quality because of the high lean meat content of the carcasses. Excessive leanness leads to negative effects on juiciness, flavour and shear strength (toughness) (Kempster et al., Reference Haberland, Luther, Hofer, Tholen, Simianer, Lind and Baes1986). Fat quality can also be a problem with excessive leanness (Bañón et al., Reference Bañón, Granados, Cayuela, Gil, Costa and Garrido2000).
In the present study, carcass weight had no significant effect on the chance of occurrence of boar taint per carcass. In previous studies low but significant correlations have been found between carcass/live weight and boar taint compounds due to its link with pubertal development and AND, resulting in increased AND concentrations in fat of heavier entire male pigs (Walstra et al., Reference Van den Broeke, Aluwé, Tuyttens, Ampe, Vanhaecke, Wauters, Janssens, Coussé, Buys and Millet1999; Babol et al., Reference Babol, Squires and Gullett2002; Aluwé et al., Reference Aluwé, Millet, Bekaert, Tuyttens, Vanhaecke, De Smet and De Brabander2011). Nearly all (90%) of the samples in the present study came from carcasses between 77.1 and 113.5 kg; it is possible that these commercial slaughter weights are too high to find a significant effect on boar taint development. The results from the multivariate analysis confirmed that leanness of the animals, contrarily to carcass weight, was significantly associated with a reduced chance for a carcass to be OLF-tainted.
We hypothesised that season could have an effect on boar taint because shortening of the days can stimulate pubertal development and higher outdoor mean temperatures can affect SKA (Claus et al., Reference Borrisser-Pairó, Panella-Riera, Zammerini, Olivares, Garrido, Martínez, Gil, García-Regueiro and Oliver1983; Hansen et al., Reference Hansen, Larsen, Jensen, Hansen-Møller and Barton-Gade1994). Day length nor the shortening of day length showed a significant link, but outdoor mean temperature on the day of slaughter did show a trend in the univariate model. Previous studies showed contradictory findings relating to season and generally small effects for commercial conditions (Walstra et al., Reference Van den Broeke, Aluwé, Tuyttens, Ampe, Vanhaecke, Wauters, Janssens, Coussé, Buys and Millet1999). This could be due to differences in seasonal effects per country and per year. One hypothesis for the link with outdoor mean temperature is that it affects liver metabolism, with higher outdoor mean temperatures leading to lower degradation of SKA (Deslandes et al., Reference Deslandes, Gariépy and Houde2001). The results from the multivariate model confirm the link with outdoor mean temperature. The multivariate analysis confirmed that seasonal effects play a part in the chance of having an OLF-tainted carcass.
Boar taint detection
With a sensitivity of 0.75 and a specificity of 0.72 (chemical analysis as reference with cutoff AND=2.00 µg/g, cutoff SKA=0.25 µg/g, cutoff IND=0.15 µg/g), we consider the performance of the olfactory panel to be adequate as these results are in line with the panel performance found in previous studies on boar taint with varying values for sensitivity (0.16 to 0.61) and specificity (0.97 to 0.82) (Mathur et al., Reference Lean, Curran, Duckworth and Holmes2012; Meier-Dinkel et al., Reference Maksymchuk and Chashchyn2015). When SKA was very high (>0.4 μg/g), nearly all panellists considered the carcass as tainted, whereas when AND was high (above 4 μg/g) only 60% of the panellists considered it as tainted. This suggests that SKA is a better predictor for boar taint. When comparing the probability of considering a carcass as OLF-tainted, the difference between high AND alone and high SKA alone was not significant even though there was a numerical difference (55% v. 80%). A higher role for SKA has been found in earlier studies as well (Mathur et al., Reference Lean, Curran, Duckworth and Holmes2012; Meier-Dinkel et al., Reference Maksymchuk and Chashchyn2015). This could be due to temporal aspects as all samples were scored immediately after heating and it has been shown that AND is less volatile and more readily perceived later (De Kock et al., Reference Claus, Weiler and Herzog2001). There were no significant interactions between compounds, this suggest no additive or inhibiting effects between boar taint compounds. This is partly in contrast with studies done earlier where SKA and IND contribute to the intensity of AND, no such effect between SKA and IND is also found in these studies however (Annor-Frempong et al., Reference Annor-Frempong, Nute, Whittington and Wood1997a and Reference Annor-Frempong, Nute, Whittington and Wood1997b). This could be due to the fact of only a limited number (three each) of samples are present with a combination of boar taint compounds (AND and SKA; and AND and IND) above cutoff.
Conclusion
Boar taint prevalence differs between slaughter batches from the same farm. This indicates that factors that vary from one batch to another may have influence on boar taint. The results suggest that skin lesions and time spent in the lairage may be linked with boar taint, one hypothesis is that this is linked with aggression and stress. Also, selection for leaner pigs could help in reducing boar taint. Furthermore, in warmer periods, more tainted carcasses may need to find alternative markets. Further research is necessary to disentangle the causal relationship of these factors with boar taint.
Skatole could be the most important compound determining boar taint, with AND having a smaller influence, there seems to be a link with IND as well. A larger study with more samples analysed for boar taint compounds could shed light on these relationships.
Acknowledgements
The authors thank Roland Limpens, Myriam Audenaert, Stefan Meirlaen, Dimitry Lapage and Jurgen Devos for participating in the olfactory panel and having smelled between them thousands of back fat samples. A very special thanks goes out to Liesbeth De Wilde, who besides also participating in the panel has made countless trips to each of the slaughterhouses, often early in the morning to collect these samples and who has done all the other practical work that has made this study possible. The authors also thank Miriam Levenson for proofreading and language editing. This research was funded by a grant of the Agency for Innovation by Science and Technology (IWT120767).