INTRODUCTION
One of the most common behavioural responses of prey to a perceived predator is hiding in a refuge, such as a burrow. While guaranteeing their safety, hiding prevents prey from obtaining information about the predator's activity and the immediate level of threat it poses (Sih, Reference Sih1997; Hugie, Reference Hugie2003). In this situation the prey must decide how long to wait in its refuge before it re-emerges, entering a ‘waiting game’ with the predator.
Despite the obvious benefit of hiding, such anti-predator behaviour can also be costly, since time spent inside the refuge is traded for time spent in other essential activities, such as feeding, reproduction or defending resources (Jennions et al., Reference Jennions, Backwell, Murai and Christy2003; Wong et al., Reference Wong, Bibeau, Bishop and Rosenthal2005; Reaney & Backwell, Reference Reaney and Backwell2007). Prey's retreat time is therefore determined by the balance between the need for safety and the costs of hiding inside the refuge (Jennions et al., Reference Jennions, Backwell, Murai and Christy2003).
Many invertebrates that dwell in soft-bottom aquatic environments have adopted the anti-predator behaviour of hiding in a burrow when a potential predator is detected (Drewes & Fourtner, Reference Drewes and Fourtner1989; Wolfrath, Reference Wolfrath1992; Jennions et al., Reference Jennions, Backwell, Murai and Christy2003). Such is the case of the New Zealand mud crab Austrohelice crassa (Dana, 1851), which builds burrows in the mud and retreats into them when threatened by a predator. In this experiment, we used A. crassa as a model to study inter-individual variability in anti-predator hiding behaviour.
Austrohelice crassa (family Grapsidae) lives in quite densely populated colonies in estuarine mud flats, where it is confined between the tide marks (Beer, Reference Beer1958). The most common predators of this mud crab are herons, gulls, fish and octopods. Austrohelice crassa is a rather small crab, with a carapace width of about 2 cm and square proportions (Beer, Reference Beer1958). Mud crabs are among the largest and most active burrowers in intertidal soft sediments in New Zealand, thus they assume an important ecological role in estuarine ecosystems (Wolfrath, Reference Wolfrath1992; Morrisey et al., Reference Morrisey, DeWitt, Roper and Williamson1999; Kristensen, Reference Kristensen2008).
Some of the main activities of A. crassa take place on the mud surface: feeding on organic matter and detritus on the sediment, mate searching, courtship and mating behaviours, and defending burrow from intrusion of other crabs (Beer, Reference Beer1958). Therefore, in order to adjust their hiding times, mud crabs must accurately balance the costs and benefits of hiding to avoid predation, as hiding time is traded for time spent in surface activities.
Although numerous researchers have studied when prey should seek refuge as a response to a predator and what factors influence this, far fewer studies have asked how long prey should hide (Sih Reference Sih1997; Jennions et al., Reference Jennions, Backwell, Murai and Christy2003). Our preliminary observations indicated that there was a high variation in hiding times among A. crassa individuals. Costs and benefits of hiding in a refuge often depend on several factors that may vary among individuals, such as body size, age, sex, coloration or neighbour density, and this could result in different optimal retreat times (Jennions et al., Reference Jennions, Backwell, Murai and Christy2003; Reaney & Backwell, Reference Reaney and Backwell2007). We therefore investigated the effect of two factors on hiding behaviour: body size and the number of close neighbours. These factors are likely to influence hiding behaviour by affecting the degree of predation risk incurred by each particular crab. Body size may determine the probability of a crab being chosen as preferred prey (Jennions et al., Reference Jennions, Backwell, Murai and Christy2003). In addition, larger body size may increase the competitive ability of individuals, reducing the relative costs of longer hiding periods. Likewise, a high neighbour density may affect the costs and benefits of hiding by either increasing the competition for resources or decreasing predation risk through ‘safety in numbers’ (Foster & Treherne, Reference Foster and Treherne1981; Hager & Helfman, Reference Hager and Helfman1991; Wrona & Dixon, Reference Wrona and Dixon1991; Wong et al., Reference Wong, Bibeau, Bishop and Rosenthal2005). Indeed, a greater number of adjacent burrows within a small area may dilute the predation risk faced by any individual crab.
The aim of this study was to examine the possible influence of body size and number of neighbours on the time spent hiding inside burrows as a response to a perceived predator threat in the mud crab A. crassa. Specifically, we used a field experiment to address the following questions: (1) is there a correlation between crab body size and time spent in retreat?; and (2) is there a correlation between a crab's number of close neighbours and the time spent in retreat?
MATERIALS AND METHODS
Data were collected over three days in February 2009 (austral summer). The study area was the estuarine mouth of the MacLennan River in the Catlins region, South Island, New Zealand. A large colony of mud crabs A. crassa lives in this habitat, which is also frequented by predators such as herons (Ardea novaehollandiae).
The study site was marked with pegs on the intertidal zone of the estuary bed. The site formed a 70 × 40 m rectangular area, starting 6 m below the high tide line. During low tide, two lanes were marked with rows of coloured pegs on the survey site, as a guide for snorkelling during high tide, to avoid overlap and ensure that no burrow, i.e. no crab, would be encountered twice. Each lane was surveyed once.
During high tide, the lanes were followed by the snorkeller when water was 1–1.5 m deep. The snorkeller acted as a predatory stimulus, approaching an exposed crab at a standardized speed and angle to provoke a hiding response. Every time a crab retreated to its burrow, the hiding duration was measured with an underwater timer. Crab hiding duration was taken as the time elapsed between retreat to the burrow and total re-emergence (whole body out of the burrow). Due to time restrictions we set a maximum observational period of two minutes for each crab, therefore a value of 120 seconds was given to crabs that had not emerged from their burrow by that time. The number of crab burrows within a 30 cm radius of the focal individual was recorded and used as a measure of immediate neighbour density. The diameter of the crab's burrow entrance was measured with a ruler, and used as an estimate of crab body size. Evidence of correlation between body size and burrow entrance size in mud crabs has been documented in other studies (Wolfrath, Reference Wolfrath1992; Lim & Diong, Reference Lim and Diong2004), and here the diameter of the burrow entrance was used as a proxy for crab size.
This process was repeated with haphazardly encountered crabs along the survey area. Only crabs that clearly showed a hiding behaviour after perceiving the simulated predator threat were included in the study. Therefore, crabs that were already hiding when approached were excluded. All data were recorded on underwater slates for subsequent analysis.
Since the two studied factors—crab body size and number of close neighbours—were independent of each other (see Results), a multiple regression analysis was used to evaluate the effects of each factor on hiding time, as well as to assess which factor had a stronger influence. The statistical software Minitab15 was used to conduct all statistical analyses.
RESULTS
Throughout the experiment data were obtained for 158 crabs. The time that crabs spent hiding in their burrows after a predatory stimulus ranged between 5 and 120 seconds, with a mean of 44.3 seconds. As detailed below, hiding time was found to be significantly related to both the crab's body size and to its number of close neighbours; however, these two predictor variables were independent from each other (linear regression: N = 158, R2 = 0.01, P > 0.05).
The multiple regression analysis taking both predictor variables into account showed that there was a significant correlation between the hiding time and both the crab's body size and the number of neighbours (N = 158, R2 = 26.1%, F = 27.41, regression equation: hiding time (seconds) = 23.2 + 1.24 hole diameter (mm) − 7.81 number of neighbours). The neighbour density had a slightly more pronounced effect on retreat time than crab body size, as suggested by the regression equation in which the coefficient for number of neighbours (–7.81), had a higher absolute value than that for hole diameter (1.24). Thus, the slope of the regression line was steeper for the effect of neighbour density on hiding time than for the effect of crab body size.
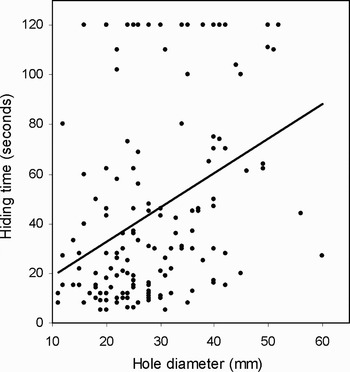
Hole diameters ranged from 11 to 60 mm. Crab size was normally distributed, with 75% of the crabs having hole diameters between 20 and 40 mm, and the majority of hole diameters ranging from 21 to 25 mm. There was a significant relationship between the hiding time and the crab's burrow diameter (multiple regression: N = 158, coefficient = 1.24; P < 0.0001). Hiding time was positively associated with crab size: larger crabs took longer to re-emerge after a predatory stimulus than smaller crabs (Figure 1).
Scatterplot of hiding times (seconds) relative to hole diameter (mm) among 158 individual mud crabs, Austrohelice crassa. Hiding times of 120 seconds were assigned to crabs that had not re-emerged by that time. Trend line obtained from independent linear regression is shown (regression equation: hiding time (seconds) = 5.05 + 1.39 hole diameter (mm)).

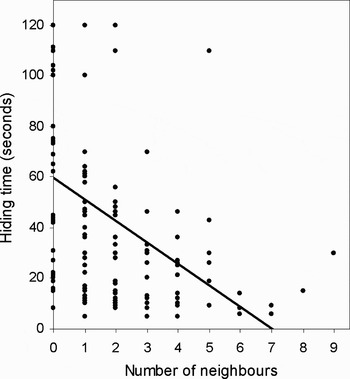
The number of close neighbours within a 30 cm radius from a crab's burrow ranged from 1 to 9 crabs. Most (72%) of the crabs had from 0 to 2 close neighbours, and very few had more than 5 neighbours. There was a significant relationship between the hiding time and the crab's number of close neighbours (multiple regression: N = 158, coefficient = –7.81; P < 0.0001). Hiding time was inversely related with the number of neighbours: crabs with more neighbours took less time to re-emerge after a predatory stimulus than crabs with fewer neighbours (Figure 2). Notably, all crabs that had not re-emerged from their burrow after 120 seconds had either only 1 or 2 close neighbours, or no neighbours at all.
Scatterplot of hiding times (seconds) relative to number of neighbours among 158 individual mud crabs, Austrohelice crassa. Hiding times of 120 seconds were assigned to crabs that had not re-emerged by that time. Trend line obtained from independent linear regression is shown (regression equation: hiding time (seconds) = 59.7 – 8.48 number of neighbours).

We also performed a multiple regression analysis excluding the crabs that had hiding times higher than 120 seconds (which were all assigned with the same hiding time), in order to confirm that our results were reliable in spite of time not being an entirely continuous variable. This analysis produced almost identical results (no changes in the P values, and an increase of only 1% in the R2 value).
DISCUSSION
Several variables can influence the time prey spend hiding in their burrows. For example, in some New Zealand grapsid crabs other than Austrohelice crassa, infection levels by parasites have been shown to alter a crab's response to risk, leading to heavily-infected crabs spending more time outside their burrows than healthy conspecifics (Latham & Poulin, Reference Latham and Poulin2001, Reference Latham and Poulin2002). Clearly, however, the individual decisions made by crabs with respect to perceived predation risk and the need to forage, defend their territory and court mates play key roles in determining hiding times. Indeed, it is generally assumed that variation in hiding times is due to prey differing in the costs and benefits of avoiding predators (Sih, Reference Sih1997; Jennions et al., Reference Jennions, Backwell, Murai and Christy2003). Our data demonstrated that hiding time from a perceived potential predator increases with crab body size and decreases with neighbour density in the mud crab A. crassa, suggesting that the net benefit of hiding is higher for larger crabs and for crabs with fewer neighbours, resulting in longer hiding times.
One reason for the positive relationship between hiding time after a predatory threat and burrow diameter may be that larger crabs are preferred prey items, since predators often target larger potential prey (Jennions et al., Reference Jennions, Backwell, Murai and Christy2003). Large crabs therefore incur greater predation risk. Because of size-biased predation risk, the net benefit of hiding increases for larger crabs resulting in longer retreat times. These results concur with the study on hiding behaviour in the fiddler crab Uca perplexa carried out by Jennions et al. (Reference Jennions, Backwell, Murai and Christy2003), which showed that hiding time increased with body size due to predators preferentially targeting larger prey.
Also, smaller crabs may have a reduced competitive ability compared to larger crabs, which forces them to be bolder and re-emerge sooner from their burrows in order to compensate for that disadvantage. Hence, the costs of hiding are higher for smaller crabs, resulting in shorter hiding times. An alternative explanation may be that crabs that tend to stay in their burrows for longer are more likely to survive recurring predatory threats and reach a higher age and size than bold crabs, resulting in a higher proportion of large crabs that are more cautious and have higher mean hiding times. However, size may not always be related to antipredator response, as shown in the study of Reany & Backwell (2007) on risk taking behaviour in the fiddler crab Uca mjoebergi, where re-emergence times were shown to be unrelated to body size.
The influence of the number of close neighbours on hiding time must reflect the benefits of living in a group, as close neighbours may reduce the risk of predation but are also competitors for resources and mates. The decrease in hiding times as the number of close neighbours increases may be an instance of a ‘dilution effect’, a common advantage of being in a group (Wrona & Dixon, Reference Wrona and Dixon1991; Hamilton, Reference Hamilton2004). By being surrounded by more crabs, the impact of a successful predator attack is diluted for any particular individual because the chances of being the selected victim are reduced. This reduced predation risk decreases the net benefit of hiding for crabs with many neighbours, allowing for shorter waiting times when hiding from a predator. However, an important potential cost of living at higher density is increased competition for resources (Wrona & Dixon, Reference Wrona and Dixon1991; Hamilton, Reference Hamilton2004). Austrohelice crassa mud crabs need to be out of their burrow in order to feed, search and court potential mates, and defend their burrow from the intrusion of neighbours. As a consequence, the costs of hiding increase for crabs that are subjected to higher competition. This, too, results in a higher pressure to re-emerge earlier rather than later in order to resume important surface activities. Therefore, both competitive pressures and a dilution effect combine to favour shorter mean hiding times in crabs that have more neighbours around their burrow.
A decrease in hiding time as a result of higher neighbour densities has also been described in other species, such as in convict cichlids (Archocentrus nigrofasciatus) (Hamilton, Reference Hamilton2004), where fish spent more time in their refuges when neighbour territories were distant than when they were nearby. This was interpreted as a result of aggregations incurring a decreased predation risk and increased competition for resources and mates, as well as increased pressure for territory defence. As in our study, the net benefit of hiding was higher for fish having fewer close neighbours, resulting in longer hiding times.
In our study, neighbour density appeared to have a slightly stronger influence on hiding time than crab size, suggesting that the advantages of ‘safety in numbers’ and dilution effects may be higher than the advantage of being small for size-selection predation, in relation to the effects on hiding time. This finding is not surprising, as it is well established that prey aggregation is a widespread and common anti-predator behaviour (Wrona & Dixon, Reference Wrona and Dixon1991; Barbosa & Castellanos, Reference Barbosa and Castellanos2005), while there is not as much evidence suggesting that size influences anti-predator behaviour.
Taken together, crab body size and the number of neighbours only explain about one-quarter of the variation in hiding times seen in this study (R2 = 26.1% in the multiple regression). Nevertheless, the adaptiveness of these effects seems clear. When a crab takes refuge in its burrow, both prey and predator enter a ‘waiting game’ in which they must decide how long to wait for the opponent to leave or re-emerge, respectively, since waiting is costly for both participants. However, the balance between costs and benefits associated with waiting will depend on the opponent's waiting time, and neither prey nor predator will have an optimal and consistent waiting time, because this would lead to a player that always chooses a slightly higher waiting time than its opponent (Hugie, Reference Hugie2003). A high variance in hiding times can therefore also be a strategy to maximize success in escape from potential predators.
Retreat duration of prey species has been shown to be influenced by demographic features other than those measured in our study. Age itself—independent of size—may influence prey reaction to predatory stimulus due to the ability of prey to learn from past experiences (Barbosa & Castellanos, Reference Barbosa and Castellanos2005). Hence, older crabs might rely on a greater experience that could reduce their tendency to re-emerge too soon. Additionally, crab sex has been identified to affect retreat duration. Male fiddler crabs typically hide for shorter times than females as a result of sexual selection, due to female crabs being attracted to males with higher ‘risk-taking’ behaviour (Reany & Backwell, 2007). Age and sex may help to explain some of the remaining variation in crab hiding times and would provide interesting avenues for further research. Nevertheless, our study contributes to the knowledge of predator avoidance behaviour by identifying two significant factors—size and neighbour density—that clearly influence hiding-time decisions in prey species.
ACKNOWLEDGEMENTS
We would like to thank the staff from the Zoology and Botany Departments of the University of Otago, with special thanks to Robert Poulin for his helpful suggestions and comments. This project was carried out as part of the ECOL313 Ecology Field Course at the University of Otago.