INTRODUCTION
Seagrass meadows are economically and ecologically valuable as disproportionately high levels of biodiversity rely on seagrass habitat for survival (Hemminga & Duarte, Reference Hemminga and Duarte2000; Beck et al., Reference Beck, Heck, Able, Childers, Eggleston, Gillanders, Halpern, Hays, Hoshino, Minello, Orth, Sheridan and Weinstein2001; Short et al., Reference Short, Polidoro, Livingstone, Carpenter, Bandeira, Bujang, Calumpong, Carruthers, Coles, Dennison, Erftemeijer, Fortes, Freeman, Jagtap, Kamal, Kendrick, Kenworthy, La Nafie, Nasution, Orth, Prathep, Sanciangco, van Tussenbroek, Vergara, Waycott and Zieman2011). Despite the importance of seagrass meadows, they have been disappearing at an alarming rate globally in recent years. One-third of the world's seagrass species are in decline and a third of all seagrass species are considered at high risk of extinction (Waycott et al., Reference Waycott, Duarte, Carruthers, Orth, Dennison, Olyarnik, Calladine, Fourqurean, Heck, Hughes, Kendrick, Kenworthy, Short and Williams2009; Short et al., Reference Short, Polidoro, Livingstone, Carpenter, Bandeira, Bujang, Calumpong, Carruthers, Coles, Dennison, Erftemeijer, Fortes, Freeman, Jagtap, Kamal, Kendrick, Kenworthy, La Nafie, Nasution, Orth, Prathep, Sanciangco, van Tussenbroek, Vergara, Waycott and Zieman2011). Disturbingly, seagrass associated species inhabit one of the most threatened ecosystems worldwide. Epifaunal abundance and diversity have been found to decline as a result of habitat loss and fragmentation associated with relatively large seagrass disturbance (Reed & Hovel, Reference Reed and Hovel2007).
Seagrass ecosystems are a key habitat for an array of organisms which rely on seagrass for food and their habitat requirements (Howard et al., Reference Howard, Edgar, Hutchings, Larkum, McComb and Shepherd1989). A considerable amount of research has focused on epibenthic species within seagrass, especially those of commercial importance (Boström et al., Reference Boström, Jackson and Simenstad2006; Gillanders, Reference Gillanders, Larkum, Orth and Duarte2006). In contrast, sessile invertebrates have been poorly documented in seagrass ecosystems (Barnes et al., Reference Barnes, Davis and Roberts2006). The assemblage of sponges and ascidians associated with seagrass is essentially unknown and often deliberately excluded from studies due to the multitude of challenges they present. They are considered to be taxonomically difficult because of their great morphological plasticity and the presence of numerous undescribed species. In addition, sponges display complex 3-dimensional growth forms that are difficult to define and quantify (Bergquist, Reference Bergquist1978; Wulff, Reference Wulff2001). Ascidians identification is also difficult as specimens often require dissection for positive identification and the prevalence of cryptic species presents an additional challenge (Davis et al., Reference Davis, Roberts, Ayre, Ponder and Lunney1999; Shenkar & Swalla, Reference Shenkar and Swalla2011).
The spatial distribution of sponges and ascidians in seagrass ecosystems has rarely been investigated (but see Lemmens et al., Reference Lemmens, Clapin, Lavery and Cary1996; Barnes et al., Reference Barnes, Davis and Roberts2006) even though this assemblage has been the subject of several manipulative experimental studies (e.g. Corriero et al., Reference Corriero, Balduzzi and Sara1989; Kuenen & Debrot, Reference Kuenen and Debrot1995; Diaz, Reference Diaz2005; Wulff, Reference Wulff2008). Descriptive studies of ecological pattern provide the starting point from which ecological explanations and theories arise. They ensure the validity of the patterns observed, and establish the scale and scope of processes operating in a specific system (Andrew & Mapstone, Reference Andrew and Mapstone1987; Underwood et al., Reference Underwood, Chapman and Connell2000). In addition, the scales at which spatial patterns are operating must be determined so as to broaden our understanding of processes involved in shaping species interactions (Underwood & Chapman, Reference Underwood and Chapman1996).
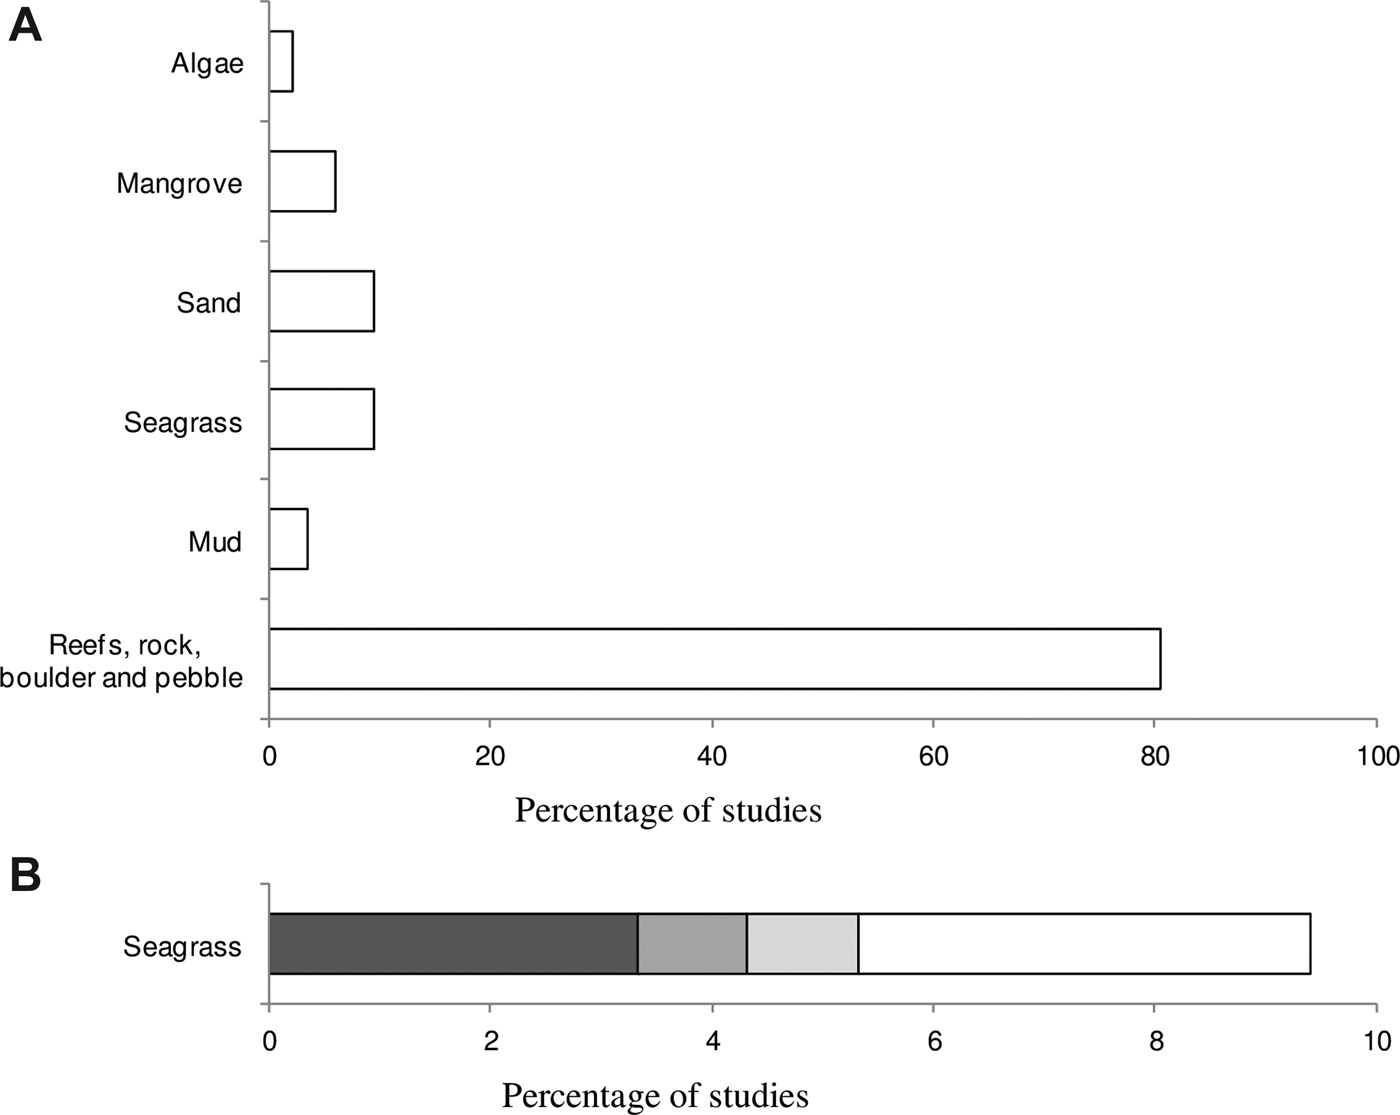
A review of papers investigating sponge processes (N = 111) revealed that sponge research primarily focuses on reefal habitats and constituted 80% of the papers investigated (Figure 1A). In contrast, papers examining sponge processes in seagrass ecosystems represented just 9% of the literature reviewed (Figure 1A). The spatial distribution of sponges in seagrass ecosystems contributed to more than half (5%) of this 9% (Figure 1B). A mere two papers focused on the sponge spatial distribution within the seagrass genus Posidonia. This was for Posidonia oceanica in the Mediterranean, and the Australian Posidonia australis (Hook f.) (Figure 1B). Importantly, the sessile epifaunal invertebrate assemblage inhabiting P. australis meadows has not been vigorously investigated despite the rapid decline of this species in Australian waters (Meehan & West, Reference Meehan and West2002; Waycott et al., Reference Waycott, Duarte, Carruthers, Orth, Dennison, Olyarnik, Calladine, Fourqurean, Heck, Hughes, Kendrick, Kenworthy, Short and Williams2009).
Compilation of peer-reviewed studies (1971–2012) expressed as a (A) percentage of studies that investigated sponge distribution patterns in different habitats and substrata and (B) percentage of studies that investigated exclusively the spatial distribution of sponges within seagrass ecosystems and two specific seagrass species. This review of 111 papers was sourced from ‘web of science’. The search string included: ‘sponge’, ‘Porifera’, ‘process’ for A and ‘seagrass’, ‘spatial’, ‘distribution’ were added to obtain B. In order to be selected, the paper had to clearly specify the habitat from which sponges were sampled. Papers that studied more than one habitat were divided into percentages of each habitat sampled for a total of 100%.  Spatial distribution within seagrass (non-Posidonia),
 Spatial distribution within Posidonia australis,
 Spatial distribution within Posidonia oceanica,
 Other seagrass studies.

The aims of this research were to (1) identify the sponge and ascidian species inhabiting P. australis meadows, (2) provide estimates of the spatial distribution patterns of this assemblage in the most extensive P. australis meadow in NSW and (3) establish if sponge and ascidian species occur consistently on certain substrata within seagrass habitats. This is the first study to comprehensively quantify the abundance, diversity and substratum used for the attachment of sessile epifaunal invertebrates inhabiting P. australis. We elected to ignore other sessile taxa (e.g. bryozoans) as they were rarely encountered in our surveys.
MATERIALS AND METHODS
Study area, study species and sampling methodology
Jervis Bay is an open embayment of ~12 400 ha situated on the south-eastern Australian coast. The prevalent seagrass species in Jervis Bay is P. australis which forms extensive meadows totalling 5.7 km2 in depths of 2–10 m (West, Reference West1990). These meadows constitute the largest continuous areas of this seagrass species along Australia's south-eastern coast (Meehan & West, Reference Meehan and West2000), and are considered some of the most pristine seagrass meadows on this coastline (West et al., Reference West, Larkum, King, Larkum, McComb and Shepherd1989; Kirkman et al., Reference Kirkman, Fitzpatrick, Hutchings, Cho, Georges and Stoutjesdijk1995).
When compared with other seagrass species, Posidonia meadows have a long lifespan and a low turnover rate (West & Larkum, Reference West and Larkum1979; Hemminga & Duarte, Reference Hemminga and Duarte2000). Posidonia australis is particularly prone to anthropogenic disturbances due to its specific habitat requirements (West et al., Reference West, Larkum, King, Larkum, McComb and Shepherd1989; Den Hartog & Kuo, Reference Den Hartog, Kuo, Larkum, Orth and Duarte2006) and its low likelihood of recovery following disturbance (Clarke & Kirkman, Reference Clarke, Kirkman, Larkum, McComb and Shepherd1989; Gobert et al., Reference Gobert, Cambridge, Velimirov, Pergent, Lepoint, Bouquegneau, Dauby, Pergent-Martini, Walker, Larkum, Orth and Duarte2006). It is currently listed as a threatened ecosystem in NSW with endangered populations in the Sydney region (Fisheries Management Amendment (Threatened Species Conservation) Order (No 1) 2010 of the NSW Fisheries Management Act).
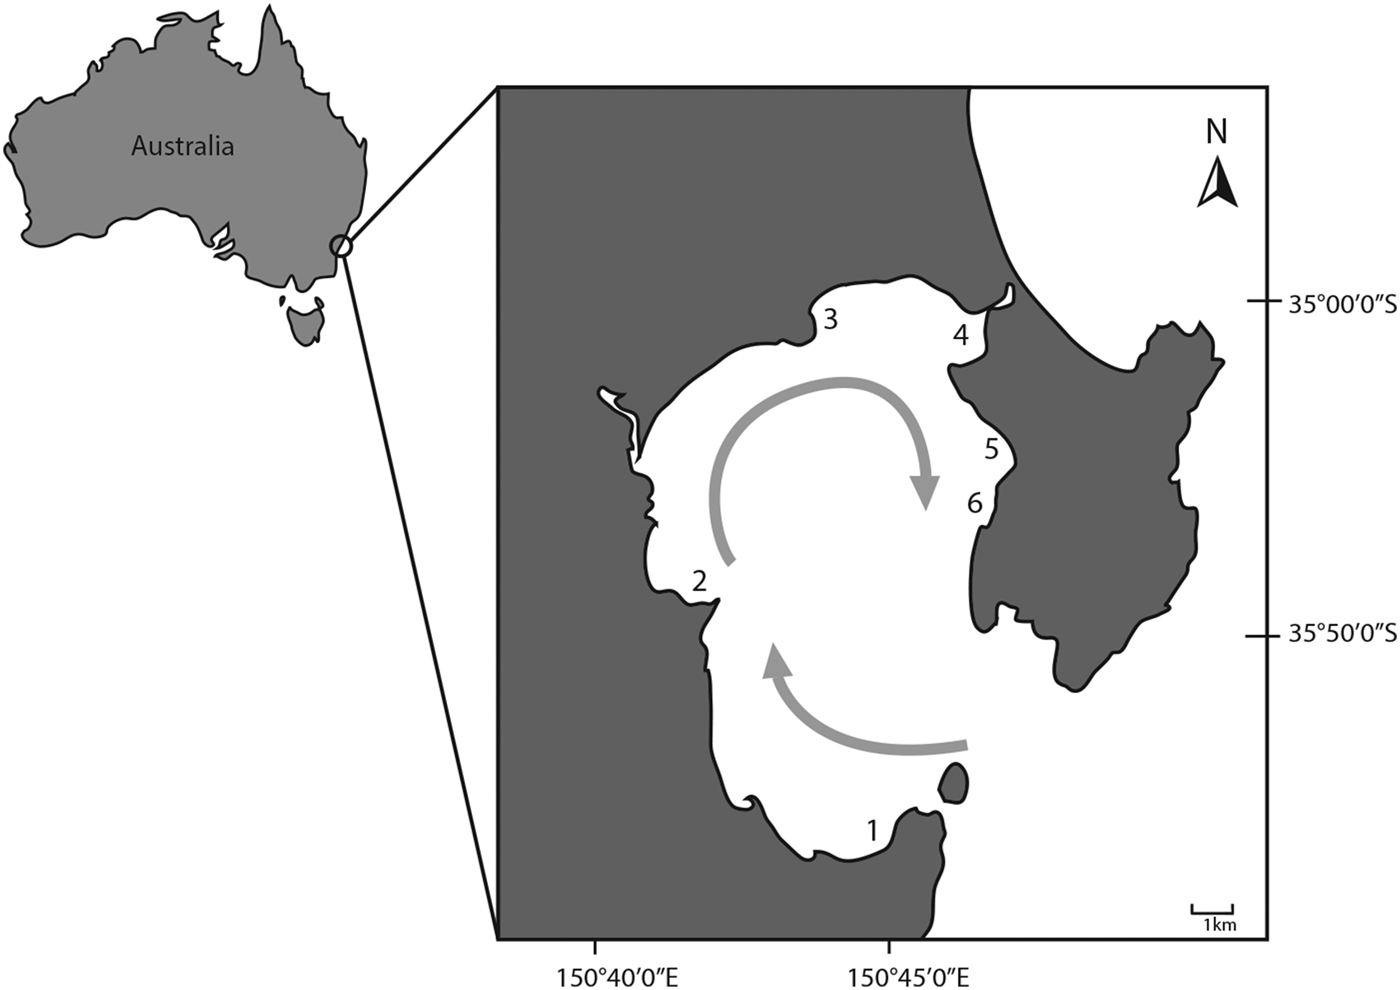
Seagrass meadows were sampled at six locations in Jervis Bay Marine Park (Figure 2). These were Bindijine Beach (35°03′12S 150°46′41E), Booderee Waters (35°07′44S 150°44′59E), Callala Bay (35°00′09S 150°43′39E), Hare Bay (35°00′31S 150°45′59E), Long Beach (35°01′55S 150°47′03E) and Plantation Point (35°04′16S 150°41′36E) (Figure 2). Seagrasses in most locations in Jervis Bay have not been extensively affected by anthropogenic disturbances except for Callala Bay and Long Beach. Callala Bay has suffered substantial damage from boat moorings in recent decades (Demers et al., Reference Demers, Davis and Knott2013), while the northern end of Long Beach is a popular anchoring area where seagrass is sparse and absent in places (authors’ personal observations). Sampling locations differ in their exposure to wind, wave and current regimes, nutrient input and water temperature. By sampling areas with varying environmental conditions, we sought to capture the entire spectrum of sponge diversity within the seagrass meadows of Jervis Bay.
Jervis Bay, showing each of the six locations we sampled: (1) Booderee Waters, (2) Plantation Point, (3) Callala Bay, (4) Hare Bay, (5) Long Beach and (6) Bindijine Beach. The prevalent clockwise gyre, important in nutrient circulation in the embayment, is indicated by the grey arrow (Wang & Wang, Reference Wang and Wang2003).
In situ sampling by scuba divers was used to determine the abundance, diversity and volume of sponges and ascidians as well as the substratum to which they were attached within P. australis meadows. We sampled between November 2011 and February 2012 at the six locations (km apart) which were divided into two sites (100s m apart) where we haphazardly sampled six transects (10s m apart) (N = 6). Our data provide a snapshot of sessile invertebrate diversity and abundance, as we did not sample locations more than once.
Abundance was measured by recording the number of sessile invertebrates encountered within 25 m2 transects (25 × 1 m) haphazardly placed in the meadow. A sponge individual was defined as a singular physiologically independent entity (Wulff, Reference Wulff2001). Individuals smaller than 1 cm3 were treated as recruits and were excluded from this study. Sponges and ascidians with at least 50% of their body located within the transect were included. Individuals located under substrata or buried in sand were sampled by turning the substratum over and fanning the sand to expose as much of the animal as possible.
We also quantified the number of species present within each transect to the lowest taxonomic level possible, and later confirmed this by examining spicule mounts. Volume (cm3) was estimated by measuring the maximum height, width and thickness of each individual. These measures were taken at 90° angles from each other to cover all three planes of view (x, y, z vectors). In order to provide a precise estimate of the size of unevenly shaped individuals, ‘branches’ or ‘extensions’ were measured separately. Two taxa were combined for the purpose of this study, Haliclona spp. comprised two species Haliclona (Gellius) and Haliclona (Haliclona) which were indistinguishable in the field.
The substratum on which each individual occurred was also recorded. Substrata were grouped into categories; these were (1) shells, (2) components of P. australis and (3) polychaete tubes (Figure 3). Shells encompassed various calcium carbonate structures, mainly bivalve clumps including the mussel Trichomya hirsuta and the flat oyster Ostrea angasi. The P. australis components comprised the entire plant including the leaf blade, sheath and rhizomes. These three seagrass components were grouped because sponge individuals generally overgrew all of these components (authors’ personal observations). Polychaete tubes are flexible branched structures constructed and permanently inhabited by Eunicid polychaete worms. These tube-dwelling worms were previously found to be distributed in clusters in the soft sediment habitats of Jervis Bay (Anderson et al., Reference Anderson, Brooke, Radke, McArthur and Hughes2009). Sponges occurred on the outer surface of these tubes along with other organisms such as algae, crinoids and molluscs (author's personal observations). Minor substrata included boulders, objects (manmade objects such as a concrete block and natural objects such as branches), other invertebrates (ascidians and sponges) and algae, while in a few cases sponges were unattached (free living). These highly infrequent substratum categories were not included in our analysis.
(A) Sponges and hydroids occupying a Eunicid polychaete worm tube located outside of the P. australis meadow. Note the other worm tubes in the background (scale is 10 cm). (B) Multiple sponge species inhabiting a single Eunicid polychaete worm tube (scale is 3 cm). (C) Callyspongia (Toxochalina) sp. 1 attached to the sheath and frond of P. australis (scale is 5 cm). (D) Encrusting Phoriospongia sp. 2. growing on shells (scale is 1 cm). (E) Botrylloides leachi growing on the sheath and frond of P. australis (scale is 5 cm). (F) Bivalve clump (Trichomya hirsuta) bearing multiple sponge species (scale is 4 cm).
Statistical analyses
A fully nested analysis of variance (ANOVA) was used to assess the levels of variation for each of the variables sampled (GMAV5, University of Sydney). Two factors were analysed: Location was a random orthogonal factor with six levels (Bindijine Beach, Booderee Waters, Callala Bay, Hare Bay, Long Beach, Plantation Point); Site was a random factor with two levels and was nested within Location. Six transects were sampled at each site and constituted replicates.
Variances were tested for homogeneity using Cochran's C-test and normality of the data were assessed visually as recommended by Quinn & Keough (Reference Quinn and Keough2002). The data were transformed using double square root (x0.25) to minimize the effect of skewed distributions (Quinn & Keough, Reference Quinn and Keough2002). In the case of heterogeneous data, the analyses were still performed since ANOVA is robust to heterogeneity with balanced experimental designs and large numbers of replicates (Underwood, Reference Underwood1997). We used Student-Newman-Keuls (SNK) tests for a posteriori comparisons where factors were significant (α ≤ 0.05). The use of a balanced design and adequately transformed data allowed for moderate non-normality in our data resulting from patchily distributed taxa (McGuinness, Reference McGuinness2002).
Multivariate techniques were used to examine patterns in the composition of sessile epifaunal invertebrates at different locations in Jervis Bay (PRIMER 6, Plymouth Marine Laboratory). Differences in the abundance and volume of each species among sites were tested using nested multivariate PERMANOVAs (Anderson, Reference Anderson2001) on Bray–Curtis dissimilarities calculated from untransformed data with the same statistical design as the ANOVA. So as to avoid undefined resemblance matrix values, transects lacking sponges or ascidians were removed (Callala Bay site 2 Transect 2, 3, 4, 5 and 6, Booderee Waters site 1 Transect 6 and site 2 Transect 6). Thus, seven transects out of 72 were removed. Non-metric multidimensional scaling (nMDS) ordinations were used to graphically illustrate the patterns of distribution. The data were pooled for each site to provide a centroid based on Bray–Curtis Similarity measures.
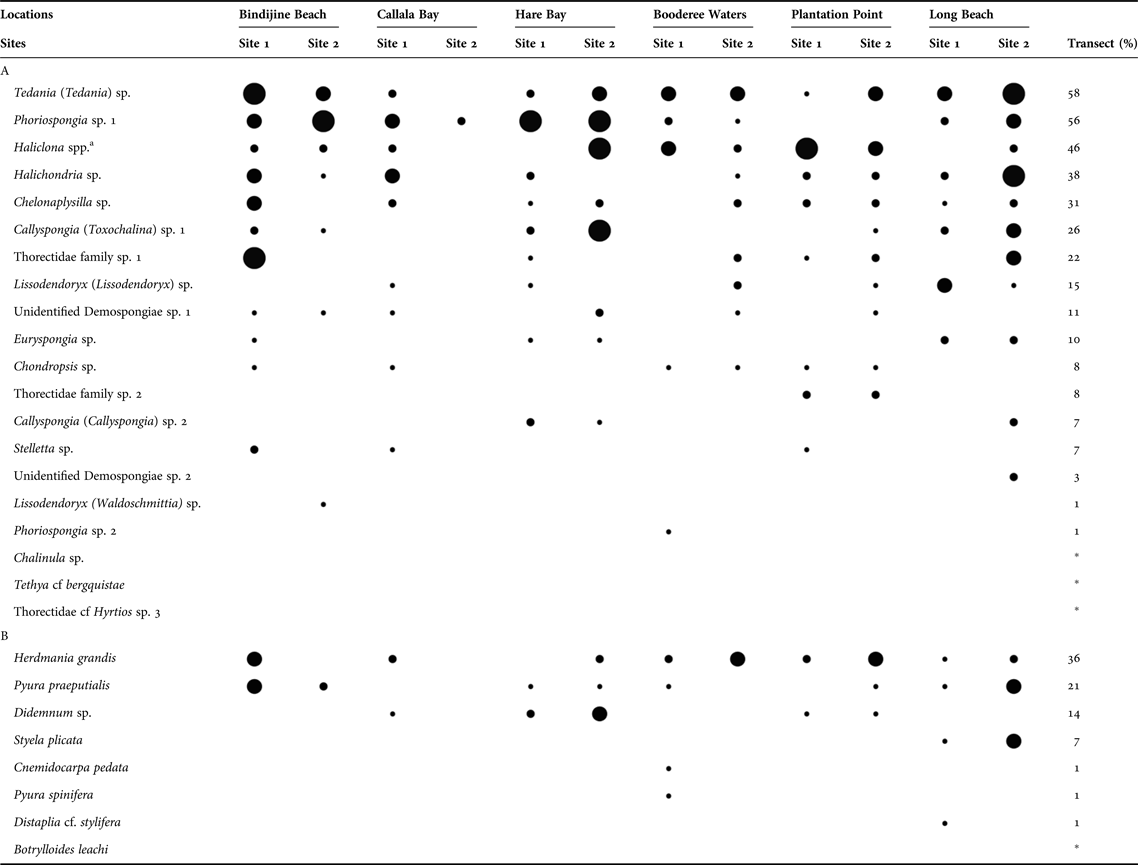
The most widespread species were determined using the number of transects per site, from a total of six transects (Table 1). The percentage of ‘rare’ species was calculated as per Hooper & Kennedy (Reference Hooper and Kennedy2002). They defined ‘rare’ species as those occurring at two sites or less.
Number of transects where (A) sponge and (B) ascidian individual species were present out of six transects for each of the two sites at each of the six locations. Species were organized in descending order based on their percentage of occurrence pooled across sites (N = 72).
a This is a complex of species including Haliclona (Gellius) and Haliclona (Haliclona).
* Taxa encountered outside the transects sampled.
 = 1,
 = 2–3,
 = 4–5,
 = 6 transects.
RESULTS
Overall patterns of diversity and abundance
We encountered 20 sponge and eight ascidian species in the P. australis meadows of Jervis Bay. A total of 1110 sponge individuals and 119 ascidian individuals were recorded. The most widespread sponge species recorded were Tedania (Tedania) sp., Phoriospongia sp. 1 and Haliclona spp. (Table 1). Sponge species were patchy in their distribution with the most common species occurring at 58% of the transects sampled (Table 1). Approximately half the sponge species (47%) were found at five or more locations of the six locations sampled (Table 1). Species that occurred at two sites or less were deemed ‘rare’ and represented 57% of ascidians and 24% of sponges sampled. The most widespread species were also the most abundant and the largest. The five most abundant taxa were Phoriospongia sp. 1 (27% of individuals encountered), Haliclona spp. (21%), Callyspongia (Toxochalina) sp. 1 (15%), Tedania (Tedania) sp. (14%) and Halichondria sp. (5%). These species also provided the largest contribution to the total sponge volume sampled, Tedania (Tedania) sp. (32%), Phoriospongia sp. 1 (20%), Haliclona spp. (17%), Halichondria sp. (10%) and Callyspongia (Toxochalina) sp. 1 (6%).
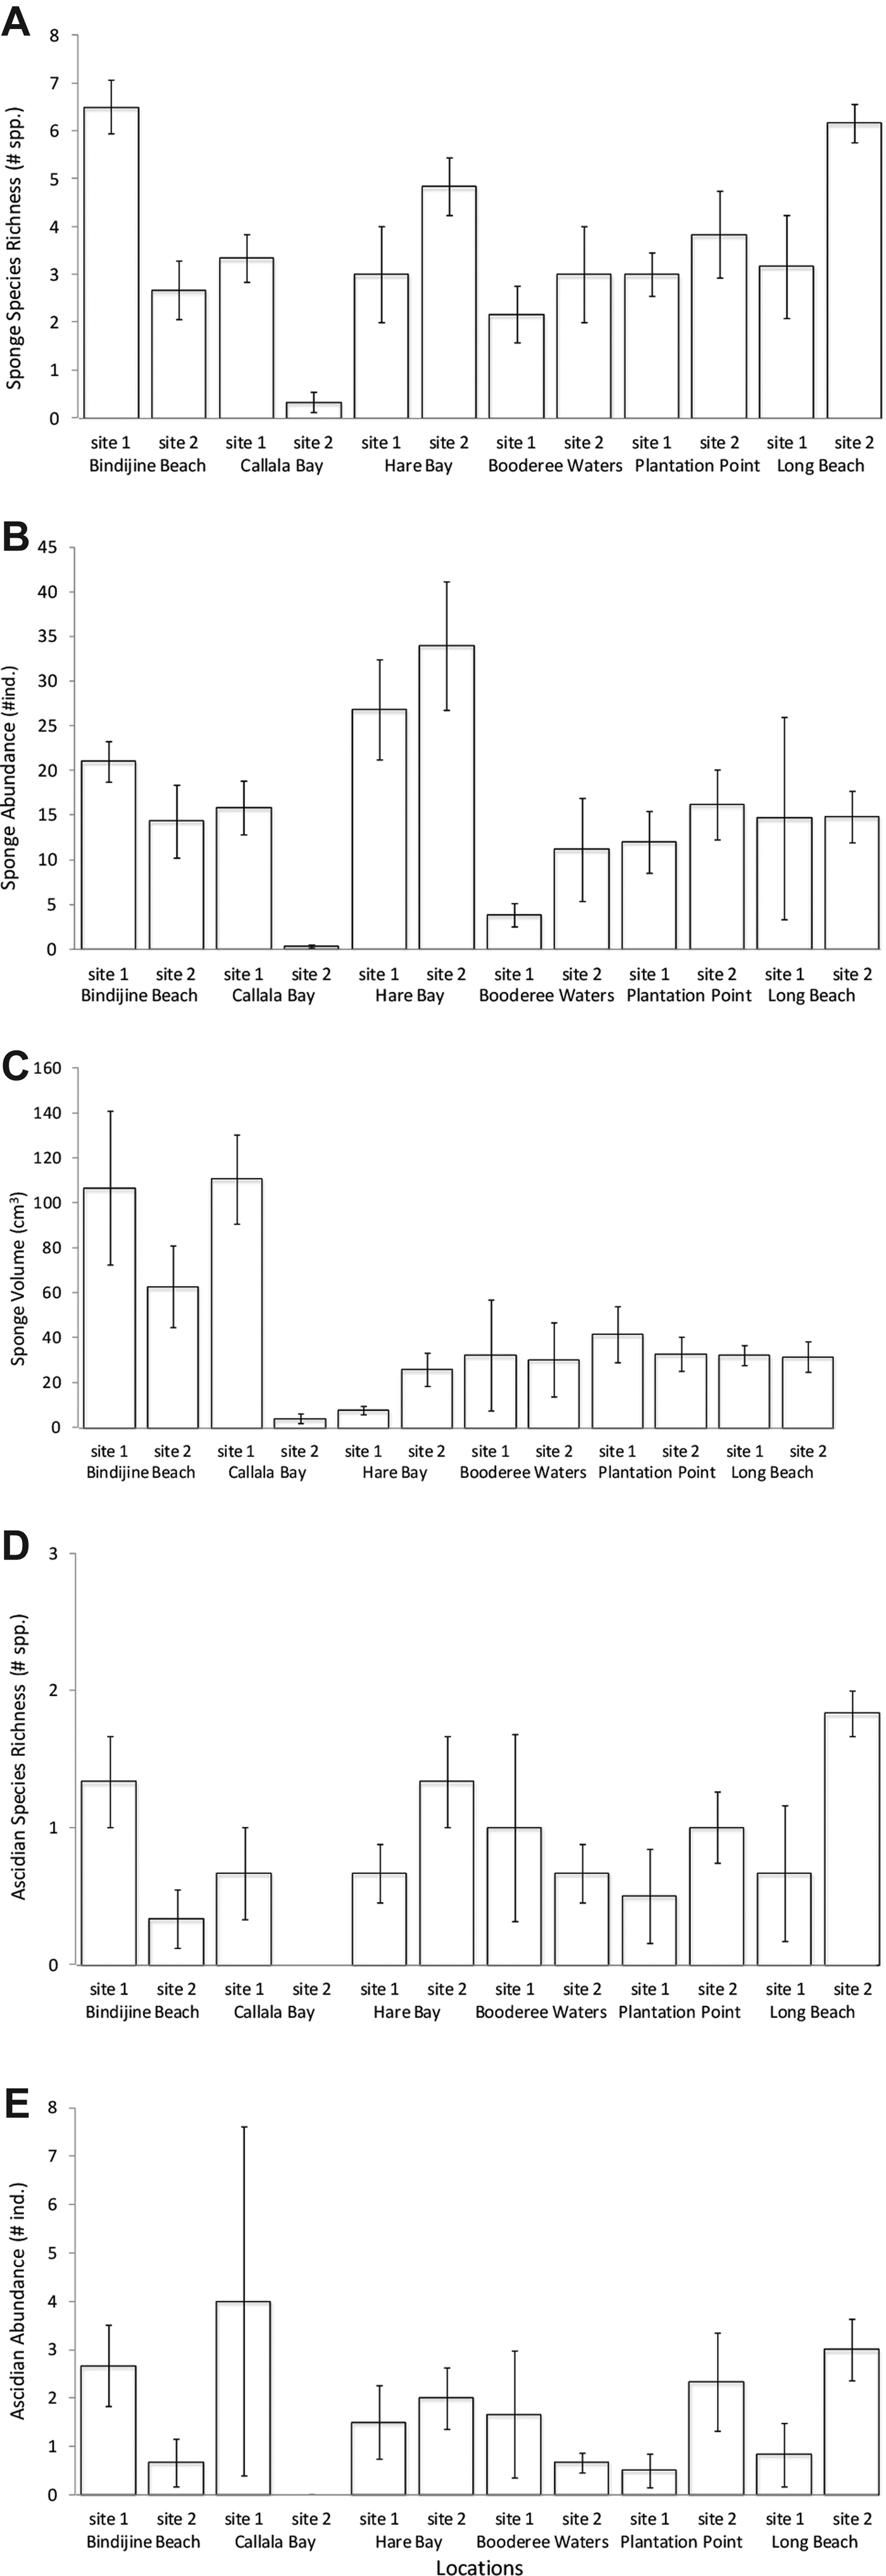
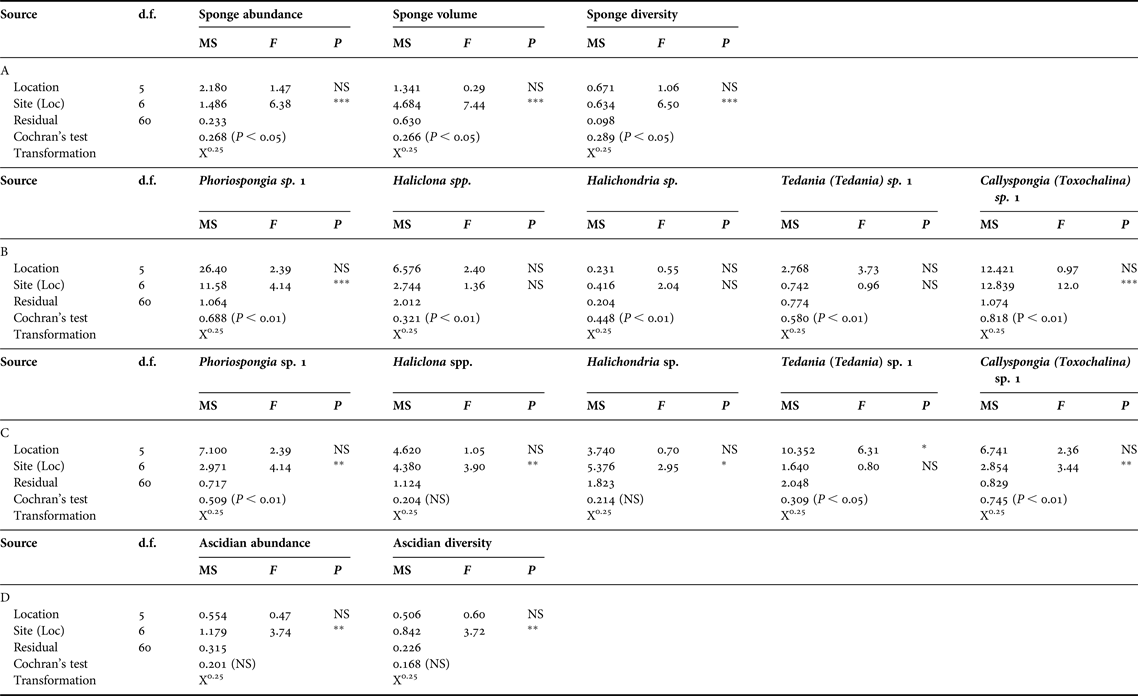
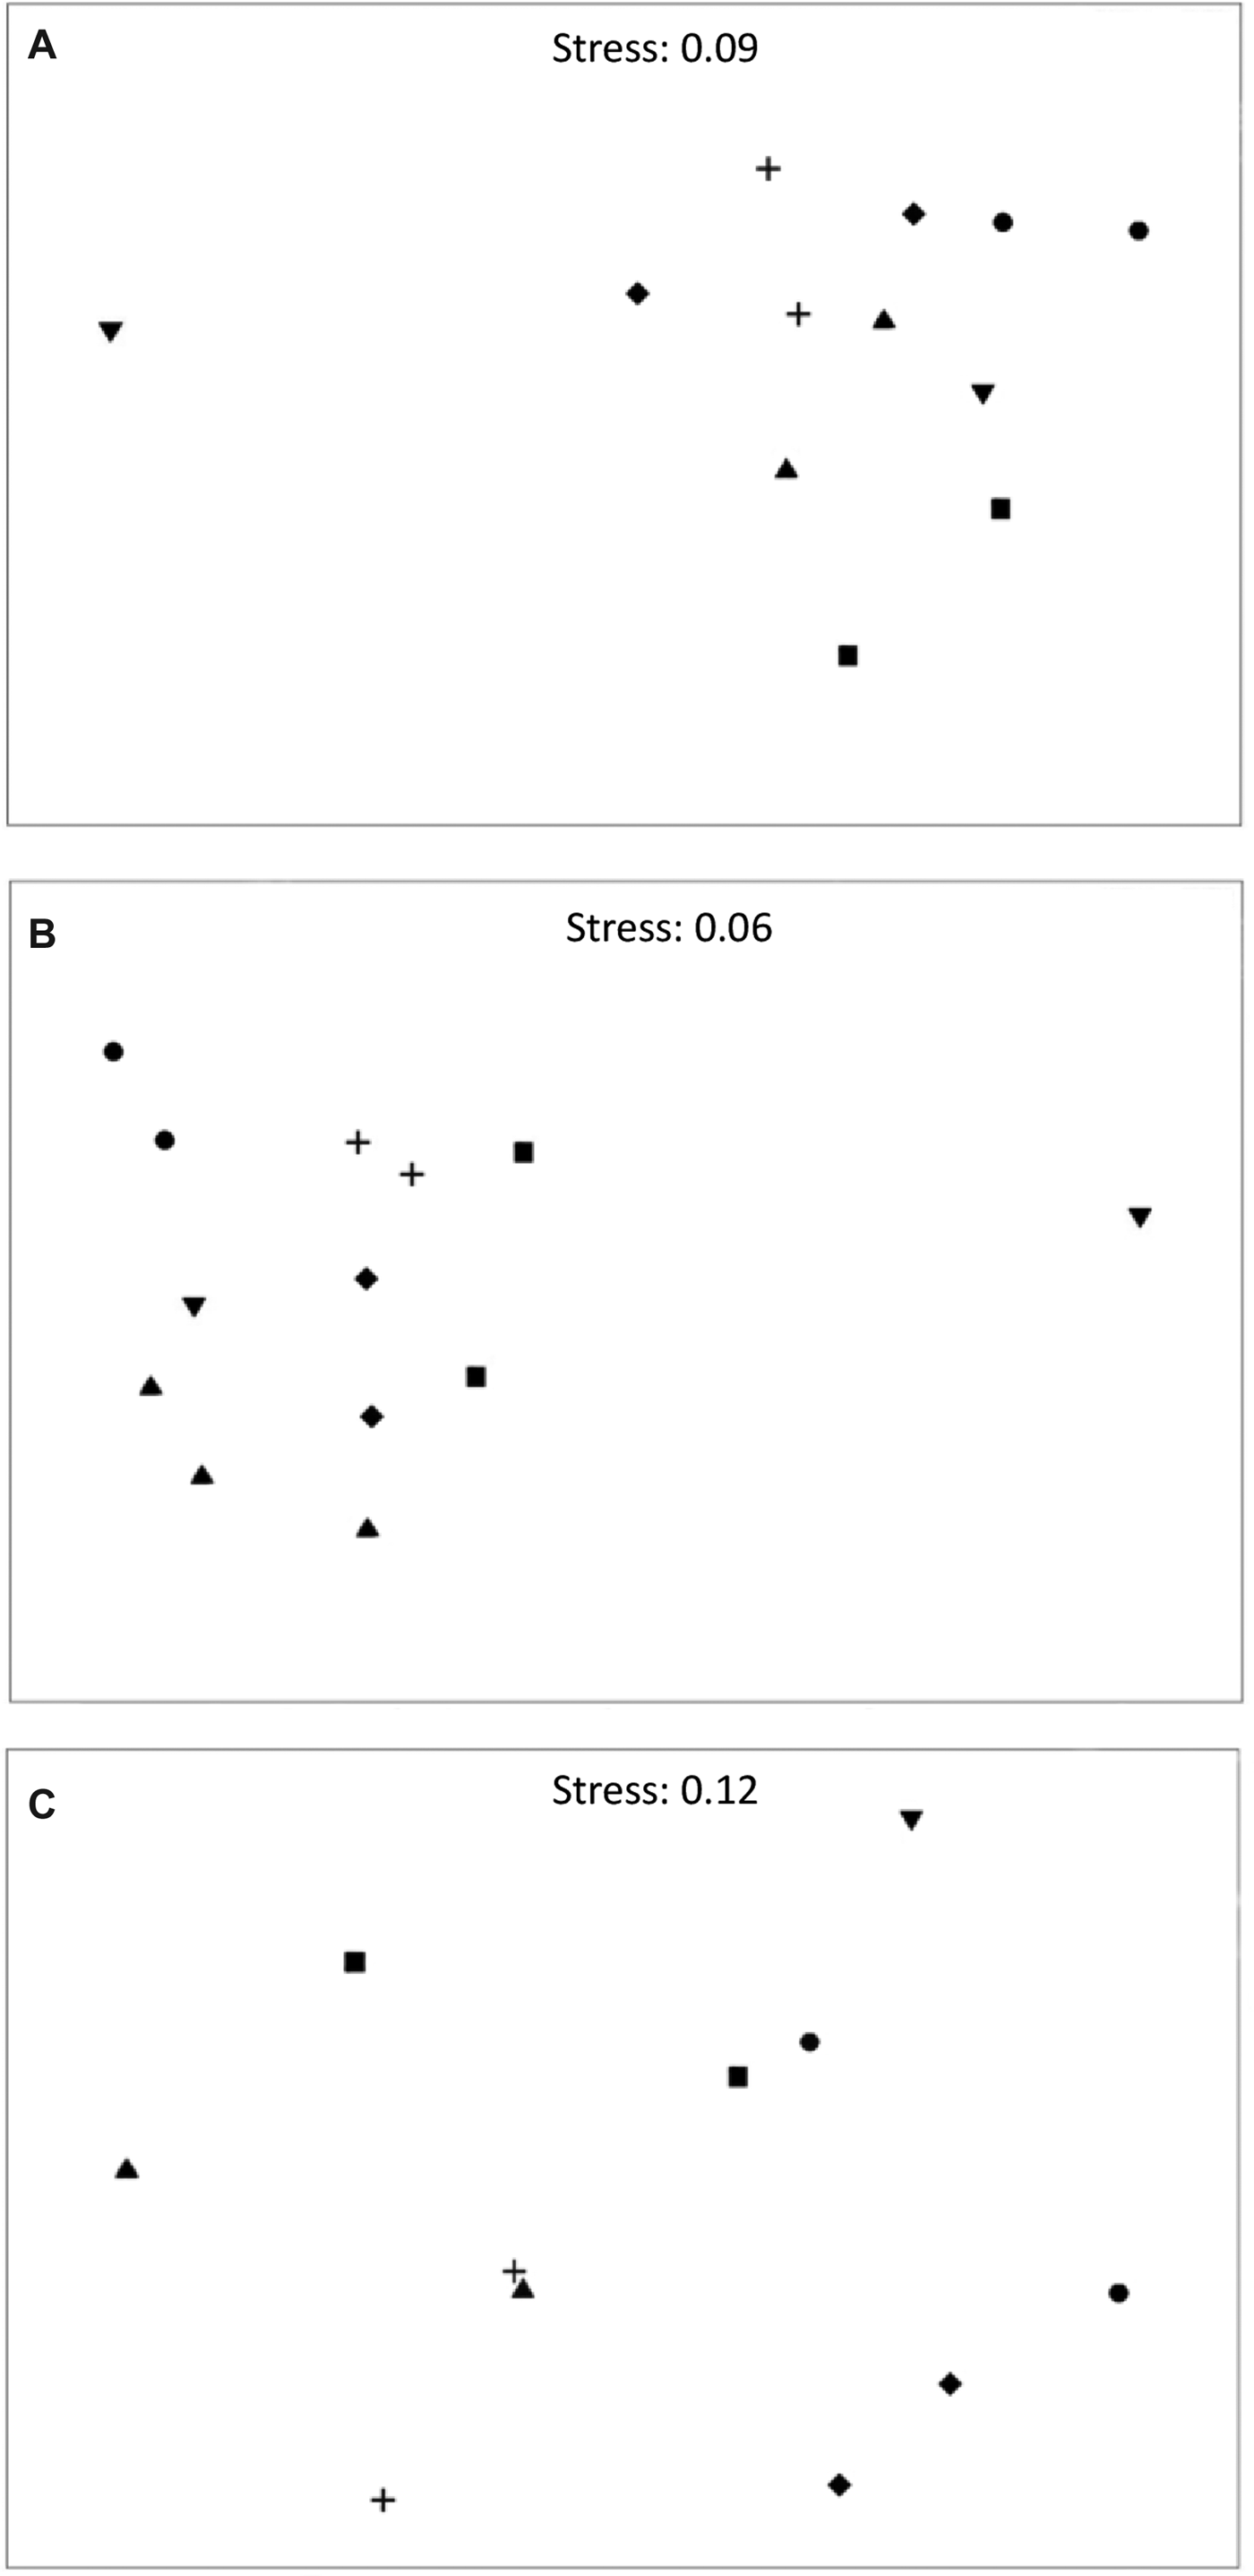
Sponge abundance was averaged over six transects (150 m2) at each site and varied by an order of magnitude across sites; it was greatest at Hare Bay site 2 with a mean of 34 ± 7 individuals ( ${\bar{\rm x}} \pm {\rm SE}$) and lowest at Callala Bay site 2 (0.33 ± 0.21 individual). Patterns of abundance were similar among sites in Jervis Bay, except for Callala Bay which had a significantly greater abundance at site 1 than that at site 2 (Figure 4A, Table 2A, SNK: Callala Bay site 1 > site 2). The multivariate analysis detected significant differences in sponge abundance among sites and locations (Figure 5, Table 3). The nMDS plots (stress 0.09) clearly showed similarity in the assemblages among sites within most locations and that Callala Bay site 2 differed from the other sites in Jervis Bay (Figure 5A).
Comparison of sponge and ascidian species richness abundance and volume at the two sites sampled for each of the six locations within Jervis Bay. (A) mean (±SE) estimates of sponge diversity expressed as number of species present per site. (B) mean (±SE) estimates of sponge abundance expressed as number of individuals per site. (C) mean (±SE) estimates of sponge volume expressed as cm3 per site. (D) mean (±SE) estimates of ascidian diversity expressed as number of species present per site. (E) mean (±SE) estimates of ascidian abundance expressed as number of individuals per site. Each bar represents a mean of 6 transects each of 25 m2 (N = 6).
Analyses of variance comparing variation among locations and sites for (A) overall sponge abundance, volume and diversity, (B) abundance of five main sponge taxa, (C) volume of five main sponge taxa, (D) ascidian abundance and diversity. NS P > 0.05; *P < 0.05; **P < 0.01; ***P < 0.001.
Non-metric multidimensional scaling (nMDS) plots for centroids of (A) sponge abundance (B) sponge volume (C) ascidian abundance for each species among sites. The data were pooled to provide a centroid for each site based on Bray–Curtis Similarity measures. Callala Bay site 2 was removed from (C).  Bindijine Beach,
 Callala Bay,
 Hare Bay,
 Booderee Waters,
 Plantation Point,
 Long Beach.
Summary of the two factor nested PERMANOVA for sponge abundance, sponge volume and ascidian abundance of each species among sites and locations in the seagrass meadows of Jervis Bay. Factors were locations with six levels (random) and sites nested in locations with two levels (random). Transects at each sites served as replicates. Analysis was based on Bray–Curtis dissimilarities with permutation of the raw data. NS P > 0.05; *P < 0.05; **P < 0.01; ***P < 0.001.
Sponge volume varied by two orders of magnitude among sites; it was greatest at Callala Bay site 1 (110.63 ± 19.90 cm3) and Bindijine Beach site 1 (106.57 ± 34.20 cm3). Sponge volume was lowest at Callala Bay site 2 (4 ± 2 cm3). There was little difference in sponge volume across sites, with the exception of Callala Bay which, again, showed a significantly greater volume at site 1 (Figure 4B, Table 2A, SNK: Callala Bay site 1 > site 2). PERMANOVA confirmed that significant differences existed among sites and locations (Table 3). The nMDS (stress 0.06) supported this pattern as there was consistent separation between assemblages among locations and clustering at the site level. It also clearly showed that Callala Bay site 2 was an outlier (Figure 5B).
Sponge species richness across sites was greatest at Bindijine Beach site 1 (6.5 ± 0.33 species) followed by Long Beach site 2 (6.17 ± 0.17 species). The lowest mean sponge diversity was measured at Callala Bay site 2 (0.33 species). Sponge diversity also significantly differed between Callala Bay site 1 and site 2 (Figure 4C, Table 2A, SNK: Callala Bay site 1 > site 2).
Ascidians inhabiting the seagrass meadows of Jervis Bay were also patchy in their distribution. The three most widespread species were Herdmania grandis, Pyura praeputialis and Didemnum sp. (Table 1). Ascidians were patchily distributed given that they occurred at 1–36% of the transects sampled (Table 1). In addition, half the species sampled occurred within a single transect (57%). Ascidian abundance was highest at Callala Bay site 1 (4 ± 3.6 individuals) and lowest at Callala Bay site 2 (Figure 4D). Ascidian abundance differed significantly between sites at Bindijine Beach, Callala Bay, Plantation Point and Long Beach (Figure 4C, Table 2D, SNK: Bindijine Beach and Callala Bay site 1 > site 2; Plantation Point and Long Beach site 1 < site 2). The multivariate analysis and nMDS plot (stress 0.12) showed significant differences in ascidian abundance among sites and locations (Figure 5C, Table 3). Callala Bay site 2 was removed from the nMDS to display the remaining sites more clearly. Ascidian diversity across sites was highest at Long Beach site 2 (1.83 ± 0.37 species). A significant difference in species richness was recorded between sites at Long Beach (Figure 4D, Table 2D, SNK: Long Beach site 1 < site 2).
Patterns of abundance; individual taxa
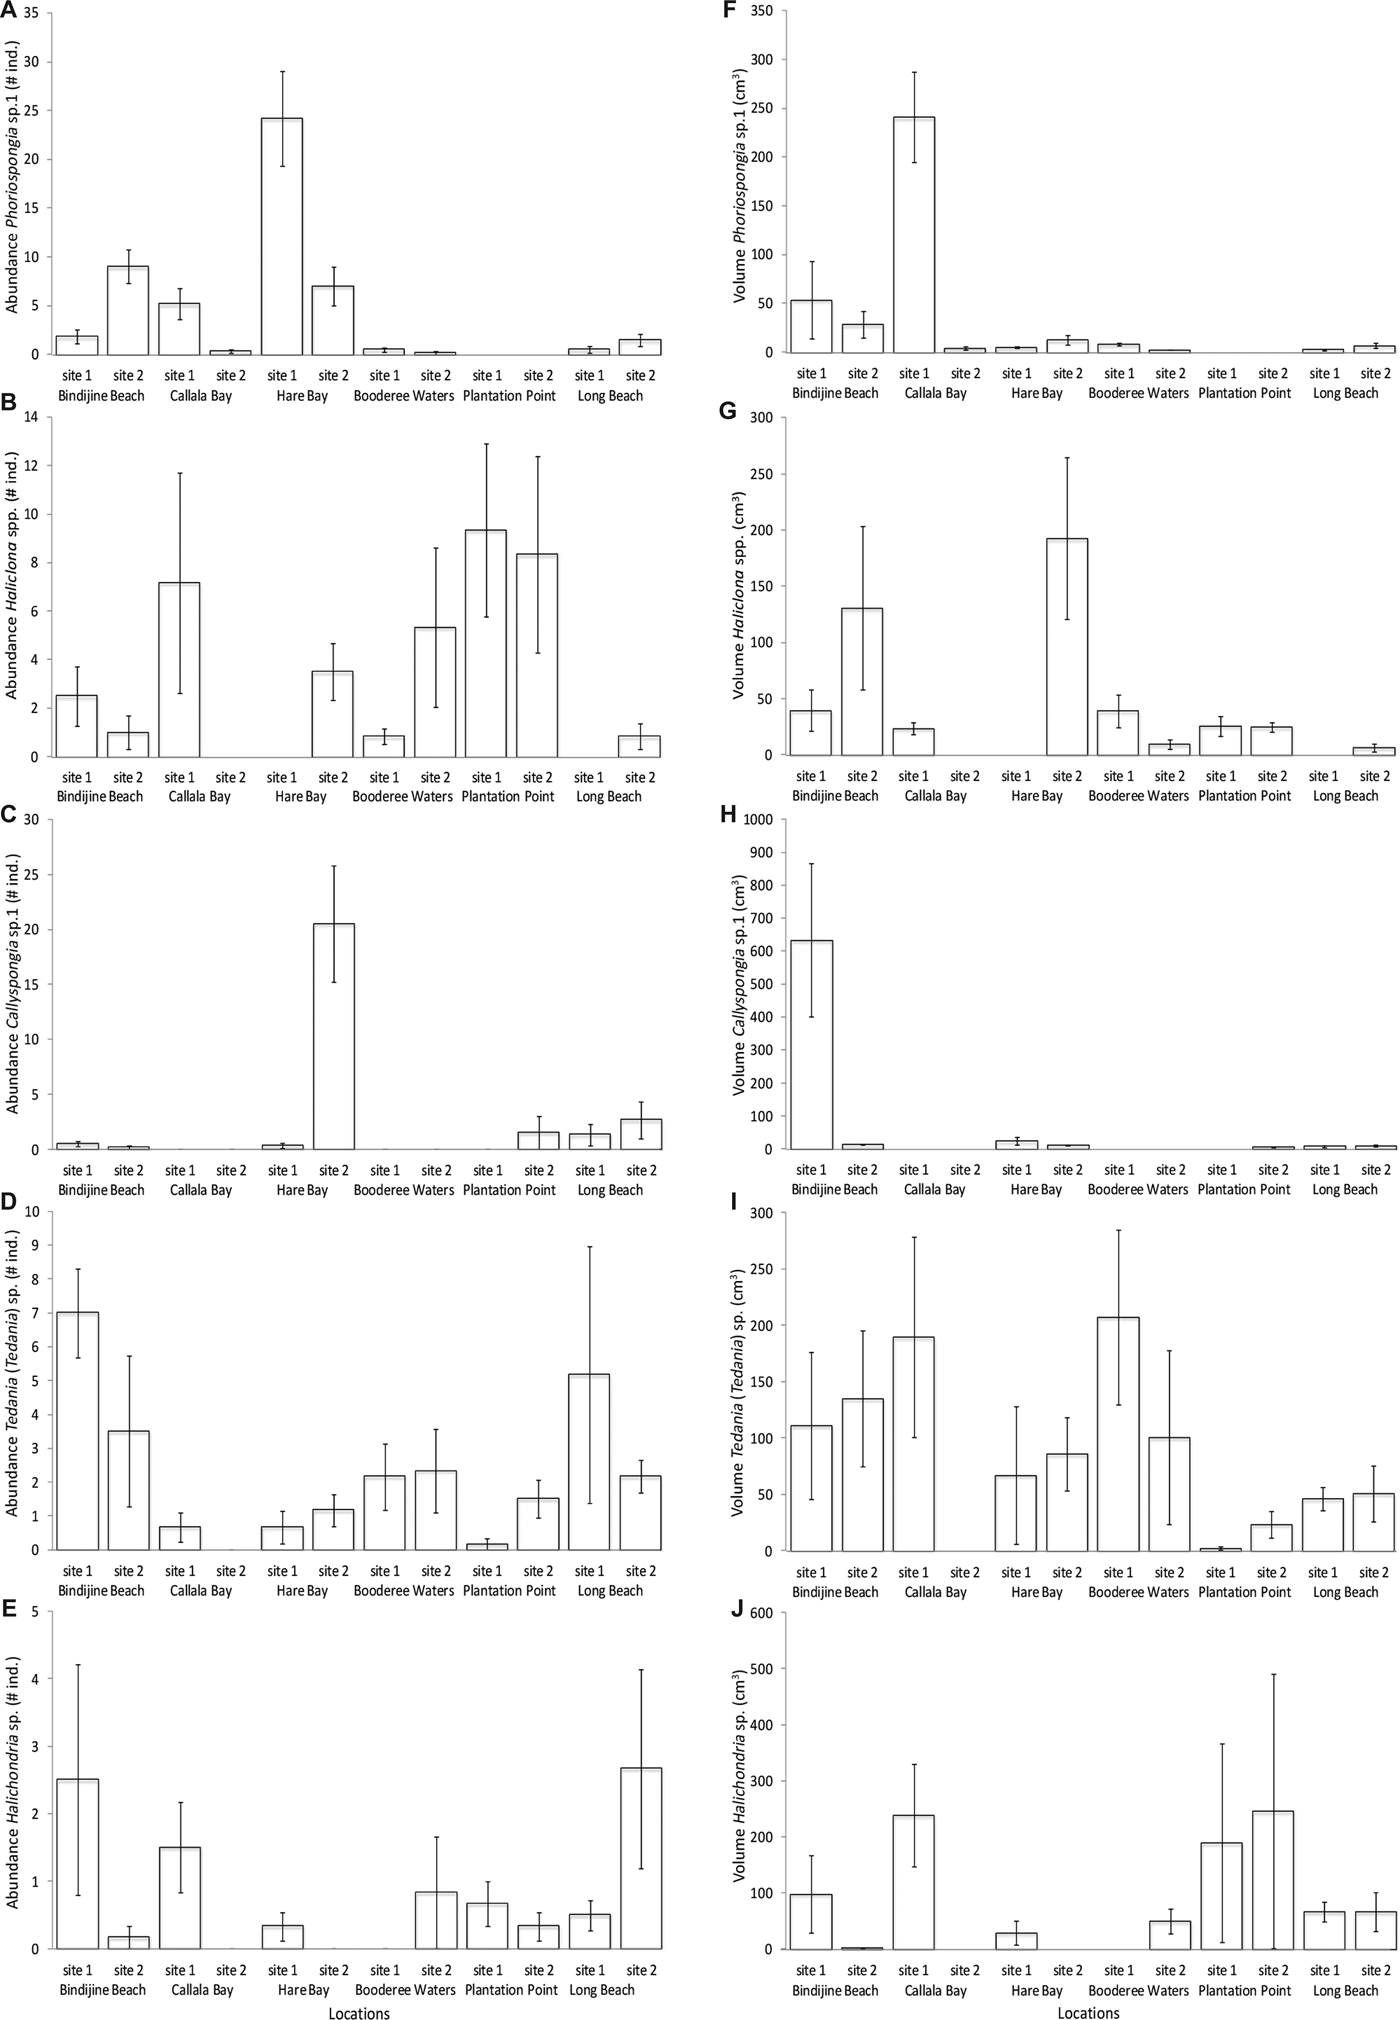
Phoriospongia sp. 1 (AM Z.7219) was most abundant at Hare Bay site 1 (24.17 ± 4.84 individuals) and largest at Callala Bay site 1 (240.65 ± 46.24 cm3), when averaged across six transects (150 m2) at each site. There was a marked disparity between abundance and volume among sites for this species (Figure 6A, Table 2B,C). A significant difference in abundance between sites was recorded at Hare Bay, Bindijine Beach and Callala Bay (Figure 6A, Table 2B, SNK: Hare Bay site 1 > site 2; Bindijine Beach site 1 < site 2; Callala Bay site 1 > site 2), and in volume at Callala Bay (Figure 6F, Table 2, SNK: Callala Bay site 1 > site 2).
Comparison of abundance and volume for the 5 main sponge taxa at the two sites sampled for each of the 6 locations within Jervis Bay. Mean (±SE) estimates of abundance expressed as number of individuals per site for (A) Phoriospongia sp. 1, (B) Haliclona spp., (C) Callyspongia (Toxochalina) sp. 1, (D) Tedania (Tedania) sp., (E) Halichondria sp. Mean (±SE) estimates of volume expressed as cm3 per site for (F) Phoriospongia sp. 1, (G) Haliclona spp., (H) Callyspongia (Toxochalina) sp. 1, (I) Tedania (Tedania) sp., (J) Halichondria sp. Each bar represents a mean of six transects each of 25 m2 (N = 6).
Haliclona spp. (AM Z.7218) were most abundant at Plantation Point site 1 (9.33 ± 3.57 individuals) and largest at Hare Bay site 2 (192.38 ± 71.89 cm3). Hare Bay site 1 had no Haliclona spp. present resulting in a significant difference between sites at this location (Figure 6G, Table 2C, SNK: Hare Bay site 1 < site 2). Due to the high variability in abundance for these taxa, there was no significant difference among sites or locations (Figure 6B, Table 2B).
Halichondria sp. (AM Z.7217) was abundant at Long Beach site 2 (2.67 ± 1.48 individuals) and Bindijine Beach site 1 (2.5 ± 1.71 individuals) but abundance did not vary significantly among sites or locations (Figure 6C, Table 2B). The volume of Halichondria sp. individuals was largest at Plantation Point site 2 (245.5 ± 244.5 cm3) and differed significantly across sites at Bindijine Beach and Callala Bay (Figure 6H, Table 2C, SNK: Bindijine Beach and Callala Bay site 1 > site 2).
Tedania (Tedania) sp. (AM Z.7220) was most abundant at Bindijine Beach site 1 (7 ± 1.32 individuals) and Long Beach site 1 (5.12 ± 3.79 individuals). There was no significant difference in the abundance of this species among sites or locations (Figure 6D, Table 2B). Individuals of Tedania (Tedania) sp. were largest at the Booderee Waters site 1 (207.46 ± 77.46 cm3). Bindijine Beach, Booderee Waters and Long Beach showed significantly greater volume of this species than that at Callala Bay (Figure 6I, Table 2C, SNK: BB, BW and LB > CB).
Callyspongia (Toxochalina) sp. 1 (AM Z.7216) was most abundance at Hare Bay site 2 (20.5 ± 5.30 individuals) and was significantly more abundant there than at site 1 (Figure 6E, Table 2B, SNK: Hare Bay site 1 < site 2). Callyspongia (Toxochalina) sp. 1 individuals were largest at Bindijine Beach site 1 (633.33 ± 233.33 cm3) and were significantly larger than that of site 2 (Figure 6J, Table 2C, SNK: Bindijine Beach site 1 > site 2).
Substrata on which epifauna attached
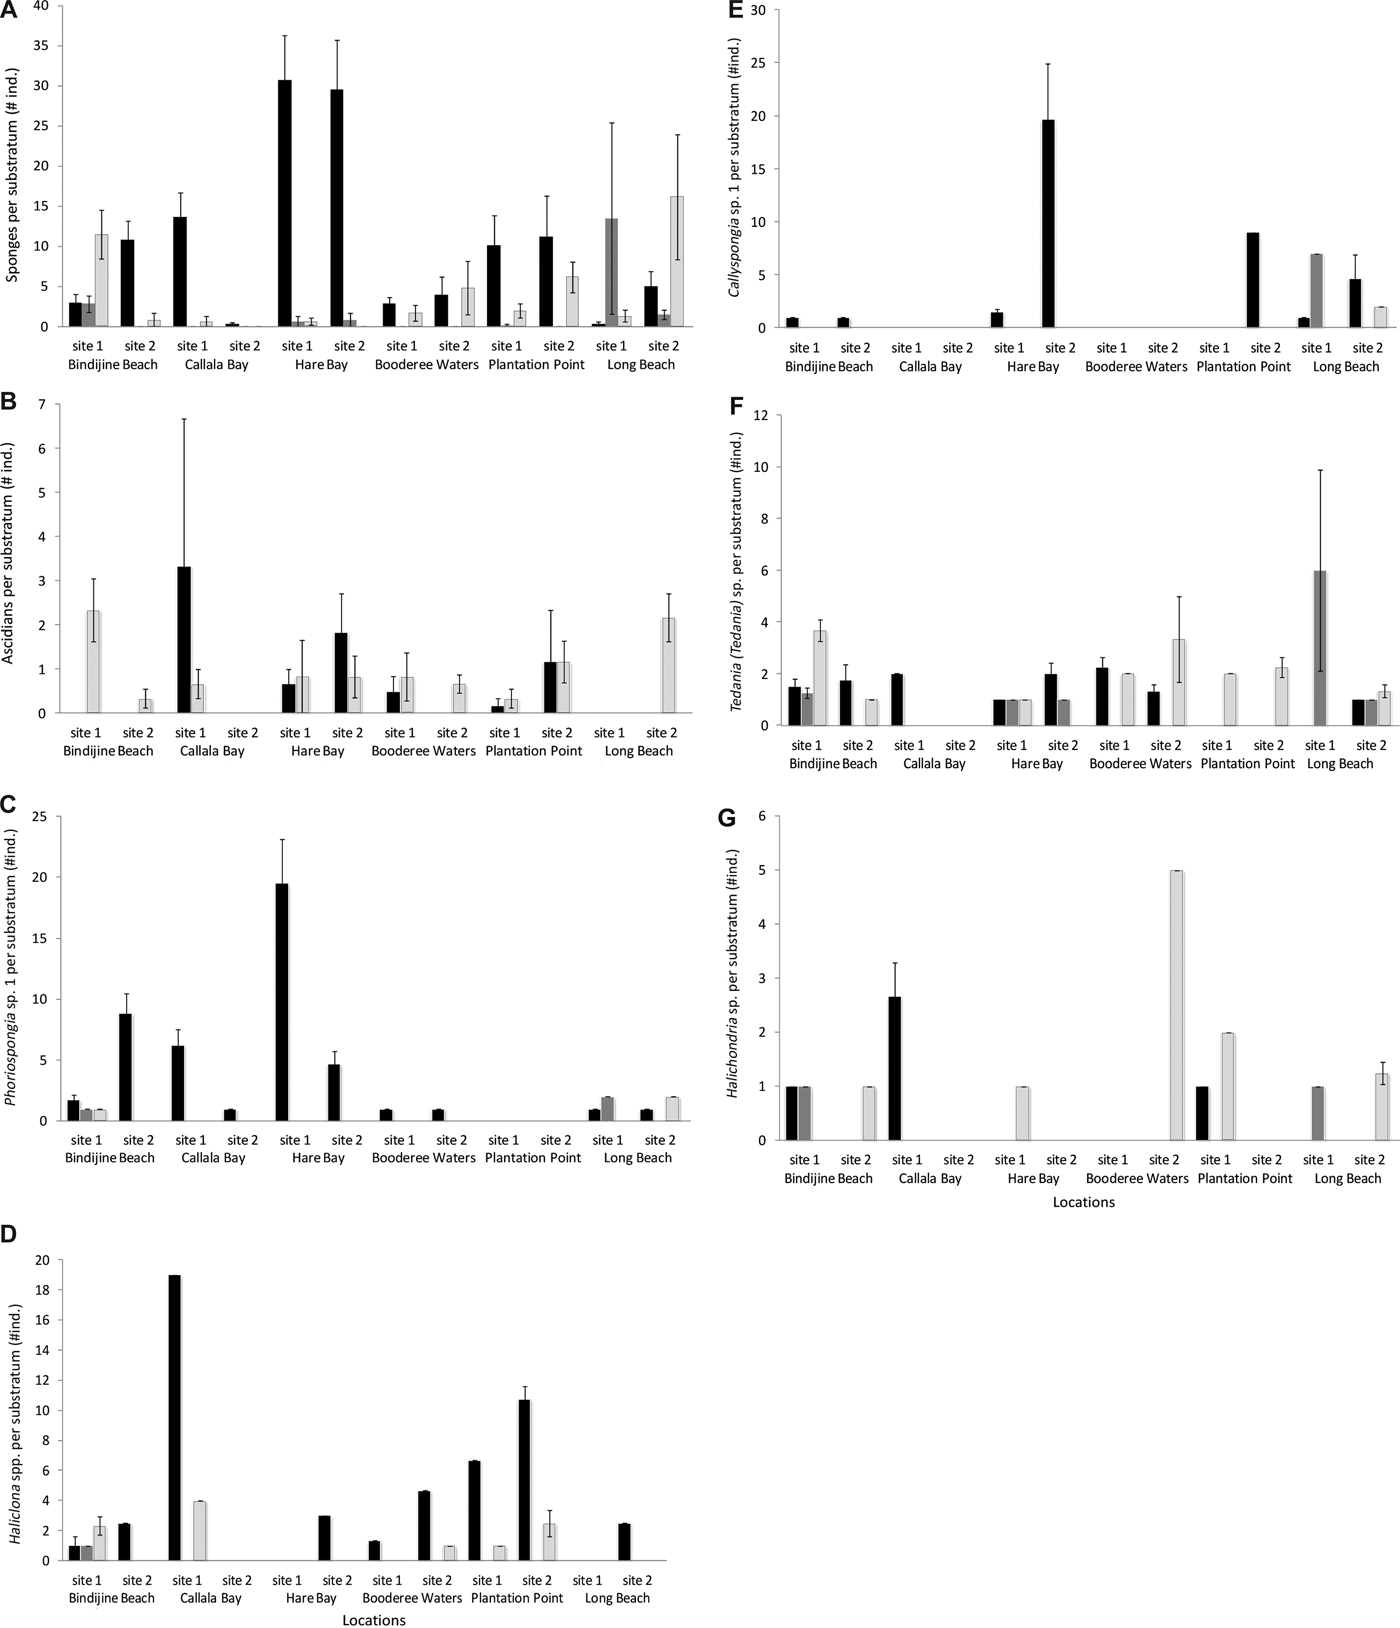
The substratum used for attachment pooled across all locations we sampled revealed that 23% of sponges occurred on shells, 60% on components of P. australis and 10% on polychaete tubes. The substratum of attachment varied across sites and locations (Figure 7A) and differed amongst species. The ‘other’ category included ascidians (2%), other sponges (<1%), algae (1%), boulders (<1%), anthropogenic structures (<1%), unknown (1%) and free living (2%).
Comparison of substratum of attachment for sponges, five dominant sponge taxa and ascidians at the two sites sampled for each of the six locations within Jervis Bay. Mean (±SE) estimates of number of substrata occupied by (A) sponges, (B) ascidians, (C) Phoriospongia sp. 1, (D) Haliclona spp., (E) Callyspongia (Toxochalina) sp. 1, (F) Tedania (Tedania) sp., (G) Halichondria sp. Each bar represents a total of six transects of 25 m2 (N = 6). components of P. australis,
 Polychaete tubes,
 Shells.
Some taxa were consistent in their use of substrata for attachment, whilst other species showed considerable variability. Of the five dominant sponge taxa, three were predominantly encountered on components of P. australis; Phoriospongia sp. 1 (93%), Callyspongia (Toxochalina) sp. 1 (88%) and Haliclona spp. (87%). In contrast, Tedania (Tedania) sp. and Halichondria sp. showed marked variation in their substrata of attachment among sites and locations. Their occurrence on components of P. australis was 27% and 38% respectively (Figure 7). Tedania (Tedania) sp. occurred equally on shells (36%), seagrass components (27%) and polychaete tubes (29%) (Figure 7E). This species used shells solely at Plantation Point, seagrass components at Callala Bay and polychaete tubes at Long Beach site 1 (Figure 7). A similar trend occurred with Halichondria sp., which primarily occurred on shells (44%) and seagrass components (38%) depending on its location (Figure 7). It is worth noting that the five dominant sponge taxa were found on shells, seagrass components and polychaete tubes at least once in Jervis Bay, therefore, no sponge species was established as an obligate occupant of P. australis.
Ascidians predominantly occurred on shells (56%) and seagrass components (41%) but none were observed on polychaete tubes (Figure 7G). Negligible occurrences were recorded on other ascidians (2%) and anthropogenic structures (2%). Ascidians were found exclusively on shells at Bindijine Beach, Booderee Waters site 2 and Long Beach site 2 (Figure 7G).
DISCUSSION
Patterns of distribution
The P. australis meadows of Jervis Bay had a highly speciose assemblage of sessile epifaunal invertebrates. We encountered 20 sponge species and eight ascidian species within a sampling area ~1800 m2. We felt it instructive to compare these values with diversity in other habitats. These seagrass meadows were more speciose than vegetated and unvegetated sediments of saline coastal lagoons in NSW, Australia (Barnes et al., Reference Barnes, Roberts and Davis2013). Barnes and co-workers (Reference Barnes, Roberts and Davis2013) reported 18 sponge species and six ascidian species in a sampling area 10-fold larger than our study. Other studies have recorded slightly lower species richness in seagrass habitats, but have sampled much smaller areas. For instance, Lemmens et al. (Reference Lemmens, Clapin, Lavery and Cary1996) recorded 11 species of macro-suspension feeders (sponges, ascidians and bivalves) in a Western Australian P. australis meadow. Seagrass meadows have a relatively high sessile epifaunal invertebrate diversity in comparison to the kelp forests of NSW; Wright et al. (Reference Wright, Benkendorff and Davis1997) recorded 10 algae-associated sponge species. Despite their relatively high species richness, the seagrass ecosystems of Jervis Bay were surpassed by the temperate reefs of NSW, which comprised more than double the sponge and ascidian diversity we observed (Roberts & Davis, Reference Roberts and Davis1996; Newton et al., Reference Newton, Creese and Raftos2007).
We found taxonomic similarities among the sessile epifaunal invertebrate assemblage of Jervis Bay and that of estuarine lakes in NSW, particularly for ascidians. Both assemblages comprised Botrylloides leachi, Herdmania grandis, Pyura praeputialis, Styela plicata as well as two sponge taxa, Halichondria sp. and Haliclona sp. (Barnes et al., Reference Barnes, Roberts and Davis2013). Although, it is unknown whether the sponge species we have observed correspond to the five species of Halichondria and two species of Haliclona recorded by Barnes et al. (Reference Barnes, Roberts and Davis2013).
The assemblage was dominated by several patchily distributed but locally widespread species and included sparsely distributed uncommon species. This pattern is consistent to that seen on natural and artificial reefs (Wilkinson & Evans, Reference Wilkinson and Evans1989; Roberts & Davis, Reference Roberts and Davis1996; Knott et al., Reference Knott, Underwood, Chapman and Glasby2004), as well as within mangrove (Farnsworth & Ellison, Reference Farnsworth and Ellison1996) and kelp habitats (Wright et al., Reference Wright, Benkendorff and Davis1997). The dominant sponge species (Phoriospongia sp. 1, Haliclona spp., Callyspongia (Toxochalina) sp. 1, Tedania (Tedania) sp. and Halichondria sp.) were widespread over the largest spatial scale sampled, with three of the five most common sponge taxa found at every location. Although widespread, species were patchily distributed with the most common species occurring at 58% of the transects sampled. Ascidians were not as widespread, with only one ascidian species (Herdmania grandis) found at all locations and two species (Pyura praeputialis and Didemnum sp.) occurred at five or more locations.
‘Rare’ species (those species occurring at fewer than two sites) constituted 24% of sponges and 57% of ascidians from the entire community sampled. Hooper & Kennedy (Reference Hooper and Kennedy2002) recorded up to 60% of ‘rare’ sponge species on the reefs of the Sunshine Coast, eastern Australia. In our seagrass study, uncommon species were sparsely distributed amongst sites and locations; most species occurred at less than half the transects per site. A markedly low abundance of sponges and ascidians was recorded at Callala Bay site 2 with only two sponge individuals (Phoriospongia sp. 1) found within 150 m2 of habitat; the reason for this discrepancy was not clear.
High variation in sponge and ascidian distribution at the smallest spatial scale we sampled was clearly apparent. Heterogeneity in sessile epifaunal invertebrate distribution at small spatial scales has also been recorded in coastal lakes (Barnes et al., Reference Barnes, Davis and Roberts2006), on mangrove roots (Guerra-Castro et al., Reference Guerra-Castro, Young, Perez-Vazquez, Carteron and Alvizu2011), in reefal habitats (Roberts & Davis, Reference Roberts and Davis1996; Hooper et al., Reference Hooper, Kennedy and Quinn2002; Hooper & Kennedy, Reference Hooper and Kennedy2002; Knott et al., Reference Knott, Underwood, Chapman and Glasby2004; Newton et al., Reference Newton, Creese and Raftos2007) and even on bare substratum in deep Antarctic waters (Barthel & Gutt, Reference Barthel and Gutt1992).
Similarity in sessile assemblages between sites was observed in spite of high levels of heterogeneity. Marked clustering at the site level was evident from the nMDS plots. This concurred with previous work (Corriero et al., Reference Corriero, Balduzzi and Sara1989; Barthel & Gutt, Reference Barthel and Gutt1992) and most likely reflects limited dispersal by these taxa. The patchy nature of sponge distribution has been linked to their low probability of long-distance dispersal, asexual propagation and lack of connectivity among populations (Hooper et al., Reference Hooper, Kennedy and Quinn2002; Hooper & Kennedy, Reference Hooper and Kennedy2002). Like sponges, some ascidians are limited in their dispersal abilities and are likely to have highly restricted gene flow (Davis & Butler, Reference Davis and Butler1989). These patterns of dispersal may also see rare sponge species form clusters in some habitats (Fromont et al., Reference Fromont, Vanderklift and Kendrick2006).
The three metrics we used in assessing sponges (their abundance, volume and level of spread) produced contrasting patterns of spatial distribution. This has also been documented by other studies (Wulff, Reference Wulff2001; Bannister et al., Reference Bannister, Battershill and De Nys2010). Despite marked disparity in these metrics among and within taxa, two sponge taxa were relatively abundant, voluminous and widespread; Phoriospongia sp. 1 and Haliclona spp. It is noteworthy that sponge species displayed a range of functional growth forms including encrusting, simple massive, cryptic massive, erect laminar and erect branching (concept by Schonberg & Fromont, Reference Schonberg, Fromont, Radford and Ridgway2014). This range of growth forms ensures that volume is complex and time-consuming to quantify compared with the number of sponge individuals present. However, a combination of abundance and volume measurements may provide more meaningful estimates of the distributional patterns of sponges and ascidians (Wulff, Reference Wulff2001, Reference Wulff2012; Bannister et al., Reference Bannister, Battershill and De Nys2010).
Sites within Jervis Bay showed marked disparity in their sessile epifaunal invertebrate distribution. The highest values for the overall sponge abundance (Hare Bay site 2), sponge volume (Callala Bay site 1), sponge diversity (Bindijine Beach site 1), ascidian abundance (Callala Bay site 1) and ascidian diversity (Long Beach site 2) almost all occurred at different sites. The site with the highest sponge abundance had relatively low sponge volume and vice versa. Bindijine Beach site 1 was the only site that had relatively high abundance, volume and diversity of sponges and ascidians in Jervis Bay. The five dominant sponge taxa also showed no concordance in their abundance and volume among sites.
Most sponges are unselective filter feeders and capture particulate materials from the water column (Bergquist, Reference Bergquist1978; de Goeij et al., Reference De Goeij, van Oevelen, Vermeij, Osinga, Middelburg, de Goeij and Admiraal2013). Increased nutrient availability and water flow favour sponge growth and survival rates (Morris & Keough, Reference Morris and Keough2003; Duckworth et al., Reference Duckworth, Battershill and Schiel2004). Nutrient availability is a likely key driver of sponge and ascidian distribution. The locations with greatest sponge and ascidian abundance, diversity and volume were mainly located on the east side of Jervis Bay (Hare Bay, Long Beach and Bindijine Beach) which coincides with a high nutrient load. In the Bay, oceanic water enters at Booderee and circulates clockwise (Figure 2) around the Bay, accumulating nutrients and sediments (Wang & Wang, Reference Wang and Wang2003). Plankton levels have been linked to the spatial distribution of large suspension feeders such as sponges, ascidians and bivalves in the P. australis meadows of Cockburn Sound, Western Australia (Lemmens et al., Reference Lemmens, Clapin, Lavery and Cary1996). A correlation was established between the density of sponges and ascidians, and the phytoplankton levels in this coastal embayment. The effect of the clockwise gyre carrying nutrients and sediments in Jervis Bay should be further investigated.
Substratum used for attachment and the impact of humans
Substrata used for attachment by sessile epifaunal invertebrates in P. australis meadows comprised mainly P. australis, shells and polychaete tubes, in order of importance. Attachment to components of P. australis was prevalent for three sponge taxa Phoriospongia sp. 1, Callyspongia (Toxochalina) sp. 1 and Haliclona spp., although none were seagrass obligate species. Seagrass components were commonly used as a substratum, with sponges occurring on all P. australis components; rhizome, sheath and blade. Ascidians occurred equally on shells and P. australis components but were not observed on polychaete tubes. Our findings contrast with those of Corriero et al. (Reference Corriero, Balduzzi and Sara1989). They compared two Tethya sponge species in the Posidonia oceanica meadows of a Mediterranean lagoon; both were found on seagrass rhizomes but were not reported on other plant components.
Anthropogenic disturbances to seagrass ecosystems are expected to have an impact on the distribution of sessile epifaunal invertebrate species, especially those relying heavily on seagrass for their attachment. Disturbances most likely to produce negative effects on seagrass associated fauna include habitat fragmentation (Healey & Hovel, Reference Healey and Hovel2004), siltation stemming from meadow patchiness (e.g. Shepherd et al., Reference Shepherd, McComb, Bulthuis, Neverauskas, Steffensen, West, Larkum, McComb and Shepherd1989; Short & Wyllie-Echeverria, Reference Short and Wyllie-Echeverria1996) and other sources of siltation (Wilcox & Murphy, Reference Wilcox and Murphy1985; Reed & Hovel, Reference Reed and Hovel2007). Direct human-induced siltation was found to alter sponge species composition and to reduce species richness as well as sponge cover (Roberts et al., Reference Roberts, Smith, Ajani and Davis1998). Despite relatively low levels of human disturbance within Jervis Bay, seagrass meadows have already suffered from negative boating practices, a known contributor to habitat fragmentation (Demers et al., Reference Demers, Davis and Knott2013).
CONCLUSIONS
Sessile epifaunal invertebrates inhabiting the seagrass meadows of Jervis Bay were patchy in their distribution. A few of the taxa in the assemblage were widespread over large spatial scales (km apart). In contrast, the majority of species were rare and sparsely distributed. Variation in sessile epifaunal invertebrate distribution was greatest at small spatial scales (100s m apart). This should be considered in the design of experiments and impact studies as sampling efforts should concentrate on small spatial scale with sufficient sampling intensity to detect rare species.
Sponges are rarely recognized as a major constituent of seagrass ecosystems (Wulff, Reference Wulff2001). Our study demonstrated otherwise. Although no obligate seagrass species was recorded, three sponge species relied heavily on seagrass for attachment and a total of 20 sponge species and eight ascidian species were encountered in the meadows of Jervis Bay. To our knowledge, no other studies have investigated the importance of P. australis as a substratum for the attachment of these invertebrates. Further studies need to adopt an experimental approach to disentangle the key processes and factors responsible for the patterns observed. Examining the response of sessile epifauna to the degradation of their seagrass habitat remains a key challenge.
ACKNOWLEDGEMENTS
We thank Axton Aguiar, Lucia Aguilar, Guy Demers, Corrine DeMestre, Russell McWilliam, Matthew Rees, Helene Roy for assistance in the field. Dr Jane Fromont from the Western Australia Museum and Lisa Goudie provided indispensable sponge identification. We acknowledge Dr Stephen Keable for lodging sponge vouchers at the Australian Museum Research Institute. We also thank Andreanne Demers for producing Figure 2. We would like to acknowledge the input of Karen Astles as well as three anonymous reviewers that improved an earlier draft. This is contribution no. 313 from the Ecology and Genetics Group, University of Wollongong.
FINANCIAL SUPPORT
This work was supported by a University of Wollongong Industry Partnership grant to ARD & NAK. This study was supported by funds from NSW DPI and an Australian Postgraduate Award.