


INTRODUCTION
The gaseous components enclosed in the bubbles of glacier ice are a different age from the surrounding ice. This age relation is determined by the gas exchange in the firn and the enclosure process of the air during transformation of the firn to ice. The knowledge of this relationship is especially necessary for the accurate chronological interpretation of fluctuations and trends of trace-gas concentrations measured in air which has been extracted from ice samples: for example, the increase in trace gases due to human activity (Reference Neftel, Moor, Oeschger and StaufferNeftel and others 1985, Reference Craig and ChouCraig and Chou 1982, Reference Stauffer, Fischer, Neftel and OeschgerStauffer and others 1985[b]), or the changes in the CO2 concentration during and at the end of the last glaciation in relation to other climatic parameters recorded in the ice (Reference Staffelbach, Stauffer and OeschgerStaffelbach and others 1988, this volume). The enclosure of air at the firn–ice transition has been investigated in experiments (Reference Schwander and StaufferSchwander and Stauffer 1984, Schwander and others, in preparation) and in theory (Reference Stauffer, Schwander and OeschgerStauffer and others 1985[a], Reference EntingEnting 1987). Thereafter, in dry-deposition areas the major part of the air is enclosed in the density interval 0.79–0.82 Mg/m3. The corresponding depth range depends mainly on the annual mean temperature and the accumulation rate and is, for example, at Siple Station (Antarctica) 65–75 m (−24°C; 0.5 m water equivalent per year), or at the South Pole 110–130 m (−51 C; 0.08 m w.e. per year) (Reference Herron and LangwayHerron and Langway 1980). In previous publications (Reference Schwander and StaufferSchwander and Stauffer 1984, Reference Craig and ChouCraig and Chou 1982) it has been assumed that the air is well mixed within the firn layer and therefore the age difference between ice and enclosed air was taken to be equal to the age of the ice at pore close-off. However, we must expect a time delay for the gas exchange in the firn, of the order of zCO 2/D, where zCO is the transition depth and D is the diffusion coefficient in the porous firn. An upper limit of D is the free-air diffusion coefficient, that is c. 2 × 10⁻⁵ m2/s for gases with a molecular weight ≥20. The expected delay is thus 5 years or longer. Rapid concentration fluctuations of atmospheric components should be attenuated accordingly at the firn–ice transition. There are two methods for investigating diffusive mixing in the firn. One method is to carry out tracer experiments. It has been suggested, for example, that the spread of SF6 deposited in the firn should be measured, or the concentration of CFCs or 85Kr within the firn or on shallow ice cores, or that the shallow cores should be analyzed for the 14C “bomb-peak”. The alternative method, which we present in this paper, is to measure the diffusion coefficients on firn samples in the laboratory and to calculate the air mixing in the firn layer. We report on the first direct measurements of the diffusion coefficients for CO2 and O2 (in N2) for firn with porosities between 0.13 and 0.5. With the aid of a one-dimensional model we discuss the effect of diffusive mixing in firn.
EXPERIMENTAL PROCEDURE
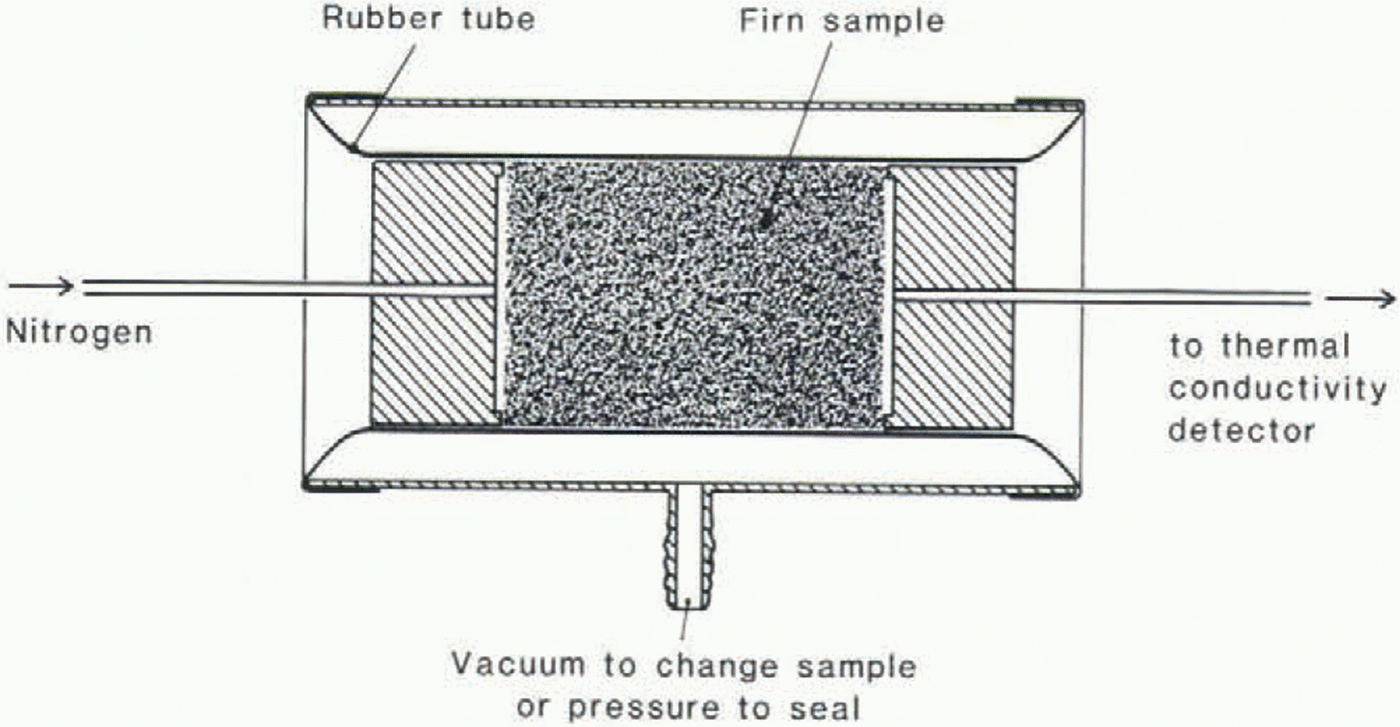
The diffusion coefficients are measured on cylindrical firn samples of 30.0 mm diameter and c. 50 mm length. Placed between two stainless-steel adapters, the samples are sealed in a rubber tube (Fig. 1). This set-up, instead of a separation column, is mounted in a Series 5880A Hewlett-Packard gas chromatograph. The diffusion coefficient is determined by analyzing the shape of the elution peak of a small amount of CO2 (respectively O2) fed to the carrier gas. The concentration in the eluting gas is measured with a thermal conductivity detector. In order not to oxidize the detector filament too quickly we use nitrogen as the carrier gas instead of air. The diffusion coefficients in air are, however, only slightly higher than in nitrogen and the scatter of diffusivities reported by different authors is rather large (Reference Landolt-BörnsteinLandolt-Börnstein 1969), so the error will be insignificant if we later use the diffusion coefficients measured in nitrogen for our own calculations. The carrier-gas flow can be adjusted between 7.42 and 33.47 cm /min, corresponding to superficial gas velocities (average gas velocity in an open tube with the same diameter as the sample) between 0.175 and 0.789 mm/s. The temperature in the column “oven” is held at −20° ± 0.1 °C for all measurements. The peak-shape analysis is carried out in the following way: we define the diffusion coefficient according to Fick’s first law: j = −Ddc/dx + cv, where j is the flux per unit cross-section in the open pores, c is the concentration of the considered gas in the open pores and v is the mean flow velocity of the carrier gas. Figure 2 shows a typical elution curve. The tangents are drawn through the points of maximum slope. The intersections with the base line and with each other give the times t1, t2 and t3. In a numerical diffusion model, v and D are adjusted in order to match t1, t2 and t3 as closely as possible. D generally depends on the carrier-gas flow. As the technique we use to measure the diffusion constants is closely related to gas chromatography, we can use the theory of gas-chromatography separations to interpret the dependence of the diffusion coefficient on carrier-gas flow. A simple transformation of equation 33 in van Reference Deemter, Zuiderweg and KlinkenbergDeemter and others (1956) leads to the following relation:

where Dm is the molecular diffusivity, u is the superficial gas velocity which is related to v by u = sv, where s is the porosity; a and b are constants for an individual sample.
Sample holder.
Typical elution peak of a 8 input of CO2, fed to the carrier gas after passing through the firn sample.


The second term in Equation 1 is the eddy diffusivity, and the third term describes in gas chromatography the diffusive exchange with the stationary phase that is the dispersion traverse to the direction of average flow. In our case the equivalent to the stationary phase would be the air pockets and dead-ended channels that are not, or only a little, flushed by the carrier gas. This dependence of D on the gas-flow velocity can be used to estimate how air flow in the firn caused by atmospheric pressure variations contributes to the gas mixing rate.
RESULTS AND DISCUSSION
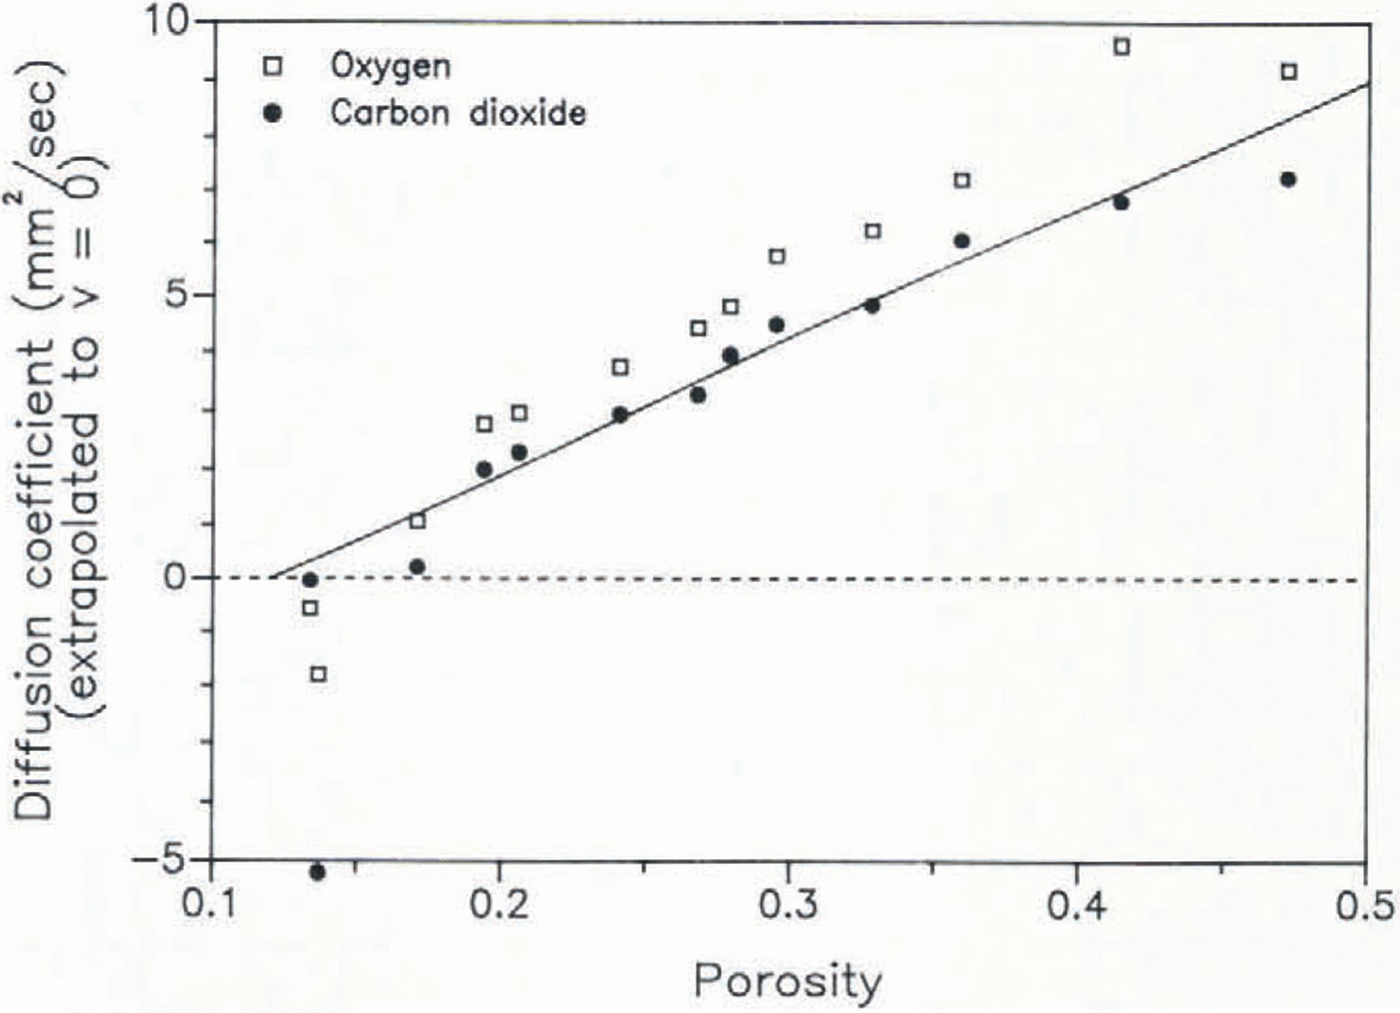
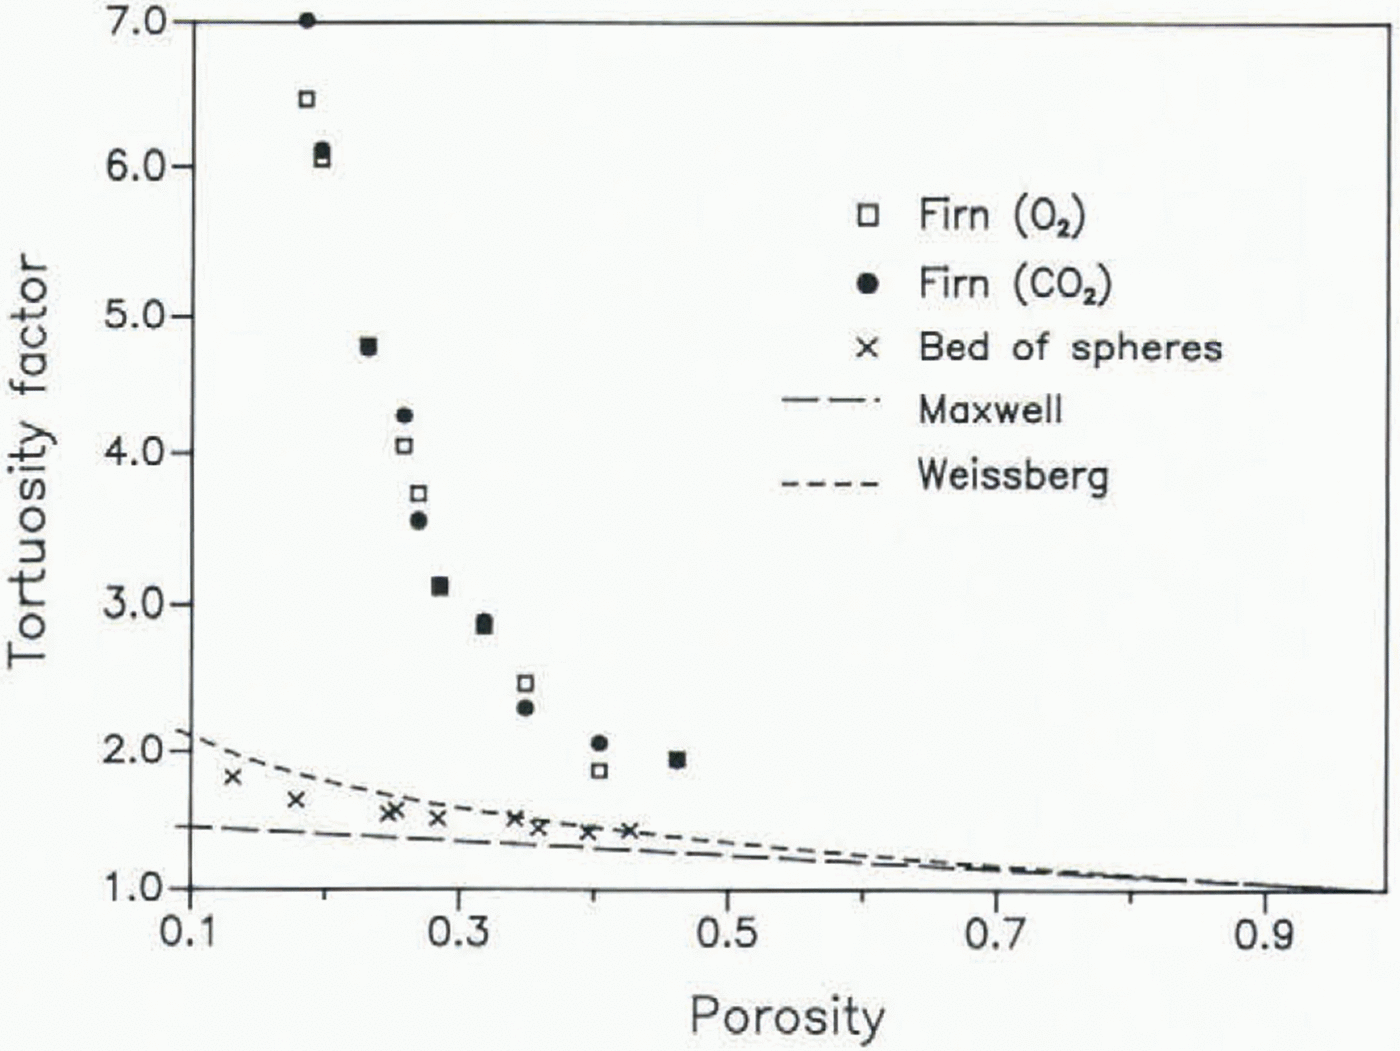
The diffusivity has been measured on 13 samples of a core drilled at Siple Station, Antarctica (75.92 °S, 83.92 °W; mean temperature −24 °C), the same core on which measurements on the air enclosure had been carried out previously (Reference Schwander and StaufferSchwander and Stauffer 1984). The diffusion coefficients have been normalized to a pressure p of 1 atmosphere, using the relation for ideal gases: D ∝ 1/p. All results are listed in Table I and are shown graphically in Figure 3. The porosity s has been calculated according to s = 1 − (ρ/ρi), where ρ is the firn density and ρi is the pure-ice density, s is thus the total porosity of the sample. The open porosity which is actually important for the diffusion is, however, almost equal to the total porosity for densities <0.8 Mg/m3 (Schwander and others, in preparation). According to Equation 1, a quadratic regression of the data points seems to be reasonable. However, at large porosities a and b are expected to be quite small and therefore we consider a linear regression to be more appropriate for samples with porosities larger than 0.24, as in this case the quadratic term would mainly reflect data scatter. The extrapolated values for zero superficial gas velocity can be interpreted as the molecular diffusivities. These are listed in Table I and shown graphically in Figure 4. For samples with porosities below 0.19 the diffusion coefficients strongly depend on the gas flow. For those samples the extrapolation may not give very accurate data and leads in some cases even to negative values which are not physically meaningful. The mean ratio of Dm(O2)/Dm(CO2) of the samples with porosities >0.19 is 1.27, which is in excellent agreement with that of measured free-air diffusivities DO(Reference Landolt-BörnsteinLandolt-Börnstein 1969). The ratio DO/Dm is known as the tortuosity factor, In Figure 5 we compare the tortuosity factors obtained from our measurements with values measured on a bed of spheres and with theoretical models (Reference WeissbergWeissberg 1963). The high tortuosity factors for the firn samples, as compared to the bed of spheres, indicate the existence of dead-ended channels and/or relatively narrow passages in the pore channels.
Diffusion coefficients of O2 and CO2 (in N2,), measured on firn samples from Stple Station (Antarctica), versus the superficial gas velocity.

Extrapolated molecular diffusion coefficients measured on firn samples from Siple Station (Antarctica), versus the firn porosity. The line is a linear regression through the values for CO2
Tortuosity factor (DO/Dm) versus porosity. The results obtained from firn samples are compared with values measured on a bed of spheres and theoretical curves. The lower curve is a theoretical lower bound for any isotropic porous medium and is derived from a formula by J.C. Maxwell describing the electrical conductivity of inhomogeneous substances; the upper curve is a theoretical lower bound for a porous medium consisting of overlapping spheres (Reference WeissbergWeissberg 1963).
With the data presented we are able to model the mixing of the air in a firn layer. But since D depends on the air velocity we have first to estimate the natural vertical air flow in the firn layer. The total open-pore volume of the firn in dry-desposition areas corresponds to a layer 15-30 m thick. A pressure increase of 1 hPa would therefore compress such a layer of air by less than 50 mm. A typical barometric pressure variation of 5 hPa/d would thus lead to a superficial gas velocity near the snow surface of approximately 3 ×10⁻³ mm/s. This low air flow leads only to a negligible increase in the diffusion coefficient compared to the molecular diffusivity (see Fig. 3). Much faster pressure variations, like high-frequency fluctuations as they exist in a gusty wind situation, are strongly attenuated at greater depth (Schwander and others, in preparation) and do not lead to significant flow velocities except very close to the snow surface. The decreasing porosity during firnification also leads to an air flow in the firn. When the firn is compacted, air is expelled from the open-pore volume. This leads to an upward movement of the air relative to the firn. The corresponding mean air velocity is of the order of the snow-accumulation rate, which is generally less than 10−4 mm/s. In the case of firn without melt layers (uniform upward flow relative to the firn at a given depth level), the flow-dependent part of the diffusivity is again negligible. We therefore conclude that molecular diffusion is by far the most dominant process that controls the mixing of the air in the porous firn.
We restrict our discussion to CO2 and make the following assumptions for our model: (1) The firn is horizontally homogeneous; in particular, no melt layers or ice lenses exist. (2) The porosity decreases monotonically with depth according to the empirical formula of Reference Herron and LangwayHerron and Langway (1980). This formula gives values very close to the ones measured. (3) The relation between the diffusion coefficient and the porosity is given by

where c is a temperature and pressure correction factor: c = 1013.25/p[hPa](T[K]/253.16)1.85 (Reference Landolt-BörnsteinLandolt-Börnstein 1969); p and T are the mean barometric pressure and the mean temperature respectively. Equation 2 is a linear regression through the diffusivities measured for CO2, and is represented by the line in Figure 4. Since a more or less universal dependence of air permeability on the density has been observed for dry-accumulation areas (Schwander and others, in preparation), we have good reasons for assuming that Equation 2 has good global validity too. The diffusion in the firn is computed numerically with a one-dimensional 100-box model. Each box has the same pore volume and is therefore of varying length. The firn layer is considered stationary, except that, after an appropriate number of time steps, the content of each box is shifted down by one box in order to take into account the air enclosure at the firn–ice transition. The concentration of CO2 at the top of the firn–ice transition is shown in Figure 6 for three assumed patterns of atmospheric concentration changes at the three locations: Siple Station (West Antarctica), South Pole, and Station Crête (Greenland). The mixing time is thus of the order of 10-50 years.
Calculated CO2 concentrations versus time at the top of the firn–ice transition, for three assumed patterns of the atmospheric concentration at Siple Station (Antarctica), South Pole, and Station Crête (Greenland).

The concentration of a gas A in the bubbles at a given depth is determined by the convolution due to diffusion and the convolution due to the gradual enclosure of the air over the interval of the firn–ice transition. Thus the concentration c A(Z,t) of gas A in the bubbles at depth Z and time t is given by

where VT is the total gas content after close-off, dV/dz is the rate of air trapping, τ(z) is the time when the observed ice layer was at depth z, and cA(z,τ(z)) is the concentration of gas A at depth z and time τ. As by definition dV/dz essentially vanishes except in the interval of the firn-ice transition, we have to extend the integration over that interval only. In general we can compute cA(z,τ(z)) with our model. However, it is the close-off region where the diffusion coefficient is least well known. For example, if the diffusion coefficient is taken to equal zero, then cA(z,τ(z)) is constant over the close-off interval and Equation 3 yields: cA(Z,t) = cA(z,τ(zCO)), where zCO is the depth of the top of the close-off interval. In this case the gradual air enclosure would have no effect on the width of the age distribution. In reality there is still some gas exchange within the transition interval, but we can certainly no longer expect a monotonie decrease in the diffusivity. In contrast, we observe (for example) strong variations in the density and the air permeability at the firn–ice transition (Reference Schwander and StaufferSchwander and Stauffer 1984, Schwander and others, in preparation), therefore we must expect high variability in the diffusion coefficient also. As the mixing rate is mainly controlled by the layers with the lowest diffusion coefficients we expect that downward mixing is practically inhibited as soon as there are layers with diffusivities near zero. A strong decrease in the air permeability is observed between densities 0.8 and 0,805 Mg/m3 (Schwander and others, in preparation). Consequently the diffusivity must also decrease to very low values at these densities. In fact the line in Figure 4 intersects zero diffusivity at a porosity of 0.12. An open porosity of 0.12 is reached at a density of approximately 0.805 Mg/m3. Since at the depth of the firn–ice transition the density variations over an annual cycle are of the order of ±0.1 Mg/m3 (Reference Schwander and StaufferSchwander and Stauffer 1984), layers with a density of 0.805 Mg/m3 are observed already at a very early stage of the pore close-off, namely at annual mean densities of c. 0.795 Mg/m3. Although these values may differ somewhat for different sites, the observations suggest that air mixing in the transition zone is probably rather slow. This means that the effect of the gradual air enclosure on the width of the age distribution of the air is probably smaller than previously assumed and that the calculations for the mean age difference between ice and air must be based on the age of the ice somewhat above the center of the close-off interval.
The presence of melt layers or other strong horizontal inhomogeneities makes the quantitative description of the gas exchange considerably more difficult. There are three major effects: (1) The melt layers impede the molecular diffusion by increasing the mean path length between any two points separated by a melt layer. (2) The eddy diffusion due to pumping caused by atmospheric pressure variations is increased compared to homogeneous firn; however, the pressure variations (on the other hand) are more effectively attenuated at greater depths. (3) The upward movement of the air relative to the firn is not uniform at the level of a melt layer. Relatively high vertical velocities may result in the remaining porous part of this layer and hinder downward diffusion. Nearly continuous melt layers could even practically inhibit any diffusive flow from upper to lower strata. To calculate the air mixing at locations with melt layers would require detailed information on the geometry of these melt features and a one-dimensional model would no longer be adequate. Tracer methods would probably be easier to apply and would give better results.
CONCLUSIONS
The air exchange in the porous firn layer is an important factor that determines the age difference between air and ice and the width of the age distribution. Molecular diffusion is the dominant process that controls this exchange. The consequence of non-instantaneous mixing is, on the one hand, a delay and smoothing of atmospheric concentration variations at the close-off depth and, on the other hand, the slow exchange within the transition interval reduces the contribution of gradual air enclosure on the width of the age distribution. The combination of both effects on the convolution of atmospheric gas concentrations is a difficult task, since it depends strongly on the local variability of the diffusivity within the transition interval. We estimate that the overall effect results in a reduction by approximately 10% of the values for the mean age difference as published by Reference Schwander and StaufferSchwander and Stauffer (1984), and that the slow mixing in the transition interval leads to a somewhat smaller width of age distribution.
ACKNOWLEDGEMENTS
The field work was supported by the U.S. National Science Foundation, Division of Polar Programs; the laboratory work was supported by the University of Bern and the Swiss National Science Foundation.



