The trial-heat forecasting equation grew out of an examination of Gallup's trial-heat polls (“if the election were held today, who would you vote for?”) at various points in election years as predictors of the November vote (Campbell and Wink Reference Campbell and Wink1990). My co-author Ken Wink and I found, not surprisingly, that polls as literal forecasts were not very accurate until just before the election, that taking the historical relationship between the polls and votes into account through a bivariate regression significantly increased their accuracy, and that taking the contemporary context of the election as measured by economic growth in the election year into account increased their accuracy even further. Corroborating Lewis-Beck and Rice's earlier finding (Lewis-Beck Reference Lewis-Beck1985, 58), we found that an equation combining the Labor Day trial-heat poll standing of the in-party candidate and the second-quarter growth rate in the economy produced the most accurate forecast of the national two-party popular vote.
The Record of the Trial-Heat Forecast
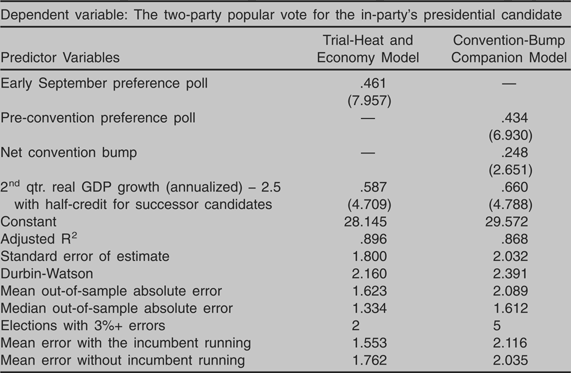
The trial-heat model has held up fairly well since its creation. Its original estimation based on elections from 1948 to 1988 accounted for 94% of variation in the two-party vote (adjusted R2) and had a standard error of estimate of 1.53 with a mean absolute out-of-sample error of 1.1 percentage points (Campbell and Wink Reference Campbell and Wink1990, 259 and 262). The updated and only slightly revised equation accounts for 90% of the variation in the vote and has a standard error of estimate of 1.80 with a mean absolute out-of-sample error of 1.6 percentage points. With four additional elections, the accuracy measures remain strong. Moreover, the coefficient for the key predictor variable, the in-party candidate's trial-heat poll standing, is virtually unchanged. The poll coefficient estimated in the original analysis of 11 elections was 0.48. With the inclusion of the four intervening elections, it is 0.46.
The trial-heat equation has also fared well in practice. Its forecasts were off by six-tenths of one percentage point in 1992, by 3.8 points in 1996, by 2.5 points in 2000, and by 2.6 points in 2004.Footnote 1 This is an average absolute, real world forecast error of 2.4 percentage points. For perspective, the average error in the post-election two-party vote in the American National Election Studies in these four elections was 2.8 percentage points, about half of a percentage point less accurate than the trial-heat forecast made two months before the election. The trial-heat forecasts have been only a half of a percentage point less accurate than the average final pre-election Gallup Poll's error of 1.8 percentage points in these elections.
There has been only one important adjustment in the trial-heat equation since its inception.Footnote 2 Based on the experience in the 2000 election as well as on a growing body of research indicating that voters are less inclined to vote retrospectively in open-seat contests (Hibbing and Alford Reference Hibbing and Alford1981; Miller and Wattenberg Reference Miller and Wattenberg1985; Nadeau and Lewis-Beck Reference Nadeau and Lewis-Beck2001; King Reference King2001; Norpoth Reference Norpoth, Dorussen and Taylor2002), the model was adjusted in 2001 to reflect the more muted effects of the economy on the vote for non-incumbent in-party candidates (successor candidates). While one would ideally take the open-seat difference into account through an interaction term, the small number of cases militates against this option. Instead, with theoretical expectations and empirical findings suggesting that successor candidates cannot escape the association with their party's record nor are held fully accountable for that record, the trial-heat model's specification of economic effects split the difference and supposes that successor candidates receive half the credit or blame for the economy that an incumbent would receive (Campbell Reference Campbell2001a; Reference Campbell2001b). To clarify when the economy would be a liability rather than an asset, the economic variable is now calculated as the difference between the GDP and an estimated neutral point of 2.5% growth.Footnote 3
Before the 2004 election, I also added a companion forecasting equation to address possible problems caused by changes in convention scheduling. In order to maximize the impact of public funding of the general election campaigns, the parties in recent years moved their conventions to later in August. Since conventions normally produce bumps in the polls that are partly temporary in nature, there is a danger that Labor Day preference polls for the party holding the second convention could be artificially inflated. As a precaution, I estimated a second forecasting model similar to the trial-heat equation, except that it employs the preconvention preference polls and the net convention bump for the candidates in lieu of the Labor Day preference poll number alone.
The Original and Convention Bump Models
Table 1 presents the original and its companion convention-bump equations. As the accuracy measures attest (adjusted R2, standard error of estimate, mean and median out-of-sample errors, and the number of elections with errors in excess of three points), both models are quite strong, but the trial-heat equation has been generally the more accurate of the two. The median out-of-sample errors indicate that the trial-heat forecast typically can be expected to miss the actual vote by about 1.3 percentage points and that the convention-bump forecast can be expected to be off by about 1.6 percentage points.
The Trial-Heat Forecasting Equations, 1948–2004

Note: N = 15. The coefficients in parentheses are t-ratios. All coefficients are significant at p < .01, one-tailed. The successor specification halves both the GDP growth rate variable when an incumbent was not seeking election. This includes the five elections of 1952, 1960, 1968, 1988, and 2000. The mean errors with and without an incumbent in the race are of out-of-sample errors.
The forecast based on the trial-heat model can be interpreted as a sophisticated reading of the polls as predictors of the national vote. In their historical context, the preference-poll margins for in-party candidates at Labor Day should be discounted by about 54% (1 − .461) and adjusted by the contemporary context reflected by the state of the pre-campaign economy and by the candidate's in-party status taken into account by the equation's constant. The convention-bump model can be similarly interpreted, only discounting the pre-convention poll margin by almost 57% (1 − .434) and adding to it a more heavily discounted net convention bump (1 − .248) for the candidates.
Theoretical Foundations
It is worth noting that both versions of the trial-heat models are grounded in well-established electoral theories. There is a clear basis of the models in economic voting theories (Erikson Reference Erikson1989; Lewis-Beck Reference Lewis-Beck1988), but their theoretical foundations extend far more broadly than this. In drawing heavily upon the preference polls, the models reflect both retrospective (Lippmann Reference Lippmann1925; Key Reference Key1966; Tufte Reference Tufte1978) and (pre-campaign) prospective (Downs Reference Downs1957; Fiorina Reference Fiorina1981) evaluations by the voters. While some voters may simply cast a verdict on whether they are satisfied with the performance of the in-party, other voters evaluate the issue positions, values, and character traits of the candidates and can do much of this even before the general-election campaign gets underway. Yet others may weigh both retrospective and prospective considerations in forming early vote inclinations. Unlike approval ratings, the trial-heat polls tap evaluations produced by whatever mix of prospective and retrospective considerations that voters in a particular year find convincing. The use of the early preference polls also allows the forecast to reflect the candidates' relative success in uniting their parties' bases at the outset of the campaign. This is an important aspect of the models since early party unity is more important to the overall vote than either the unity of partisans deciding later in the campaign (Campbell Reference Campbell, Pfiffner and Davidson2007) or the division of later-deciding swing voters (Campbell Reference Campbell and Mayer2008b).
The trial-heat forecasting models are also grounded in theories of campaign effects (Lazarsfeld, Berelson, and Gaudet Reference Lazarsfeld, Berelson and Gaudet1944; Campbell Reference Campbell2008a). Presidential campaigns are intensely fought, highly competitive, and very partisan affairs in which many voters decide how they will vote even before the campaign begins and are on guard against efforts to manipulate them. In their campaigns, the candidates also must deal with many circumstances (issues and character traits) that are in place before these campaigns begin. As a result, though early work underestimated the impact of campaigns (Lazarsfeld Reference Lazarsfeld1944), the effects of presidential campaigns are both limited and largely systematic (and therefore predictable).Footnote 4 The predictability of campaign effects explains why election results can be predicted quite accurately before the campaign takes place even though the subsequent campaign exerts more than minimal effects on the election results (Campbell Reference Campbell2008a).
The Trial-Heat Difference
Though the trial-heat forecasting models share some common foundations with other forecasting models (the impact of the economy and retrospective evaluations), there are also at least three important differences. In general, these differences claim that preference polls by the time of the conventions are superior to presidential approval ratings in forecasting the vote.
First, as noted above, the trial-heat models do not presume that elections can be best predicted solely using factors that might affect (e.g., the election-year economy) or reflect (e.g., presidential approval ratings) retrospective evaluations by the voters. The models do not assume that voters are purely retrospective in their evaluations as would appear to be the case of models relying on presidential approval ratings or those lacking public-opinion indicators (Fair Reference Fair2002). The trial-heat models assume that the candidates may matter—that the vote might have been different in 1976 if the Republicans had nominated Ronald Reagan instead of Gerald Ford, in 1980 if the Democrats had nominated Ted Kennedy instead of Jimmy Carter, and in 2008 if Hillary Clinton and Mike Huckabee had been the major party candidates instead of Barack Obama and John McCain. Note that the trial-heat models do not assume that the candidates do make a difference, only that they might make a difference. Early voter reactions to the actual candidates in the race as reflected in the post-convention preference polls would seem to be worth knowing in making a prediction of the November vote.
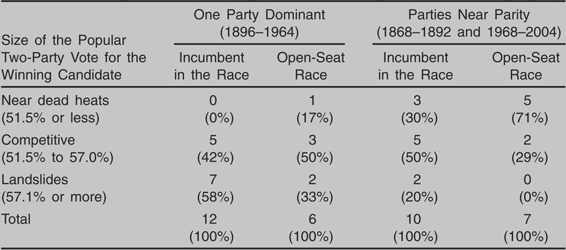
Second, the trial-heat models accommodate the possibility that open-seat elections may significantly differ from elections with incumbents (Campbell Reference Campbell2008a; Weisberg Reference Weisberg2002). Open-seat elections have been more closely decided and, as already noted, may be less retrospective than elections with an incumbent in the race. Table 2 displays election results since 1868 sorted by incumbency and by party competition. Despite the small number of elections (N = 35), party and incumbency effects are clear. Landslides are more common in one-party-dominant eras with incumbents in the race. Near dead-heat elections, on the other hand, are most likely in open-seat elections in eras of competitive parties. Five of the seven open seat elections in times of party parity (like 2008) were near dead-heat elections and none were landslides.Footnote 5
Party Parity, Incumbency, and Competitiveness of the Election, 1868–2004

Note: The one-party-dominant period from 1896 to 1964 includes a Republicandominant period from 1896 to 1928 and a Democratic-dominant period from 1932 to 1964.
The less retrospective nature of open-seat elections is evident from bivariate regressions of presidential approval ratings on the in-party vote. Again, despite few cases, the evidence is still telling. With an incumbent in the race, approval ratings alone account for two-thirds of the variance in the vote. In open-seat contests, the effect of the president's approval rating on the vote is well short of conventional statistical significance and accounts for less than a quarter of the vote variance (adjusted R2 = 0.21 compared to 0.67). In short, the greater competition and less retrospective character of open-seat elections makes preferences polls particularly better suited than presidential approval ratings to predict the vote in open-seat elections.
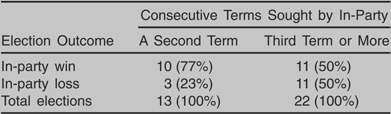
Third, the trial-heat models also differ in what they exclude. Several models, most notably Abramowitz's (Reference Abramowitz2004), indicate that there is a difference between a party seeking a third term or more and a party seeking a second term. This is often interpreted as voters deciding that it is “time for a change” after a party has been in office for two terms. There is, in fact, a difference between a party seeking a second term as opposed to a third-plus term, but the trial-heat models are unaffected by this difference because the difference is captured by the preference polls.Footnote 6 Moreover, the difference is the result of a second-term advantage for the in-party rather than a third-term disadvantage. Table 3 displays the reelection rates of parties since 1868 seeking a second term and those seeking longer tenures. The pattern is clear. Of the 13 in-party candidates seeking a second party term, 10 (77%) have won. Of the 22 in-party candidates seeking more than a second term, as many have lost as won. In short, there is an advantage in seeking a contract renewal for a second term, but the parties are on even footing thereafter.
Consecutive Terms and Election Outcomes, 1868–2004

Note: An in-party win is coded so that winning a plurality of the national two-party popular vote counts as a victory. The three in-party losses in seeking a second consecutive term are Benjamin Harrison's loss to Grover Cleveland in 1892, William Jennings Bryan's loss to William McKinley in 1896, and Jimmy Carter's loss to Ronald Reagan in 1980.
The 2008 Election
What should we anticipate in 2008? Based on purely retrospective calculations, the answer should be simple. With President Bush's extremely low approval ratings (a paltry 31% in mid-July) and a sputtering economy (a first quarter GDP growth rate of only 1.0%), one would suppose that Barack Obama would coast to an easy victory. One might even go so far as to anticipate a Democratic landslide.
There are, however, good reasons to think that a big Obama win might not be in the cards. If voters are not purely retrospective or, at least, consider the presidential candidates' records as well as the administration's performance, if open-seat elections are more prospectively decided and more closely fought, and if elections for third-terms are fought on a level playing field rather than one tilted against the in-party, then we may be in for tight race.
A number of factors in the 2008 election may also offset the Democrats' initial advantages. First, the way candidates win their nominations often affects their chances in winning their election and this may favor the Republicans this year. Barack Obama survived an unusually protracted and intense nomination battle with Hillary Clinton. Exit polls in the later primaries indicated that large numbers of Clinton supporters were, at least at that time, disinclined to support Obama. Indeed, Obama did not fare all that well in the later Democratic state contests—losing nine of the last 15 to Clinton. McCain had his own problems among conservative Republicans who were unenthusiastic about his candidacy and uneasy about his deviations from a number of conservative policy positions (from campaign finance reform to immigration policies), but generally seemed resigned to support the Republican candidate as “the lesser of two evils.”
Second, as candidates, Obama would appear to bring more liabilities to the campaign than McCain. Beside a number of embarrassing associations, Obama's voting record during his brief tenure in the Senate was extremely liberal and McCain's voting record over the same period was moderately conservative. Using both the American Conservative Union and the Americans for Democratic Action ratings of important roll call votes in the U.S. Senate in 2006 and 2007 (and correcting for missed votes and flipping the ADA ratings to convert its liberalism index into a conservatism index), Senator Obama voted for the conservative position 5% of the time and Senator McCain voted for the conservative position 76% of the time. At least by their records in the Senate, Obama is about as liberal as it was possible to be, while McCain is centered between a perfectly moderate position and consistent conservatism. Though the nation is highly polarized and energizing the base is vital, winning elections still requires winning votes in the political center and McCain's record should have greater appeal to centrists than Obama's record.
And then there is the great unknown: with Barack Obama's nomination as the first African American presidential candidate of a major political party, there is the question of whether race will affect the election and, if so, how? There is likely to be a surge of turnout among African Americans to Obama's benefit as well as some voting against Obama on racial grounds. The net effect of this racial voting is unclear and may well become enmeshed with ideological considerations. These factors may also present particular challenges to the trial-heat forecasts since there is a history of racial influences not being freely expressed in the preference polls.
So, what should we anticipate? What are the forecasts of the trial-heat forecast and its companion convention bump equation? First, the Bureau of Economic Analysis' August release of the real GDP growth rate in the second quarter was 3.3% (annualized). Second, the preference poll conducted by Gallup from September 5 to 7, the first poll in September after the conventions, indicated that 49% expressed a preference for Senator John McCain, 44% expressed a preference for Senator Barack Obama, and that the remaining 7% favored a third-party candidate or were undecided. Converted to two-party preferences, Senator McCain as the in-party candidate had 52.7% of the two-party split. Plugging the second-quarter growth rate and the Labor Day preference poll numbers into the trial-heat equation produces a forecast that Senator McCain should be expected to receive 52.7% of the two-party popular vote. Based on the out-of-sample errors of this equation, the likelihood that Senator McCain will receive the vote plurality is 83%. The companion convention-bump equation predicts a vote of 52.2%. This is based on the pre-convention preference poll split of 50% for McCain, a net convention bump of 2.7%, and the second-quarter GDP growth rate used in the trial-heat forecast equation. Based on the out-of-sample errors of this equation, there is a 76% probability that Senator McCain will receive a plurality of the national two-party popular vote.