1. Introduction
Optimal trading strategies in dynamic portfolio optimization problems depend crucially on the drift of the underlying asset price processes. However, drift parameters are notoriously difficult to estimate from historical asset prices. Drift processes tend to fluctuate randomly over time and, even if they were constant, long time series would be needed to estimate them with a satisfactory degree of precision. For these reasons, practitioners incorporate external sources of information such as news, company reports, ratings, or their own intuitive views when determining portfolio strategies. These sources of information are called expert opinions. In the classical one-period Markowitz model this leads to the well-known Black–Litterman approach, where Bayesian updating is used to improve return predictions [Reference Black and Litterman3].
In this paper we consider a financial market where returns depend on an underlying drift process which is unobservable due to noise from a Brownian motion. This setting has already been studied in [Reference Gabih, Kondakji, Sass and Wunderlich10] and [Reference Sass, Westphal and Wunderlich22]. For estimating the hidden drift we consider the conditional distribution of the drift given the available observations, the so-called filter. The best estimate for the hidden drift process in a mean-square sense is the conditional mean of the drift given the available information. A measure for the goodness of this estimator is its conditional covariance matrix. In our setting, the filter is completely characterized by the conditional mean and the conditional covariance matrix since we deal with Gaussian distributions.
For investors who observe only the return process, the filter is the classical Kalman filter. An additional source of information is provided by expert opinions which we model as unbiased drift estimates arriving randomly at discrete points in time. Investors who have access to these expert opinions update their current drift estimates at each arrival time. These updates decrease the conditional covariance, hence they yield better estimates. This can be seen as a continuous-time version of the static Black–Litterman approach.
We investigate in detail an investor who observes both the return process and the discrete-time expert opinions, and study the asymptotic behavior of the filter as the arrival intensity of expert opinions tends to infinity. We assume that expert opinions arrive randomly at the jump times of a Poisson process. A higher intensity of expert opinions is only available at the cost of the accuracy of single expert opinions. In other words, as the frequency of expert opinions increases, their variance becomes larger. This allows us to derive a certain asymptotic behavior that yields a reasonable approximation of the filter. More precisely, we prove  $\textrm{L}\rule{0pt}{7.5pt}^p$-convergence of the conditional mean and covariance matrices as the frequency of information dates goes to infinity. Our limit theorems imply that the information obtained from the discrete-time expert opinions is asymptotically the same as that from observing a certain diffusion process with the same drift as the return process. That process can be interpreted as a continuous-time expert who permanently delivers noisy information about the drift. Hence, we can derive approximations of the filter for high-frequency discrete-time expert opinions which we call diffusion approximations. These are useful since the limiting filter is easy to compute whereas the updates for the discrete-time expert opinions lead to a computationally involved filter. This is extremely helpful for deriving simplified approximate solutions of utility maximization problems.
The idea of a continuous-time expert is in line with [Reference Davis and Lleo7] which studied an approach called “Black–Litterman in continuous time” (BLCT). Our diffusion approximations show how the BLCT model can be obtained as a limit of BLCT models with discrete-time experts. The first papers addressing BLCT were [Reference Frey, Gabih and Wunderlich8, Reference Frey, Gabih and Wunderlich9], which considered a hidden Markov model for the drift and expert opinions arriving at the jump times of a Poisson process. Convergence of the discrete-time Kalman filter to the continuous-time equivalent has been addressed, e.g. in [Reference Salgado, Middleton and Goodwin21] or [Reference Aalto1], for deterministic information dates. Our results, however, do not follow directly from these convergence results even if we restrict to deterministic information dates because in our case a suitable continuous-time expert has to be constructed first. The discrete-time expert opinions are then not simply a discretization of the continuous-time expert. Further, we focus on random rather than deterministic information dates. Coquet et al. [Reference Coquet, Mémin and Słominski6] considered weak convergence of filtrations which allows the proof of convergence of conditional expectations in a quite general setting. However, their results do not directly apply to our situation since the approximating sequence of filtrations in our case is not included in the limit filtration.
In the literature, diffusion approximations also appear in other contexts, e.g. in operations research and actuarial mathematics. The basic idea is to replace a complicated stochastic process by an appropriate diffusion process which is analytically more tractable. For an introduction to diffusion approximations based on the theory of weak convergence and applications to queueing systems we refer to [Reference Glynn12]. In risk theory the application of diffusion approximations for computing ruin probabilities goes back to [Reference Iglehart14]. We also refer to [Reference Grandell13, Section 1.2], [Reference Schmidli23, Sections 5.10 and 6.5], and [Reference Asmussen and Albrecher2, Section V.5], as well as the references therein. The starting point is the classical Cramér–Lundberg model where the cumulated claim sizes and finally the surplus of an insurance company are modeled by a compound Poisson process. However, these classical results for compound Poisson processes cannot be applied directly to our problem. Here, the jumps of the filter processes do not constitute a sequence of independent and identically distributed random variables. Due to the Bayesian updating of the filter at information dates, the jump size distribution depends on the value of the filter at that time. This requires special techniques for proving limit theorems. To the best of our knowledge these techniques constitute a new contribution to the literature.
The paper is organized as follows. In Section 2 we introduce the model for our financial market including expert opinions. For different information regimes, i.e. for investors with different sources of information, we state the dynamics of the corresponding filter. Section 3 investigates the situation where the discrete-time expert opinions arrive at the jump times of a standard Poisson process. For an investor observing returns and discrete-time expert opinions we show  $\textrm{L}\rule{0pt}{7.5pt}^p$-convergence of the corresponding conditional mean and conditional covariance matrix to those of an investor observing the returns and the continuous-time expert when the intensity of the Poisson process goes to infinity. Section 4 provides an application of the convergence results to a utility maximization problem, and in Section 5 we give a numerical example to illustrate our theoretical results. Appendix A contains the proofs of Theorems 3.1 and 3.2.
Throughout the paper we use the notation  $I_d$ for the identity matrix in
 $\mathbb{R}^{d\times d}$. For a symmetric and positive-semidefinite matrix
 $A\in\mathbb{R}^{d\times d}$ we call a symmetric and positive-semidefinite matrix
 $B\in\mathbb{R}^{d\times d}$ the square root of A if
 $B^2=A$, and write
 $A^{\frac{1}{2}}=B$. Whenever A is a matrix,
 $\lVert A\rVert$ denotes the spectral norm of A.
2. Market model and filtering
2.1. Financial market model
We consider a financial market with one risk-free and multiple risky assets. The basic model is the same as in [Reference Sass, Westphal and Wunderlich22]. In the following, we denote by  $T>0$ a finite investment horizon and fix a filtered probability space
 $(\Omega,\mathcal{G},\mathbb{G},\mathbb{P})$ where the filtration
 $\mathbb{G}=(\mathcal{G}_t)_{t\in[0, T]}$ satisfies the usual conditions. All processes are assumed to be
 $\mathbb{G}$-adapted. The market consists of one risk-free bond with constant deterministic interest rate
 $r\in\mathbb{R}$, and d risky assets such that the d-dimensional return process follows the stochastic differential equation
 \[ \textrm{d} R_t = \mu_t\,\textrm{d} t+\sigma_R\,\textrm{d} W^R_t. \]
Here,  $W^R=(W^R_t)_{t\in[0, T]}$ is an m-dimensional Brownian motion,
 $m\geq d$, and we assume that
 $\sigma_R\in\mathbb{R}^{d\times m}$ has full rank. The drift
 $\mu$ is an Ornstein–Uhlenbeck process with
 \[ \textrm{d} \mu_t = \alpha (\delta - \mu_t)\,\textrm{d} t + \beta\,\textrm{d} B_t, \]
where  $\alpha$ and
 $\beta\in\mathbb{R}^{d\times d}$,
 $\delta\in\mathbb{R}^d$, and
 $B=(B_t)_{t\in [0, T]}$ is a d-dimensional Brownian motion independent of
 $W^R$. We assume that
 $\alpha$ is a symmetric and positive-definite matrix to ensure that the expectation and covariance of the drift process stay bounded and the drift process becomes asymptotically stationary. This is reasonable from an economic point of view. We further assume that
 $\mu_0\sim\mathcal{N}(m_0,\Sigma_0)$ for some
 $m_0\in\mathbb{R}^d$ and some
 $\Sigma_0\in\mathbb{R}^{d\times d}$ which is symmetric and positive semidefinite, and that
 $\mu_0$ is independent of B and
 $W^R$. We denote
 $m_t\,:\!=\,\mathbb{E}[\mu_t]$ and
 $\Sigma_t\,:\!=\,\cov(\mu_t)$.
Investors in this market know the model parameters and are able to observe the return process R but not the underlying drift process  $\mu$. Additionally, we include expert opinions which arrive at discrete time points and give an unbiased estimate of the state of the drift at that time point. Let
 $(T_k)_{k\in \mathbb{N}}$ be an increasing sequence with values in (0,T]. The
 $T_k$,
 $k\in \mathbb{N}$, are the time points at which expert opinions arrive. For the sake of convenience we also write
 $T_0=0$, although there is no expert opinion arriving at time zero. The expert view at time
 $T_k$ is modelled as an
 $\mathbb{R}^d$-valued random vector
 \begin{equation} Z_k = \mu_{T_k}+(\Gamma_k)^{\frac12}\varepsilon_k,\end{equation}
where the matrix  $\Gamma_k\in\mathbb{R}^{d\times d}$ is symmetric and positive definite and
 $\varepsilon_k$ is multivariate
 $\mathcal{N}(0,I_d)$-distributed. We assume that the sequence of
 $\varepsilon_k$ is independent, and also that it is independent of both
 $\mu_0$ and the Brownian motions B and
 $W^R$. Note that, given
 $\mu_{T_k}$, the expert opinion
 $Z_k$ is multivariate
 $\mathcal{N}(\mu_{T_k},\Gamma_k)$-distributed. That means that the expert view at time
 $T_k$ gives an unbiased estimate of the state of the drift at that time. The matrix
 $\Gamma_k$ reflects the reliability of the expert. Note that the time points
 $T_k$ do not need to be deterministic. However, we impose the additional assumption that the sequence
 $(T_k)_{k\in \mathbb{N}}$ is independent of the
 $(\varepsilon_k)_{k\in \mathbb{N}}$, of the Brownian motions in the market, and of
 $\mu_0$. This essentially says that the timing of information dates carries no additional information about the drift
 $\mu$. Nevertheless, information on the sequence
 $(T_k)_{k\in \mathbb{N}}$ may be important for optimal portfolio decisions.
Our main results in Section 3 address the question of how to obtain rigorous convergence results when the frequency of information dates increases. We will show that, for certain sequences of expert opinions, the information drawn from these expert opinions, expressed by the filter, is for a large number of expert opinions essentially the same as the information one gets from observing yet another diffusion process. This diffusion process can then be interpreted as an expert who gives a continuous-time estimation about the state of the drift. Let this estimate be given by the diffusion process
 \begin{equation} \textrm{d} J_t =\mu_t\,\textrm{d} t +\sigma_J\,\textrm{d} W^J_t,\end{equation}
where  $W^J$ is an l-dimensional Brownian motion with
 $l\geq d$ that is independent of all other Brownian motions in the model and of the information dates
 $T_k$. The matrix
 $\sigma_J\in\mathbb{R}^{d\times l}$ has full rank equal to d.
2.2. Filtering for different information regimes
For being able to assess the value of information coming from observing expert opinions, we consider various investors with different sources of information; this follows the approach in [Reference Gabih, Kondakji, Sass and Wunderlich10, Reference Sass, Westphal and Wunderlich22]. The information available to an investor can be described by the investor filtration  $\mathbb{F}^H=(\mathcal{F}^H_t)_{t\in[0, T]}$, where H serves as a placeholder for the various information regimes. We work with filtrations that are augmented by
 $\mathcal{N}_{\mathbb{P}}$, the set of null sets under measure
 $\mathbb{P}$. We consider the cases
 \begin{alignat*}{3} &\mathbb{F}^R && =(\mathcal{F}^R_t)_{t\in[0, T]} && \text{ where } \mathcal{F}^R_t=\sigma((R_s)_{s\in[0,t]})\vee\sigma(\mathcal{N}_{\mathbb{P}}), \\ &\mathbb{F}^Z && =(\mathcal{F}^Z_t)_{t\in[0, T]} && \text{ where } \mathcal{F}^Z_t=\sigma((R_s)_{s\in[0,t]})\vee\sigma((T_k,Z_k)_{T_k\leq t})\vee\sigma(\mathcal{N}_{\mathbb{P}}), \\ &\mathbb{F}^J && =(\mathcal{F}^J_t)_{t\in[0, T]} && \text{ where } \mathcal{F}^J_t=\sigma((R_s)_{s\in[0,t]})\vee\sigma((J_s)_{s\in[0,t]})\vee\sigma(\mathcal{N}_{\mathbb{P}}).\end{alignat*}
We call the investor with filtration  $\mathbb{F}^H=(\mathcal{F}^H_t)_{t\in[0, T]}$,
 $H\in\{R,Z,J\}$, the H-investor. Note that the R-investor observes only the return process R, the Z-investor combines the information from observing the return process and the discrete-time expert opinions
 $Z_k$, and the J-investor observes the return process and the continuous-time expert J.
The investors in our financial market make trading decisions based on their estimations about the drift process  $\mu$. The conditional distribution of the drift under partial information is called the filter. In the mean-square sense, an optimal estimator for the drift at time t given the available information is then the conditional mean
 ${m^{H}_{t}}\,:\!=\,\mathbb{E}[\mu_t\,|\,\mathcal{F}^H_t]$. How close this estimator is to the true state of the drift can be assessed by the corresponding conditional covariance matrix
 \[ {Q^{H}_{t}}\,:\!=\, \mathbb{E}\bigl[(\mu_t-{m^{H}_{t}})(\mu_t-{m^{H}_{t}})^\top\,\big|\,\mathcal{F}^H_t\bigr]. \]
Since we deal with Gaussian distributions, the filter is also Gaussian and completely characterized by conditional mean and conditional covariance. We state in the following the dynamics of the filters for the various investors. For the R-investor, we are in the setting of the well-known Kalman filter, see e.g. [Reference Liptser and Shiryaev18, Theorem 10.3].
Lemma 2.1. The filter of the R-investor is Gaussian. The conditional mean  ${m^{R}_{}}$ follows the dynamics
 \[ \textrm{d}{m^{R}_{t}} = \alpha(\delta-{m^{R}_{t}})\,\textrm{d} t + {Q^{R}_{t}}(\sigma_R\sigma_R^\top)^{-1}(\textrm{d} R_t-{m^{R}_{t}}\,\textrm{d} t), \]
where  ${Q^{R}_{}}$ is the solution of the ordinary Riccati differential equation
 \[ \frac{\textrm{d}}{\textrm{d} t} {Q^{R}_{t}} = -\alpha {Q^{R}_{t}} -{Q^{R}_{t}}\alpha + \beta\beta^\top - {Q^{R}_{t}}(\sigma_R\sigma_R^\top)^{-1}{Q^{R}_{t}}. \]
The initial values are  ${m^{R}_{0}}=m_0$ and
 ${Q^{R}_{0}}=\Sigma_0$.
Note that  ${Q^{R}_{t}}$ is deterministic since it follows an ordinary Riccati differential equation. Next, we consider the J-investor who observes the diffusion processes R and J. The distribution of the filter and the dynamics of
 ${m^{J}_{}}$ and
 ${Q^{J}_{}}$ again follow immediately from the Kalman filter theory. Just like for the R-investor, the conditional covariance matrix is deterministic.
Lemma 2.2. The filter of the J-investor is Gaussian. The conditional mean  ${m^{J}_{}}$ follows the dynamics
 \[ \textrm{d} {m^{J}_{t}} = \alpha(\delta-{m^{J}_{t}})\,\textrm{d} t + {Q^{J}_{t}} \begin{pmatrix} (\sigma_R\sigma_R^\top)^{-1} \\[1mm] (\sigma_J\sigma_J^\top)^{-1} \end{pmatrix}^\top \begin{pmatrix} \textrm{d} R_t-{m^{J}_{t}}\textrm{d} t \\[1mm] \textrm{d} J_t-{m^{J}_{t}}\textrm{d} t \end{pmatrix}, \]
where  ${Q^{J}_{}}$ is the solution of the ordinary Riccati differential equation
 \begin{equation*} \frac{\textrm{d}}{\textrm{d} t} {Q^{J}_{t}} = -\alpha{Q^{J}_{t}}-{Q^{J}_{t}}\alpha+\beta\beta^\top-{Q^{J}_{t}}\bigl((\sigma_R\sigma_R^\top)^{-1}+(\sigma_J\sigma_J^\top)^{-1}\bigr) {Q^{J}_{t}} \end{equation*}
with  ${m^{J}_{0}}=m_0$ and
 ${Q^{J}_{0}}=\Sigma_0$.
We now come to the Z-investor. Recall that this investor observes the return process R continuously in time, and at (possibly random) information dates  $T_k$ the expert opinions
 $Z_k$. We state the dynamics of
 ${m^{Z}_{}}$ and
 ${Q^{Z}_{}}$ in the following lemma.
Lemma 2.3. Given a sequence of information dates  $T_k$, the filter of the Z-investor is Gaussian. The dynamics of the conditional mean and conditional covariance matrix are given as follows:
(i) Between the information dates
 $T_k$ and $T_{k+1}$, $k\in\mathbb{N}_0$,
for
\[ \textrm{d} {m^{Z}_{t}} = \alpha (\delta-{m^{Z}_{t}})\,\textrm{d} t +{Q^{Z}_{t}} (\sigma_R\sigma_R^\top)^{-1}(\textrm{d} R_t-{m^{Z}_{t}} \,\textrm{d} t) \]
$t\in[T_k,T_{k+1})$, where ${Q^{Z}_{}}$ follows the ordinary Riccati differential equation
for
\[ \frac{\textrm{d}}{\textrm{d} t} {Q^{Z}_{t}} = -\alpha{Q^{Z}_{t}} -{Q^{Z}_{t}}\alpha +\beta\beta^\top - {Q^{Z}_{t}}(\sigma_R\sigma_R^\top)^{-1}{Q^{Z}_{t}} \]
$t\in[T_k,T_{k+1})$. The initial values are ${m^{Z}_{T_k}}$ and ${Q^{Z}_{T_k}}$, with ${m^{Z}_{0}}=m_0$, ${Q^{Z}_{0}}=\Sigma_0$.
-
(ii) The update formulas at information dates
$T_k$, $k\in\mathbb{N}$, are
where
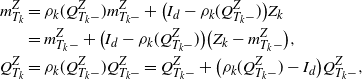
\begin{equation*} \begin{aligned} {m^{Z}_{T_k}} &= \rho_k({Q^{Z}_{T_k-}}) {m^{Z}_{T_k-}}+\bigl(I_d-\rho_k({Q^{Z}_{T_k-}})\bigr)Z_k \\ &= {m^{Z}_{T_k-}}+\bigl(I_d-\rho_k({Q^{Z}_{T_k-}})\bigr)\bigl(Z_k-{m^{Z}_{T_k-}}\bigr),\\ {Q^{Z}_{T_k}} &= \rho_k({Q^{Z}_{T_k-}}){Q^{Z}_{T_k-}} ={Q^{Z}_{T_k-}}+\bigl(\rho_k({Q^{Z}_{T_k-}})-I_d\bigr){Q^{Z}_{T_k-}}, \end{aligned} \end{equation*}
$\rho_k({Q^{}_{}})=\Gamma_k({Q^{}_{}}+\Gamma_k)^{-1}$.









For deterministic time points  $T_k$, the above lemma is Lemma 2.3 of [Reference Sass, Westphal and Wunderlich22], where a detailed proof is given. For the more general case where the
 $T_k$ need not be deterministic, the claim follows from the fact that the sequence
 $(T_k)_{k\in \mathbb{N}}$ and the drift process
 $\mu$ are independent [Reference Westphal24, Lemma 6.4].
Note that the dynamics of  ${m^{Z}_{}}$ and
 ${Q^{Z}_{}}$ between information dates are the same as for the R-investor. The values at an information date
 $T_k$ are obtained from a Bayesian update. If we have non-deterministic information dates
 $T_k$, then in contrast to both the R-investor and the J-investor, the conditional covariance matrices
 ${Q^{Z}_{}}$ of the Z-investor are non-deterministic since updates take place at random times.
In the proofs of our main results we repeatedly need to find upper bounds for various expressions that involve the conditional covariance matrices  ${Q^{J}_{}}$ or
 ${Q^{Z}_{}}$. A key tool is the boundedness of these matrices. Here, it is useful to consider a partial ordering of symmetric matrices. For symmetric matrices
 $A,B\in\mathbb{R}^{d\times d}$ we write
 $A\preceq B$ if
 $B-A$ is positive semidefinite. Note that
 $A\preceq B$ in particular implies
 $\lVert A\rVert\leq\lVert B\rVert$.
Lemma 2.4. For any sequence  $(T_k,Z_k)_{k\in \mathbb{N}}$ we have
 ${Q^{Z}_{t}}\preceq{Q^{R}_{t}}$ and
 ${Q^{J}_{t}}\preceq{Q^{R}_{t}}$ for all
 $t\geq 0$. In particular, there exists a constant
 $C_{{Q^{}_{}}}>0$ such that, for all
 $t\in[0, T]$,
 \[ \lVert{Q^{Z}_{t}}\rVert\leq C_{{Q^{}_{}}} \quad {and} \quad \lVert{Q^{J}_{t}}\rVert\leq C_{{Q^{}_{}}}. \]
For a detailed proof, see [Reference Westphal24, Proposition 6.6]. For proving  ${Q^{Z}_{t}}\preceq{Q^{R}_{t}}$ we can use that every update decreases the covariance, together with properties of Riccati differential equations from [Reference Kučera17]. For showing
 ${Q^{J}_{t}}\preceq{Q^{R}_{t}}$ the key idea is to use
 $\mathcal{F}^R_t\subseteq\mathcal{F}^J_t$. Boundedness then follows since there exists a positive-semidefinite matrix
 ${Q^{R}_{\infty}}$ such that
 $\lim_{t\to\infty} {Q^{R}_{t}} = {Q^{R}_{\infty}}$; see also [Reference Sass, Westphal and Wunderlich22, Theorem 4.1]. That result uses that
 $\alpha$ is symmetric and positive definite, an assumption that could be weakened for models with finite horizon T but that is reasonable from an economic point of view.
3. Diffusion approximation of filters for random information dates
In this section we investigate the asymptotic behavior of the filter for a Z-investor when the frequency of expert opinion arrivals goes to infinity. We assume that the experts’ opinions arrive at random times  $T_k$, where the waiting times
 $T_{k+1}-T_k$ between information dates are independent and exponentially distributed with rate
 $\lambda>0$. The information dates can be seen as the jump times of a Poisson process with intensity
 $\lambda$. In the following we deduce convergence results for both the conditional means and the conditional covariance matrices of the Z-investor when sending
 $\lambda$ to infinity, i.e. when expert opinions arrive more and more frequently.
We use a superscript  $\lambda$ to emphasize the dependence on the intensity. The expert opinions are of the form
 \begin{equation} Z_k^{(\lambda)} = \mu_{T_k^{(\lambda)}}+(\Gamma_k^{(\lambda)})^{\frac12}\varepsilon_k^{(\lambda)}.\end{equation}
For constant variances  $\Gamma_k^{(\lambda)}=\Gamma$ one can derive convergence to full information. More precisely,
 \[ \lim_{\lambda\to\infty} \mathbb{E}\bigl[\bigl\lVert {Q^{Z,\lambda}_{t}} \bigr\rVert\bigr] = 0 \quad \text{and} \quad \lim_{\lambda\to\infty} \mathbb{E}\bigl[\bigl\lVert {m^{Z,\lambda}_{t}} - \mu_t \bigr\rVert^2\bigr] = 0 \]
for all  $t\in (0,T]$, see [Reference Gabih, Kondakji and Wunderlich11]. This implies that for large
 $\lambda$ the Z-investor approximates the fully informed investor, and that
 ${m^{Z,\lambda}_{}}$ is a consistent estimator for the hidden drift
 $\mu$. This result heavily relies on the boundedness of the expert covariances. Here, we study a different situation where more frequent expert opinions are only available at the cost of accuracy. In other words, we assume that, as
 $\lambda$ goes to infinity, the variance of expert opinions increases. This is done for the purpose of approximating
 ${m^{Z,\lambda}_{}}$ and
 ${Q^{Z,\lambda}_{}}$ for large
 $\lambda$ and large
 $\Gamma_k^{(\lambda)}$. We will show that when
 $\Gamma_k^{(\lambda)}$ grows linearly in
 $\lambda$, the information obtained from observing the discrete-time expert opinions is asymptotically the same as that from observing the diffusion process J from (2.2).
Assumption 3.1. Let  $(N^{(\lambda)}_t)_{t\in[0, T]}$ be a standard Poisson process with intensity
 $\lambda>0$ that is independent of the Brownian motions in the model. Define the information dates
 $(T_k^{(\lambda)})_{k=1,\dots,N^{(\lambda)}_T}$ as the jump times of that process and set
 $T^{(\lambda)}_0=0$. Furthermore, let the experts’ covariance matrices be given as
 $\Gamma_k^{(\lambda)}=\Gamma^{(\lambda)}=\lambda\sigma_J\sigma_J^\top$ for
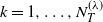 $k=1,\dots,N^{(\lambda)}_T$. Further, we assume that in (3.1) the
 $\mathcal{N}(0,I_d)$-distributed random variables
 $\varepsilon_k^{(\lambda)}$ are linked with the Brownian motion
 $W^J$ from (2.2) via
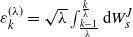 $\varepsilon_k^{(\lambda)}=\sqrt{\lambda}\int_{\frac{k-1}{\lambda}}^{\frac{k}{\lambda}}\textrm{d} W^J_s$, so that
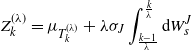 \begin{equation} Z_k^{(\lambda)} = \mu_{T_k^{(\lambda)}}+\lambda\sigma_J\int_{\frac{k-1}{\lambda}}^{\frac{k}{\lambda}}\textrm{d} W^J_s \end{equation}
is the expert opinion at information date  $T_k^{(\lambda)}$. Note that for defining the
 $Z_k^{(\lambda)}$, the Brownian motion
 $W^J$ has to be extended to a Brownian motion on
 $[0,\infty)$.
Recall that the matrix  $\sigma_J\in\mathbb{R}^{d\times l}$ is exactly the volatility of the diffusion process J with the dynamics
 \[ \textrm{d} J_t =\mu_t\,\textrm{d} t +\sigma_J\,\textrm{d} W^J_t, \]
and that  $Z_k^{(\lambda)}$ can be written as in (2.1) as
 $Z_k = \mu_{T_k}+(\Gamma_k)^{\frac12}\varepsilon_k$ with
 \[ \varepsilon_k=\sqrt{\lambda}\int_{\frac{k-1}{\lambda}}^{\frac{k}{\lambda}}\textrm{d} W^J_s\sim\mathcal{N}(0,I_l). \]
Given some realization of the drift at the random information date  $T_k^{(\lambda)}$, the only randomness in the expert opinion comes from the Brownian motion
 $W^J$. Note that there is a direct connection between the discrete expert opinions
 $Z_k^{(\lambda)}$ and the diffusion J that we interpret as our continuous expert.
In the following we will omit the superscript  $\lambda$ at the time points
 $T_k^{(\lambda)}$ for better readability, keeping the dependence on the intensity in mind.
Remark 3.1. At first glance, it seems more intuitive to construct the expert opinions as
 \[ \widetilde{Z}_k^{(\lambda)} = \mu_{T_k}+\sqrt{\lambda}\sigma_J\frac{1}{\sqrt{T_k-T_{k-1}}\,}\int_{T_{k-1}}^{T_k}\textrm{d} W^J_s \]
rather than as in (3.2). However, proving convergence of  ${m^{Z,\lambda}_{t}}$ to
 ${m^{J}_{t}}$ requires looking at the difference of a weighted sum of
 $\frac{1}{\lambda}(Z_k^{(\lambda)}-\mu_{T_k})$ and
 $\int_0^t{Q^{J}_{s}}\,\textrm{d} W^J_s$. When replacing
 $Z_k^{(\lambda)}$ with
 $\widetilde{Z}_k^{(\lambda)}$, this leads to an integral where the integrand does not have a finite variance. This is mainly due to the fact that for
 $X\sim\textrm{Exp}(\lambda)$ the expectation of
 $\frac{1}{X}$ does not exist. When considering
 $Z_k^{(\lambda)}$ instead, the difference that appears has finite variance since the additional randomness from the information dates is missing.
It is useful to express the dynamics of  ${Q^{Z,\lambda}_{}}$ and
 ${m^{Z,\lambda}_{}}$ in a way that comprises both the behavior between information dates and the jumps at times
 $T_k$. For this purpose, we work with a Poisson random measure as in [Reference Cont and Tankov5, Section 2.6]. Let
 $E=[0, T]\times\mathbb{R}^d$ and let
 $U_k$,
 $k=1,2,\dots$, be a sequence of independent multivariate standard Gaussian random variables on
 $\mathbb{R}^d$. For any
 $I\in\mathcal{B}([0, T])$ and
 $B\in\mathcal{B}(\mathbb{R}^d)$, let
 \[ N(I\times B)=\sum_{k\colon T_k\in I} \textbf{1}_{\{U_k\in B\}} \]
denote the number of jump times in I where  $U_k$ takes a value in B. Then, from [Reference Cont and Tankov5, Section 2.6.3] we know that N defines a Poisson random measure with a corresponding compensated measure
 $\tilde{N}(\textrm{d} s,\textrm{d} u)=N(\textrm{d} s,\textrm{d} u)-\lambda\,\textrm{d} s\,\varphi(u)\,\textrm{d} u$, where
 $\varphi$ is the multivariate standard normal density on
 $\mathbb{R}^d$.
Proposition 3.1. Let  $L\colon\mathbb{R}^{d\times d}\to\mathbb{R}^{d\times d}$ denote the function with
 \[ L({Q^{}_{}})=-\alpha {Q^{}_{}}-{Q^{}_{}}\alpha+\beta\beta^\top-{Q^{}_{}}(\sigma_R\sigma_R^\top)^{-1}{Q^{}_{}}. \]
Then, under Assumption 3.1 we can, for any  $t\in[0, T]$, write
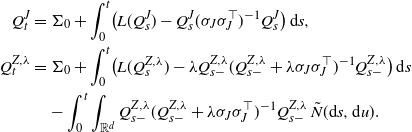 \begin{equation*} \begin{aligned} {Q^{J}_{t}} &= \Sigma_0 + \int_0^t \bigl(L({Q^{J}_{s}}) - {Q^{J}_{s}}(\sigma_J\sigma_J^\top)^{-1}{Q^{J}_{s}}\bigr)\,\textrm{d} s, \\ {Q^{Z,\lambda}_{t}} &= \Sigma_0+\int_0^t \bigl(L({Q^{Z,\lambda}_{s}})-\lambda{Q^{Z,\lambda}_{s-}}({Q^{Z,\lambda}_{s-}}+\lambda\sigma_J\sigma_J^\top)^{-1}{Q^{Z,\lambda}_{s-}}\bigr)\,\textrm{d} s \\ &\quad-\int_0^t\int_{\mathbb{R}^d}{Q^{Z,\lambda}_{s-}}({Q^{Z,\lambda}_{s-}}+\lambda\sigma_J\sigma_J^\top)^{-1}{Q^{Z,\lambda}_{s-}}\,\tilde{N}(\textrm{d} s,\textrm{d} u). \end{aligned} \end{equation*}
See [Reference Westphal24, Proposition 8.14] for a detailed proof that uses properties of the Poisson random measure, given, for instance, in [Reference Cont and Tankov5, Section 2.6.3]. The following theorem states the  $\textrm{L}\rule{0pt}{7.5pt}^p$-convergence of
 ${Q^{Z,\lambda}_{}}$ to
 ${Q^{J}_{}}$ on [0, T] as
 $\lambda$ goes to infinity.
Theorem 3.1. Let  $p\in[1,\infty)$. Under Assumption 3.1 there exists a constant
 $K_{Q, p}>0$ such that
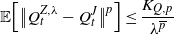 \[ \mathbb{E}\Bigl[\bigl\lVert{Q^{Z,\lambda}_{t}}-{Q^{J}_{t}}\bigr\rVert^p\Bigr] \leq \frac{K_{Q,p}}{\lambda^{\overline{p}}} \]
for all  $t\in[0, T]$ and
 $\lambda\geq 1$, where
 $\overline{p}=\min\{\frac{p}{2},1\}$. In particular,
 \[ \lim_{\lambda\to\infty} \sup_{t\in[0, T]} \mathbb{E}\Bigl[\bigl\lVert{Q^{Z,\lambda}_{t}}-{Q^{J}_{t}}\bigr\rVert^p\Bigr] = 0. \]
The proof of Theorem 3.1 is given in Appendix A. It is based on applying Gronwall’s lemma in integral form. We can also prove the  $\textrm{L}\rule{0pt}{7.5pt}^p$-convergence of the conditional means.
Theorem 3.2. Let  $p\in[1,\infty)$. Under Assumption 3.1 there exists a constant
 $K_{\mkern-2mu m,p}>0$ such that
 \[ \mathbb{E}\Bigl[\bigl\lVert {m^{Z,\lambda}_{t}}-{m^{J}_{t}}\bigr\rVert^p\Bigr]\leq \frac{K_{m,p}}{\lambda^{\frac{\overline{p}}{2}}} \]
for all  $t\in[0, T]$ and
 $\lambda\geq 1$, where
 $\overline{p}=\min\{\frac{p}{2},1\}$. In particular,
 \[ \lim_{\lambda\to\infty} \sup_{t\in[0, T]}\mathbb{E}\Bigl[\bigl\lVert {m^{Z,\lambda}_{t}}-{m^{J}_{t}}\bigr\rVert^p\Bigr] = 0. \]
The proof of Theorem 3.2 can be found in Appendix A. Theorems 3.1 and 3.2 show that under Assumption 3.1 the filter of the Z-investor converges to the filter of the J-investor. Since the latter observes the diffusion processes R and J, this implies that the information obtained from the discrete-time expert opinions is for large  $\lambda$ arbitrarily close to the information that comes with observing the continuous-time diffusion-type expert J.
This diffusion approximation of the discrete expert opinions is useful since the associated filter equations for  ${m^{J}_{}}$ and
 ${Q^{J}_{}}$ are much simpler than those for
 ${m^{Z,\lambda}_{}}$ and
 ${Q^{Z,\lambda}_{}}$ which contain updates at information dates. Computing
 ${Q^{Z,\lambda}_{}}$ on [0,T] in the multivariate case requires the numerical solution of a Riccati differential equation on each subinterval
 $[T_k, T_{k+1})$. For high intensities
 $\lambda$ this leads to very small time steps and high computing times. For computing the J-investor’s filter one has to find the solution to only one Riccati differential equation on [0,T], for which we can use more efficient numerical solvers.
Further, the conditional covariance  ${Q^{J}_{}}$ is deterministic and can be computed offline in advance, while
 ${Q^{Z,\lambda}_{}}$ is a stochastic process that has to be updated when a new expert opinion arrives. For high-frequency expert opinions one may simplify the computation of
 ${m^{Z,\lambda}_{}}$ by replacing the exact conditional covariance
 ${Q^{Z,\lambda}_{}}$ by its diffusion approximation
 ${Q^{J}_{}}$. Given the discrete-time expert’s covariance matrix
 $\Gamma$ and the arrival intensity
 $\lambda$, the volatility
 $\sigma_J$ is chosen such that
 $\sigma_J\sigma_J^\top=\lambda^{-1}\Gamma$.
Even more important are the benefits from the simpler filter equations if we consider utility maximization problems for financial markets with partial information and discrete-time expert opinions. See the next section for an application to logarithmic utility, and Remark 4.1 as well as [Reference Kondakji16, Chapters 7, 8] for the more involved power utility case where closed-form expressions for the optimal strategies are available for the J-investor but not for the Z-investor.
Remark 3.2. The assumption that  $Z_k^{(\lambda)}$ is given as in (3.1) is only needed for the proof of convergence of conditional means in Theorem 3.2. For the proof of convergence of conditional covariances in Theorem 3.1 it is sufficient to assume that the experts’ covariance matrices in (3.1) are of the form
 $\Gamma_k^{(\lambda)}=\Gamma^{(\lambda)}=\lambda\sigma_J\sigma_J^\top$.
Remark 3.3. We have derived convergence results under the assumption that the information dates are the jump times of a Poisson process. Analogous results also hold in a setting with equidistant information dates, see [Reference Westphal24, Section 8.2.1]. More precisely, if  $T^{(n)}_k=k\Delta_n$ where
 $\Delta_n=\frac{T}{n}$,
 $k=0,\dots,n$, and
 $\Gamma^{(n)}_k=\Gamma^{(n)}=\frac{1}{\Delta_n}\sigma_J\sigma_J^\top$, and we have
 \[ Z^{(n)}_k = \mu_{k\Delta_n}+\frac{1}{\Delta_n}\sigma_J\int_{k\Delta_n}^{(k+1)\Delta_n}\textrm{d} W^J_s, \]
then, for the conditional covariance matrix  ${Q^{Z,n}_{t}}$ and conditional mean
 ${m^{Z,n}_{t}}$ of the Z-investor observing the equidistant expert opinions, we also have
 \[ \lim_{n\to\infty}\sup_{t\in[0, T]}\bigl\lVert {Q^{Z,n}_{t}}-{Q^{J}_{t}}\bigr\rVert^p=0 \quad\text{and}\quad \lim_{n\to\infty}\sup_{t\in[0, T]}\mathbb{E}\Bigl[\bigl\lVert {m^{Z,n}_{t}}-{m^{J}_{t}}\bigr\rVert^p\Bigr]=0. \]
The speed of convergence in that case is even higher than for random information dates, since the additional randomness from the Poisson process is missing.
4. Application to utility maximization
Our convergence results from the previous section can be applied to a portfolio optimization problem. Let  $(\pi_t)_{t\in[0, T]}$ denote a self-financing trading strategy leading to wealth process
 $(X^{\pi}_t)_{t\in[0, T]}$ with initial capital
 $x_0>0$. Let
 $\mathcal{A}^H(x_0)$ denote the class of trading strategies that are
 $\mathbb{F}^H$-adapted and that satisfy a suitable integrability constraint. We address a utility maximization problem where investors maximize the expected logarithmic utility of terminal wealth, i.e. with value function
 \begin{equation*} V^H(x_0) = \sup\Bigl\{\mathbb{E}\bigl[\log(X^\pi_T)\bigr] \;\big|\; \pi\in\mathcal{A}^H(x_0)\Bigr\}.\end{equation*}
This utility maximization problem under partial information has been solved in [Reference Brendle4] for the case of power utility, and [Reference Karatzas and Zhao15] also addresses the case with logarithmic utility. In [Reference Sass, Westphal and Wunderlich22], the optimization problem has been solved for an H-investor with logarithmic utility in the context of this paper. Assuming that the risk-free interest rate is zero, the authors show that the optimal strategy is  $(\pi^{H,*}_t)_{t\in[0, T]}$ with
 $\pi^{H,*}_t=(\sigma_R\sigma_R^\top)^{-1}{m^{H}_{t}}$, and
 \begin{equation*} \begin{aligned} V^H(x_0) &= \log(x_0)+\frac{1}{2}\int_0^T \textrm{tr}\bigl((\sigma_R\sigma_R^\top)^{-1}\bigl(\Sigma_t+m_tm_t^\top-\mathbb{E}[{Q^{H}_{t}}]\bigr)\bigr)\,\textrm{d} t. \end{aligned}\end{equation*}
Due to the representation of the optimal strategy via the conditional means, it follows directly from Theorem 3.2 that the optimal strategy of the Z-investor converges in the  $\textrm{L}\rule{0pt}{7.5pt}^p$-sense to the optimal strategy of the J-investor as
 $\lambda$ goes to infinity.
Further, note that the value function is an integral functional of the expectation of  $({Q^{H}_{t}})_{t\in[0, T]}$. The convergence result of Theorem 3.1 therefore carries over to convergence for the respective value functions. More precisely, under Assumption 3.1 we have
 $\lim_{\lambda\to\infty} V^{Z,\lambda}(x_0) = V^J(x_0)$ for any initial wealth
 $x_0>0$. For a rigorous proof we refer to [Reference Westphal24, Corollary 9.5].
Remark 4.1. For simplicity we have restricted ourselves in this section to the case with logarithmic utility, where  $\textrm{L}^2$-convergence of conditional covariance matrices and conditional means is sufficient for proving convergence of the value functions and optimal strategies. Portfolio problems that consider power utility instead of logarithmic utility are more demanding. For power utility, the value functions can be expressed as the expectation of the exponential of a quite involved integral functional of the conditional mean. Hence, it depends on the complete filter distribution, not only on its second-order moments. Further, the optimal strategies do not depend only on the current drift estimate but contain correction terms depending on the distribution of future drift estimates. Therefore, for power utility one needs
 $\textrm{L}\rule{0pt}{7.5pt}^p$-convergence for
 $p>2$ to prove convergence of the value functions;
 $\textrm{L}^2$-convergence would not be enough.
For the portfolio problem of the Z-investor in the power utility case, closed-form expressions as above for the optimal strategies in terms of the filter are no longer available. One can apply the dynamic programming approach to the associated stochastic optimal control problem. For the Z-investor this leads to dynamic programming equations (DPEs) for the value function in the form of a partial integro-differential equation (PIDE) [Reference Kondakji16, Chapter 7]. Solutions of those DPEs can usually only be determined numerically. The optimal strategy can be given in terms of that value function and the filter processes  ${m^{Z,\lambda}_{}}$ and
 ${Q^{Z,\lambda}_{}}$. Meanwhile, for the J-investor the above approach leads to DPEs which can be solved explicitly such that the value function can be given in terms of solutions to some Riccati equations. Again, the optimal strategies can be computed in terms of the value function and the filter processes
 ${m^{J}_{}}$ and
 ${Q^{J}_{}}$.
Diffusion approximations for the filter and the value function thus allow us to find approximate solutions for the Z-investor which can be given in closed form and with less numerical effort. This is extremely helpful for financial markets with multiple assets since the numerical solution of the resulting problem suffers from the curse of dimensionality and becomes intractable. While for a model with a single asset the PIDE has two spatial variables, for two assets there are already five and for three assets nine variables.
5. Numerical example
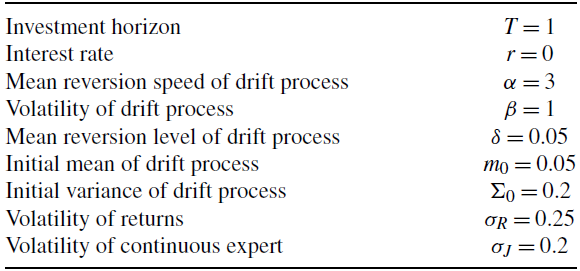
In this section we illustrate our convergence results by a numerical example. For simplicity, we assume that there is only  $d=1$ risky asset in the market. Let the parameters of our model be defined as in Table 1.
Model parameters for the numerical example.
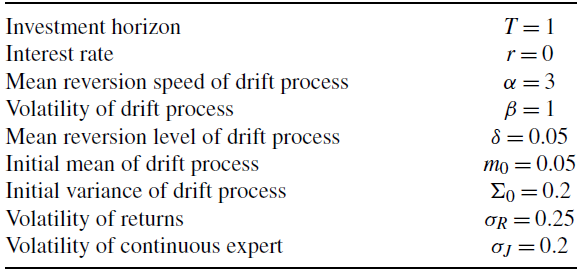
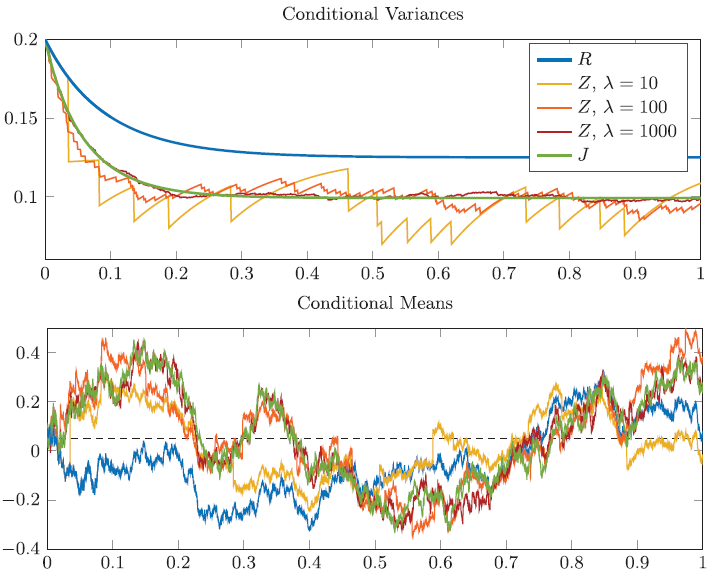
Figure 1 shows, in addition to the filters of the R- and J-investor, the filters of the Z-investor for different intensities  $\lambda$. In the upper plot one sees a realization of the conditional variances
 ${Q^{R}_{}}$,
 ${Q^{J}_{}}$, and
 ${Q^{Z,\lambda}_{}}$ plotted against time. The lower plot shows a realization of the conditional means
 ${m^{R}_{}}$,
 ${m^{J}_{}}$, and
 ${m^{Z,\lambda}_{}}$ for the same parameters.
A simulation of the filters for random information dates. The upper subplot shows the conditional variances of the R- and J-investor as well as realizations of  ${Q^{Z,\lambda}_{}}$ for various intensities
 $\lambda$. The lower subplot shows a realization of the corresponding conditional means. The dashed black line is the mean reversion level
 $\delta$ of the drift.
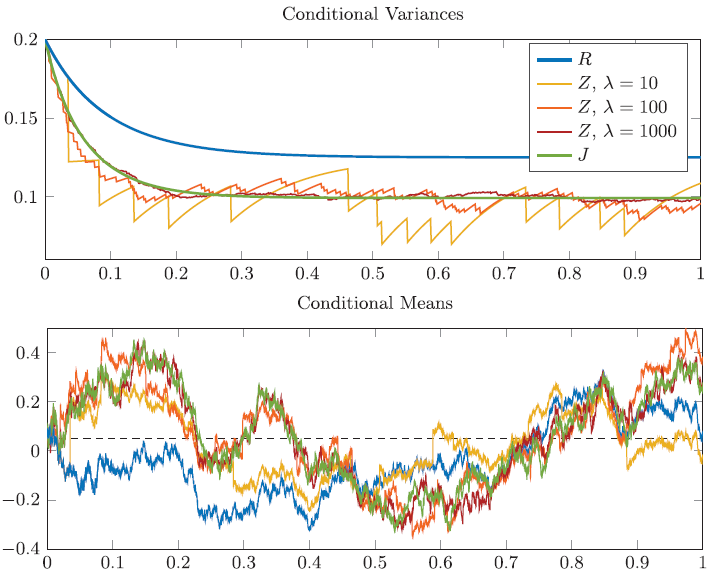
From the upper plot we note that, for t going to infinity,  ${Q^{R}_{t}}$ and
 ${Q^{J}_{t}}$ approach a finite value. Convergence is proven in [Reference Sass, Westphal and Wunderlich22, Theorem 4.1]. We also see that, for any fixed
 $t\in[0, T]$, both
 ${Q^{J}_{t}}$ and
 ${Q^{Z,\lambda}_{t}}$ for any
 $\lambda$ are less than or equal to
 ${Q^{R}_{t}}$, see Lemma 2.4. For the Z-investors we see that the updates at information dates lead to a decrease in the conditional variance. By increasing
 $\lambda$, one can increase the frequency of information dates, causing convergence of
 ${Q^{Z,\lambda}_{t}}$ to
 ${Q^{J}_{t}}$ for any
 $t\in[0, T]$, as shown in Theorem 3.1. In the lower subplot we see the corresponding realizations of
 ${m^{Z,\lambda}_{}}$, in addition to
 ${m^{R}_{}}$ and
 ${m^{J}_{}}$. The updates in the conditional mean of the Z-investor are visible. We observe that when increasing
 $\lambda$, the distance between the paths of
 ${m^{J}_{}}$ and
 ${m^{Z,\lambda}_{}}$ becomes smaller, as shown in Theorem 3.2. It is also striking that, for the Z-investor with intensity
 $\lambda=10$, there are sometimes rather big distances between two subsequent information dates. During those times, the conditional mean
 ${m^{Z,\lambda}_{}}$ comes closer to
 ${m^{R}_{}}$. When the intensity
 $\lambda$ is increased, however,
 ${m^{Z,\lambda}_{}}$ approaches
 ${m^{J}_{}}$.
In the following we illustrate the convergence results in the portfolio optimization problem from Section 4. Recall that the value function  $V^{Z,\lambda}$ of the Z-investor converges to
 $V^J$ when
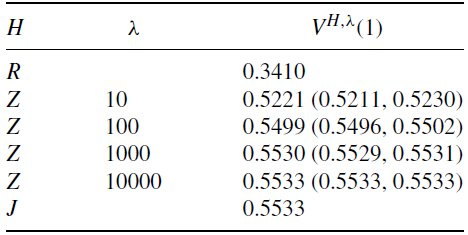
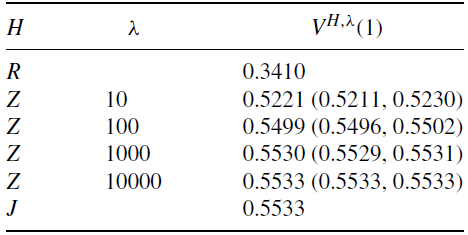
 $\lambda$ goes to infinity. In Table 2 we list the values of the value function of the R-investor and of the J-investor, as well as an estimate for the value function of the Z-investor for different arrival frequencies
 $\lambda$. We assume that investors have initial capital
 $x_0=1$ and that the model parameters are those from Table 1.
Value function for different investors, and in brackets the 95% confidence intervals for the Z-investor.
Calculating the value function of the Z-investor in the present case with random information dates is more involved than for deterministic dates as in [Reference Gabih, Kondakji, Sass and Wunderlich10, Reference Sass, Westphal and Wunderlich22] because in our case the conditional covariances  $({Q^{Z,\lambda}_{t}})_{t\in[0, T]}$ are also non-deterministic. The value function depends on the expectation of
 ${Q^{Z,\lambda}_{t}}$ for
 $t\in[0, T]$. This value cannot be calculated easily. To determine the value function numerically we perform, for each value of
 $\lambda$, a Monte Carlo simulation with
 $10\,000$ iterations. In each iteration we generate a sequence of information dates as jump times of a Poisson process with intensity
 $\lambda$ and calculate the corresponding conditional variances
 $({Q^{Z,\lambda}_{t}})_{t\in[0, T]}$. By taking an average of all simulations this leads to a good approximation of
 $V^{Z,\lambda}(1)$. The diffusion approximation
 $V^J(1)$ is available in closed form, its computation does not require numerical methods. Table 2 shows the resulting estimations for
 $V^{Z,\lambda}(1)$ and in brackets the corresponding 95% confidence intervals. The values
 $V^{Z,\lambda}(1)$ lie between
 $V^R(1)$ and
 $V^J(1)$, are increasing in the intensity
 $\lambda$, and for large values of
 $\lambda$ they approach the value
 $V^J(1)$. This is in line with the convergence stated in Section 4.
Appendix A. Proofs of main results
A.1. Proof of Theorem 3.1: Convergence of covariance matrices
We first consider  $p=2$. Using the representations from Proposition 3.1 we see that
 \begin{equation*} \begin{aligned} &{Q^{Z,\lambda}_{t}}-{Q^{J}_{t}} = \int_0^t\int_{\mathbb{R}^d}-{Q^{Z,\lambda}_{s-}}({Q^{Z,\lambda}_{s-}}+\lambda\sigma_J\sigma_J^\top)^{-1}{Q^{Z,\lambda}_{s-}}\,\tilde{N}(\textrm{d} s,\textrm{d} u)\\ &\quad+ \int_0^t \Bigl(L({Q^{Z,\lambda}_{s}})-L({Q^{J}_{s}}) -\lambda{Q^{Z,\lambda}_{s-}}({Q^{Z,\lambda}_{s-}}+\lambda\sigma_J\sigma_J^\top)^{-1}{Q^{Z,\lambda}_{s-}}+{Q^{J}_{s}}(\sigma_J\sigma_J^\top)^{-1}{Q^{J}_{s}}\Bigr)\textrm{d} s. \end{aligned}\end{equation*}
Denote the integral with respect to the compensated measure  $\tilde{N}$ by
 $X^{\lambda}_t$, and the second one by
 $A^{\lambda}_t$. Now, for
 $r\in[0, T]$ we have
 \begin{equation} \begin{aligned} u^{\lambda}_r\,:\!=\,\mathbb{E}\biggl[\sup_{t\leq r}\, \lVert{Q^{Z,\lambda}_{t}}-{Q^{J}_{t}}\rVert^2\biggr] \leq 2\mathbb{E}\biggl[\sup_{t\leq r}\,\lVert X^{\lambda}_t\rVert^2\biggr]+2\mathbb{E}\biggl[\sup_{t\leq r}\,\lVert A^{\lambda}_t\rVert^2\biggr]. \end{aligned}\end{equation}
Estimate for the martingale term  ${\textit{\textbf{X}}}^{\boldsymbol{\lambda}}$. Every component of the matrix-valued process
 $(X^{\lambda}_t)_{t\geq 0}$ is a martingale since we integrate a bounded integrand with respect to the compensated measure
 $\tilde{N}$. In the following, for finding an upper bound for the term involving
 $X^\lambda_t$ in (A.1) we first use Doob’s inequality for martingales to get rid of the supremum. In the second step we can calculate the second moment of the integral because we know the corresponding intensity measure of the Poisson random measure. In detail, we proceed as follows. By equivalence of norms there is a constant
 $C_\textrm{norm}>0$ such that
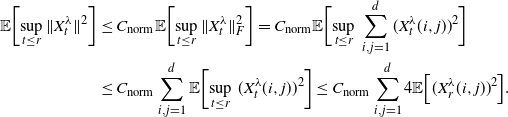 \begin{equation} \begin{aligned} \mathbb{E}\biggl[\sup_{t\leq r} \,\lVert X^{\lambda}_t\rVert^2\biggr] &\leq C_\textrm{norm}\mathbb{E}\biggl[\sup_{t\leq r}\,\lVert X^{\lambda}_t\rVert_F^2\biggr] = C_\textrm{norm}\mathbb{E}\biggl[\sup_{t\leq r}\,\sum_{i,j=1}^d (X^{\lambda}_t(i,j))^2\biggr] \\ &\leq C_\textrm{norm}\sum_{i,j=1}^d\mathbb{E}\biggl[\sup_{t\leq r}\, (X^{\lambda}_t(i,j))^2\biggr] \leq C_\textrm{norm}\sum_{i,j=1}^d 4\mathbb{E}\Bigl[(X^{\lambda}_r(i,j))^2\Bigr]. \end{aligned}\end{equation}
The last inequality follows from Doob’s inequality for martingales. Next, we apply [Reference Cont and Tankov5, Proposition 2.16] to calculate the second moments, and in the next step use that the integrand does not depend on u, and that  $\varphi$ is a density, to get
 \begin{equation*} \begin{aligned} \mathbb{E}\Bigl[(X^{\lambda}_r(i,j))^2\Bigr] &= \mathbb{E}\biggl[\int_0^r\int_{\mathbb{R}^d} \Bigl(\bigl(-{Q^{Z,\lambda}_{s-}}({Q^{Z,\lambda}_{s-}}+\lambda\sigma_J\sigma_J^\top)^{-1}{Q^{Z,\lambda}_{s-}}\bigr)(i,j)\Bigr)^2 \lambda\varphi(u)\,\textrm{d} u\,\textrm{d} s\biggr] \\ &= \lambda\mathbb{E}\biggl[\int_0^r \Bigl(\bigl(-{Q^{Z,\lambda}_{s-}}({Q^{Z,\lambda}_{s-}}+\lambda\sigma_J\sigma_J^\top)^{-1}{Q^{Z,\lambda}_{s-}}\bigr)(i,j)\Bigr)^2 \textrm{d} s\biggr]. \end{aligned}\end{equation*}
Plugging this back into (A.2), we get, again by equivalence of norms,
 \begin{equation} \begin{aligned} \mathbb{E}\biggl[\sup_{t\leq r}\,\lVert X^{\lambda}_t\rVert^2\biggr] \leq 4C_\textrm{norm}^2\lambda\int_0^r \mathbb{E}\Bigl[\big\lVert{-}{Q^{Z,\lambda}_{s-}}({Q^{Z,\lambda}_{s-}}+\lambda\sigma_J\sigma_J^\top)^{-1}{Q^{Z,\lambda}_{s-}}\big\rVert^2\Bigr] \textrm{d} s. \end{aligned}\end{equation}
Since the norm of the matrices  ${Q^{Z,\lambda}_{}}$ is bounded by
 $C_{{Q^{}_{}}}$, see Lemma 2.4, we obtain
 \begin{equation*} \begin{aligned} &\mathbb{E}\Bigl[\big\lVert-{Q^{Z,\lambda}_{s-}}({Q^{Z,\lambda}_{s-}}+\lambda\sigma_J\sigma_J^\top)^{-1}{Q^{Z,\lambda}_{s-}}\big\rVert^2\Bigr] \leq C_{{Q^{}_{}}}^4\mathbb{E}\Bigl[\big\lVert({Q^{Z,\lambda}_{s-}}+\lambda\sigma_J\sigma_J^\top)^{-1}\big\rVert^2\Bigr] \\
&\quad =C_{{Q^{}_{}}}^4 \mathbb{E}\Bigl[\bigl(\lambda_{\min}({Q^{Z,\lambda}_{s-}}+\lambda\sigma_J\sigma_J^\top)\bigr)^{-2}\Bigr] \leq C_{{Q^{}_{}}}^4\mathbb{E}\Bigl[\bigl(\lambda_{\min}(\lambda\sigma_J\sigma_J^\top)\bigr)^{-2}\Bigr] = \frac{C_{{Q^{}_{}}}^4}{\lambda^2}\big\lVert(\sigma_J\sigma_J^\top)^{-1}\big\rVert^2. \end{aligned}\end{equation*}
Reinserting this upper bound into (A.3), we can conclude that
 \begin{equation*} \begin{aligned} \mathbb{E}\biggl[\sup_{t\leq r}\,\lVert X^{\lambda}_t\rVert^2\biggr]&\leq \frac{1}{\lambda}4 C_\textrm{norm}^2C_{{Q^{}_{}}}^4\big\lVert(\sigma_J\sigma_J^\top)^{-1}\big\rVert^2r \leq \frac{1}{\lambda}4 C_\textrm{norm}^2C_{{Q^{}_{}}}^4\big\lVert(\sigma_J\sigma_J^\top)^{-1}\big\rVert^2T. \end{aligned}\end{equation*}
Estimate for the finite variation term  ${\textbf{\textit{A}}}^{\boldsymbol{\lambda}}$. Using the short-hand notation g for the integrand of
 $A^{\lambda}_t$, we get
 \begin{equation} \sup_{t\leq r}\,\lVert A^{\lambda}_t\rVert^2 = \sup_{t\leq r}\,\biggl\lVert\int_0^t g(s)\,\textrm{d} s\biggr\rVert^2 \leq \sup_{t\leq r}\, t \int_0^t \lVert g(s)\rVert^2\,\textrm{d} s \leq r\int_0^r \lVert g(s)\rVert^2\,\textrm{d} s\end{equation}
by the Cauchy–Schwarz inequality. Next, we take the expectation of (A.4). Note that since  $\lVert g(s)\rVert^2$ is non-negative, we can pull the expectation inside the integral by Tonelli’s theorem. Since
 \begin{equation*} \begin{aligned} \lVert g(s)\rVert &\leq 2\big\lVert{Q^{Z,\lambda}_{s}}-{Q^{J}_{s}}\big\rVert\bigl(\lVert\alpha\rVert+C_{{Q^{}_{}}}\big\lVert(\sigma_R\sigma_R^\top)^{-1}\big\rVert\bigr) \\ &\quad +\big\lVert\lambda{Q^{Z,\lambda}_{s-}}({Q^{Z,\lambda}_{s-}}+\lambda\sigma_J\sigma_J^\top)^{-1}{Q^{Z,\lambda}_{s-}}-{Q^{J}_{s}}(\sigma_J\sigma_J^\top)^{-1}{Q^{J}_{s}}\big\rVert , \end{aligned}\end{equation*}
we then obtain
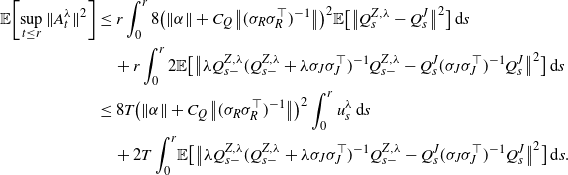 \begin{equation*} \begin{aligned} \mathbb{E}\biggl[\sup_{t\leq r}\,\lVert A^{\lambda}_t\rVert^2\biggr]&\leq r\int_0^r 8\bigl(\lVert\alpha\rVert+C_{{Q^{}_{}}}\big\lVert(\sigma_R\sigma_R^\top)^{-1}\big\rVert\bigr)^2\mathbb{E}\bigl[\big\lVert{Q^{Z,\lambda}_{s}}-{Q^{J}_{s}}\big\rVert^2\bigr]\,\textrm{d} s \\ &\quad + r\int_0^r 2\mathbb{E}\bigl[\big\lVert\lambda{Q^{Z,\lambda}_{s-}}({Q^{Z,\lambda}_{s-}}+\lambda\sigma_J\sigma_J^\top)^{-1}{Q^{Z,\lambda}_{s-}}-{Q^{J}_{s}}(\sigma_J\sigma_J^\top)^{-1}{Q^{J}_{s}}\big\rVert^2\bigr]\,\textrm{d} s \\ &\leq 8T\bigl(\lVert\alpha\rVert+C_{{Q^{}_{}}}\big\lVert(\sigma_R\sigma_R^\top)^{-1}\big\rVert\bigr)^2\int_0^r u^{\lambda}_s\,\textrm{d} s \\ &\quad + 2T\int_0^r\! \mathbb{E}\bigl[\big\lVert\lambda{Q^{Z,\lambda}_{s-}}({Q^{Z,\lambda}_{s-}}+\lambda\sigma_J\sigma_J^\top)^{-1}{Q^{Z,\lambda}_{s-}}-{Q^{J}_{s}}(\sigma_J\sigma_J^\top)^{-1}{Q^{J}_{s}}\big\rVert^2\bigr]\,\textrm{d} s. \end{aligned}\end{equation*}
We analyze the second summand in more detail. For that purpose, we decompose
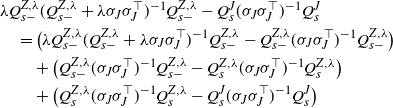 \begin{equation} \begin{aligned} &\lambda{Q^{Z,\lambda}_{s-}}({Q^{Z,\lambda}_{s-}}+\lambda\sigma_J\sigma_J^\top)^{-1}{Q^{Z,\lambda}_{s-}}-{Q^{J}_{s}}(\sigma_J\sigma_J^\top)^{-1}{Q^{J}_{s}} \\
&\quad= \bigl(\lambda{Q^{Z,\lambda}_{s-}}({Q^{Z,\lambda}_{s-}}+\lambda\sigma_J\sigma_J^\top)^{-1}{Q^{Z,\lambda}_{s-}}-{Q^{Z,\lambda}_{s-}}(\sigma_J\sigma_J^\top)^{-1}{Q^{Z,\lambda}_{s-}}\bigr)\\
&\qquad+ \bigl({Q^{Z,\lambda}_{s-}}(\sigma_J\sigma_J^\top)^{-1}{Q^{Z,\lambda}_{s-}}-{Q^{Z,\lambda}_{s}}(\sigma_J\sigma_J^\top)^{-1}{Q^{Z,\lambda}_{s}}\bigr)\\
&\qquad+ \bigl({Q^{Z,\lambda}_{s}}(\sigma_J\sigma_J^\top)^{-1}{Q^{Z,\lambda}_{s}}-{Q^{J}_{s}}(\sigma_J\sigma_J^\top)^{-1}{Q^{J}_{s}}\bigr) \end{aligned}\end{equation}
and find upper bounds for each of the three summands in (A.5) individually. For the first summand we find
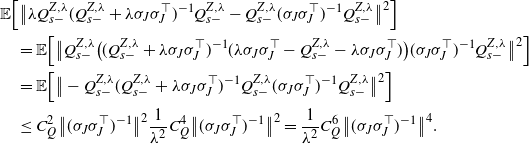 \begin{equation*} \begin{aligned} &\mathbb{E}\Bigl[\big\lVert\lambda{Q^{Z,\lambda}_{s-}}({Q^{Z,\lambda}_{s-}}+\lambda\sigma_J\sigma_J^\top)^{-1}{Q^{Z,\lambda}_{s-}}-{Q^{Z,\lambda}_{s-}}(\sigma_J\sigma_J^\top)^{-1}{Q^{Z,\lambda}_{s-}}\big\rVert^2\Bigr] \\
&\quad=\mathbb{E}\Bigl[\big\lVert {Q^{Z,\lambda}_{s-}}\bigl(({Q^{Z,\lambda}_{s-}}+\lambda\sigma_J\sigma_J^\top)^{-1}(\lambda\sigma_J\sigma_J^\top-{Q^{Z,\lambda}_{s-}}-\lambda\sigma_J\sigma_J^\top)\bigr)(\sigma_J\sigma_J^\top)^{-1}{Q^{Z,\lambda}_{s-}} \big\rVert^2\Bigr] \\
& \quad =\mathbb{E}\Bigl[\big\lVert -{Q^{Z,\lambda}_{s-}}({Q^{Z,\lambda}_{s-}}+\lambda\sigma_J\sigma_J^\top)^{-1}{Q^{Z,\lambda}_{s-}}(\sigma_J\sigma_J^\top)^{-1}{Q^{Z,\lambda}_{s-}} \big\rVert^2\Bigr] \\
&\quad\leq C_{{Q^{}_{}}}^2\big\lVert(\sigma_J\sigma_J^\top)^{-1}\big\rVert^2\frac{1}{\lambda^2}C_{{Q^{}_{}}}^4\big\lVert(\sigma_J\sigma_J^\top)^{-1}\big\rVert^2 = \frac{1}{\lambda^2}C_{{Q^{}_{}}}^6\big\lVert(\sigma_J\sigma_J^\top)^{-1}\big\rVert^4. \end{aligned}\end{equation*}
For the second summand note that  $\mathbb{E}\bigl[\big\lVert{Q^{Z,\lambda}_{s-}}(\sigma_J\sigma_J^\top)^{-1}{Q^{Z,\lambda}_{s-}}-{Q^{Z,\lambda}_{s}}(\sigma_J\sigma_J^\top)^{-1}{Q^{Z,\lambda}_{s}}\big\rVert^2\bigr]$ is equal to zero for any fixed
 $s\in[0,r]$ since a jump at time s occurs with probability zero. For the third summand we observe that
 \begin{equation*} \begin{aligned} &\mathbb{E}\bigl[\big\lVert{Q^{Z,\lambda}_{s}}(\sigma_J\sigma_J^\top)^{-1}{Q^{Z,\lambda}_{s}}-{Q^{J}_{s}}(\sigma_J\sigma_J^\top)^{-1}{Q^{J}_{s}}\big\rVert^2\bigr] \\
&\quad = \mathbb{E}\bigl[\big\lVert{Q^{Z,\lambda}_{s}}(\sigma_J\sigma_J^\top)^{-1}({Q^{Z,\lambda}_{s}}-{Q^{J}_{s}})+({Q^{Z,\lambda}_{s}}-{Q^{J}_{s}})(\sigma_J\sigma_J^\top)^{-1}{Q^{J}_{s}}\big\rVert^2\bigr] \\
&\quad\leq \bigl(2C_{{Q^{}_{}}}\big\lVert(\sigma_J\sigma_J^\top)^{-1}\big\rVert\bigr)^2\mathbb{E}\bigl[\big\lVert{Q^{Z,\lambda}_{s}}-{Q^{J}_{s}}\big\rVert^2\bigr] \leq 4C_{{Q^{}_{}}}^2\big\lVert(\sigma_J\sigma_J^\top)^{-1}\big\rVert^2 u^{\lambda}_s. \end{aligned}\end{equation*}
We now use these upper bounds in (A.5) and obtain
 \begin{equation*} \begin{aligned} &\mathbb{E}\bigl[\big\lVert\lambda{Q^{Z,\lambda}_{s-}}({Q^{Z,\lambda}_{s-}}+\lambda\sigma_J\sigma_J^\top)^{-1}{Q^{Z,\lambda}_{s-}}-{Q^{J}_{s}}(\sigma_J\sigma_J^\top)^{-1}{Q^{J}_{s}}\big\rVert^2\bigr] \\
&\quad\leq \frac{3}{\lambda^2}C_{{Q^{}_{}}}^6\big\lVert(\sigma_J\sigma_J^\top)^{-1}\big\rVert^4+12C_{{Q^{}_{}}}^2\big\lVert(\sigma_J\sigma_J^\top)^{-1}\big\rVert^2 u^{\lambda}_s. \end{aligned}\end{equation*}
Hence, we can write
 \begin{equation*} \begin{aligned} \mathbb{E}\biggl[\sup_{t\leq r}\,\lVert A^{\lambda}_t\rVert^2\biggr] &\leq 8T\Bigl(\bigl(\lVert\alpha\rVert+C_{{Q^{}_{}}}\big\lVert(\sigma_R\sigma_R^\top)^{-1}\big\rVert\bigr)^2+3C_{{Q^{}_{}}}^2\big\lVert(\sigma_J\sigma_J^\top)^{-1}\big\rVert^2\Bigr)\int_0^r u^{\lambda}_s\,\textrm{d} s \\ &\quad+ 6T^2C_{{Q^{}_{}}}^6\big\lVert(\sigma_J\sigma_J^\top)^{-1}\big\rVert^4\frac{1}{\lambda^2}. \end{aligned}\end{equation*}
Conclusion with Gronwall’s lemma. We have found upper bounds for both summands from (A.1). Plugging these in yields constants  $C_1$,
 $C_2>0$ such that
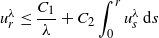 \begin{equation*} \begin{aligned} u^{\lambda}_r &\leq \frac{C_1}{\lambda}+C_2\int_0^r u^{\lambda}_s\,\textrm{d} s \end{aligned}\end{equation*}
for all  $\lambda\geq 1$. By Gronwall’s lemma in integral form, see e.g. [Reference Pachpatte19, Section 1.3], it follows that
 \begin{equation*} \mathbb{E}\biggl[\sup_{t\leq T}\, \lVert{Q^{Z,\lambda}_{t}}-{Q^{J}_{t}}\rVert^2\biggr] =u^{\lambda}_T\leq\frac{C_1}{\lambda}\textrm{e}^{C_2 T}=\frac{K_{Q,2}}{\lambda}\end{equation*}
for  $K_{Q,2}=C_1\textrm{e}^{C_2T}$, which proves the claim for
 $p=2$. For
 $p<2$ we use Lyapunov’s inequality to get
 \[ \mathbb{E}\Bigl[\bigl\lVert{Q^{Z,\lambda}_{t}}-{Q^{J}_{t}}\bigr\rVert^p\Bigr] \leq \mathbb{E}\Bigl[\bigl\lVert{Q^{Z,\lambda}_{t}}-{Q^{J}_{t}}\bigr\rVert^2\Bigr]^\frac{p}{2} \leq \Bigl(\frac{K_{Q,2}}{\lambda}\Bigr)^\frac{p}{2}=\frac{K_{Q,p}}{\lambda^{p/2}}. \]
For  $p>2$ we have
 \begin{equation*} \begin{aligned} \mathbb{E}\Bigl[\bigl\lVert{Q^{Z,\lambda}_{t}}-{Q^{J}_{t}}\bigr\rVert^p\Bigr] \leq (2C_Q)^{p-2}\mathbb{E}\Bigl[\bigl\lVert{Q^{Z,\lambda}_{t}}-{Q^{J}_{t}}\bigr\rVert^2\Bigr] \leq (2C_Q)^{p-2}\frac{K_{Q,2}}{\lambda}=\frac{K_{Q,p}}{\lambda} \end{aligned}\end{equation*}
due to boundedness of the conditional covariance matrices, see Lemma 2.4.
A.2. Proof of Theorem 3.2: Convergence of conditional means
We first prove the claim for  $p\geq 2$. The proof again uses Gronwall’s lemma. We define
 $v^\lambda_t \,:\!=\, \mathbb{E}[\lVert {m^{Z,\lambda}_{t}}-{m^{J}_{t}}\rVert^p]$ for
 $t\in[0, T]$. The filtering equations from Lemma 2.3 yield
 \begin{equation*} {m^{Z,\lambda}_{t}} = \int_0^t \alpha(\delta-{m^{Z,\lambda}_{s}})\,\textrm{d} s + \int_0^t{Q^{Z,\lambda}_{s}}(\sigma_R\sigma_R^\top)^{-1}\sigma_R\,\textrm{d} V^Z_s + \sum_{k=1}^{N_t} \frac{1}{\lambda}P^\lambda_k\bigl(Z^{(\lambda)}_k-{m^{Z,\lambda}_{T_k-}}\bigr),\end{equation*}
where  $\textrm{d} R_s-{m^{Z,\lambda}_{s}}\,\textrm{d} s=\sigma_R\,\textrm{d} V^Z_s$ defines the innovations process
 $V^Z$, an m-dimensional
 $\mathcal{F}^{Z,\lambda}$-Brownian motion, and where
 \[ P^\lambda_k=\lambda\bigl(I_d-\rho^{(\lambda)}({Q^{Z,\lambda}_{T_k-}})\bigr) = \lambda{Q^{Z,\lambda}_{T_k-}}({Q^{Z,\lambda}_{T_k-}}+\lambda\sigma_J\sigma_J^\top)^{-1}. \]
We can easily check that there exists a constant  $C_P>0$ with
 $\lVert P^\lambda_k\rVert\leq C_P$ for all
 $\lambda>0$ and
 $k\geq 1$. The conditional mean
 ${m^{J}_{}}$ can be written as
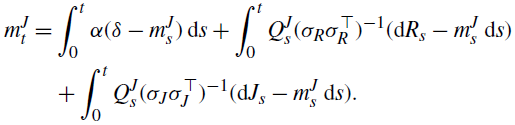 \begin{equation*} \begin{aligned} {m^{J}_{t}} &= \int_0^t \alpha(\delta-{m^{J}_{s}})\,\textrm{d} s + \int_0^t{Q^{J}_{s}}(\sigma_R\sigma_R^\top)^{-1}(\textrm{d} R_s-{m^{J}_{s}}\,\textrm{d} s) \\ &\quad+\int_0^t {Q^{J}_{s}}(\sigma_J\sigma_J^\top)^{-1}(\textrm{d} J_s-{m^{J}_{s}}\,\textrm{d} s). \end{aligned}\end{equation*}
This yields the representation  ${m^{Z,\lambda}_{t}}-{m^{J}_{t}} = A^\lambda_t+B^\lambda_t+C^\lambda_t+D^\lambda_t+E^\lambda_t$, where
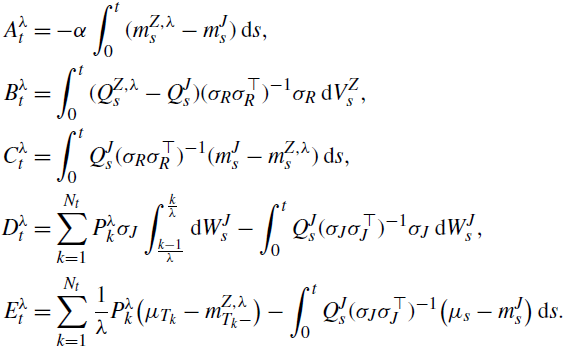 \begin{align*} A^\lambda_t &= -\alpha\int_0^t ({m^{Z,\lambda}_{s}}-{m^{J}_{s}})\,\textrm{d} s,\\
B^\lambda_t &= \int_0^t ({Q^{Z,\lambda}_{s}}-{Q^{J}_{s}})(\sigma_R\sigma_R^\top)^{-1}\sigma_R\,\textrm{d} V^Z_s,\\
C^\lambda_t &= \int_0^t {Q^{J}_{s}}(\sigma_R\sigma_R^\top)^{-1}({m^{J}_{s}}-{m^{Z,\lambda}_{s}})\,\textrm{d} s,\\
D^\lambda_t &= \sum_{k=1}^{N_t} P^\lambda_k\sigma_J\int_{\frac{k-1}{\lambda}}^{\frac{k}{\lambda}}\textrm{d} W^J_s - \int_0^t {Q^{J}_{s}}(\sigma_J\sigma_J^\top)^{-1}\sigma_J\,\textrm{d} W^J_s,\\
E^\lambda_t &= \sum_{k=1}^{N_t} \frac{1}{\lambda}P^\lambda_k\bigl(\mu_{T_k}-{m^{Z,\lambda}_{T_k-}}\bigr) - \int_0^t {Q^{J}_{s}}(\sigma_J\sigma_J^\top)^{-1}\bigl(\mu_s-{m^{J}_{s}}\bigr)\,\textrm{d} s.\end{align*}
Hence, we have  $v^\lambda_t \leq 5^{p-1}\mathbb{E}\big[\lVert A^\lambda_t\rVert^p+\lVert B^\lambda_t\rVert^p+\lVert C^\lambda_t\rVert^p+\lVert D^\lambda_t\rVert^p+\lVert E^\lambda_t\rVert^p\big]$, and it suffices to find upper bounds for the single summands on the right-hand side.
Estimation of stochastic integrals. As a preliminary step, we deduce upper bounds for the pth moments of certain stochastic integrals with respect to  $W\in\{V^Z,W^J\}$. Let
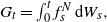 $ G_t=\int_0^t f^N_s\,\textrm{d} W_s, $ where
 $f^N$ is a matrix-valued integrand measurable with respect to
 $\mathcal{F}^N_t\,:\!=\,\sigma(N_u, u\leq t)$. Then,
 $G_t$ conditional on
 $\mathcal{F}^N_t$ is Gaussian with
 $\mathbb{E}[G_t\,|\,\mathcal{F}^N_t]=0$. By [Reference Rosiński and Suchanecki20, Lemma 2.1] there is a constant
 $C_p>0$ such that
 \[ \mathbb{E}\bigl[\lVert G_t\rVert^p\,|\,\mathcal{F}^N_t\bigr] \leq C_p \mathbb{E}\bigl[\lVert G_t\rVert^2\,|\,\mathcal{F}^N_t\bigr]^\frac{p}{2}. \]
A multivariate version of Itô’s isometry, see also [Reference Westphal24, Lemma A.3], yields
 \[ \mathbb{E}\bigl[\lVert G_t\rVert^2\,|\,\mathcal{F}^N_t\bigr] \leq C_\textrm{norm} \mathbb{E}\biggl[\int_0^t \lVert f^N_s\rVert^2\,\textrm{d} s \,\Big|\, \mathcal{F}^N_t\biggr] = C_\textrm{norm}\int_0^t \lVert f^N_s\rVert^2\,\textrm{d} s. \]
By putting these inequalities together we get
 \begin{equation} \begin{aligned} \mathbb{E}\bigl[\lVert G_t\rVert^p\bigr] &= \mathbb{E}\Bigl[\mathbb{E}\bigl[\lVert G_t\rVert^p\,\big|\,\mathcal{F}^N_t\bigr]\Bigr] \leq C_pC_\textrm{norm}^{p/2}\mathbb{E}\biggl[\biggl(\int_0^t \lVert f^N_s\rVert^2\,\textrm{d} s\biggr)^{p/2}\biggr] \\
&\leq C_pC_\textrm{norm}^{p/2}\mathbb{E}\biggl[t^{\frac{p-2}{2}}\int_0^t \lVert f^N_s\rVert^p\,\textrm{d} s\biggr]\,=\!:\, \overline{C}_p\mathbb{E}\biggl[t^{\frac{p-2}{2}}\int_0^t \lVert f^N_s\rVert^p\,\textrm{d} s\biggr]. \end{aligned}\end{equation}
Estimate for  ${\textbf{\textit{A}}}^{\boldsymbol{\lambda}}$. By using Hölder’s inequality we have
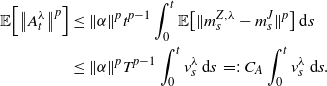 \begin{equation} \begin{aligned} \mathbb{E}\Bigl[\bigl\lVert A^\lambda_t\bigr\rVert^p\Bigr] &\leq \lVert\alpha\rVert^p t^{p-1} \int_0^t \mathbb{E}\bigl[\lVert{m^{Z,\lambda}_{s}}-{m^{J}_{s}}\rVert^p\bigr]\,\textrm{d} s \\ &\leq \lVert\alpha\rVert^p T^{p-1} \int_0^t v^\lambda_s\,\textrm{d} s \,=\!:\, C_A\int_0^t v^\lambda_s\,\textrm{d} s. \end{aligned}\end{equation}
Estimate for  $\textbf{\textit{B}}^{\boldsymbol{\lambda}}$. For the summand
 $B^\lambda_t$ we use (A.6) as well as Theorem 3.1 to get
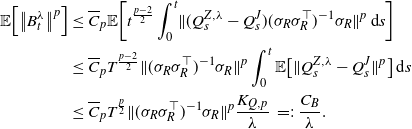 \begin{equation} \begin{aligned} \mathbb{E}\Bigl[\bigl\lVert B^\lambda_t\bigr\rVert^p\Bigr] &\leq \overline{C}_p \mathbb{E}\biggl[t^{\frac{p-2}{2}}\int_0^t \lVert ({Q^{Z,\lambda}_{s}}-{Q^{J}_{s}})(\sigma_R\sigma_R^\top)^{-1}\sigma_R\rVert^p\,\textrm{d} s\biggr] \\ &\leq \overline{C}_p T^{\frac{p-2}{2}}\lVert(\sigma_R\sigma_R^\top)^{-1}\sigma_R\rVert^p\int_0^t \mathbb{E}\bigl[\lVert {Q^{Z,\lambda}_{s}}-{Q^{J}_{s}} \rVert^p\bigr]\,\textrm{d} s \\ &\leq \overline{C}_p T^{\frac{p}{2}}\lVert(\sigma_R\sigma_R^\top)^{-1}\sigma_R\rVert^p \frac{K_{Q,p}}{\lambda} \,=\!:\, \frac{C_B}{\lambda}. \end{aligned}\end{equation}
Estimate for  $\textbf{\textit{C}}^{\boldsymbol{\lambda}}$. For the summand
 $C^\lambda_t$ we can argue as for
 $A^\lambda_t$ and get
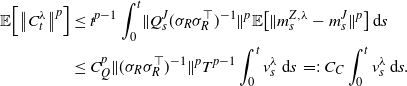 \begin{equation} \begin{aligned} \mathbb{E}\Bigl[\bigl\lVert C^\lambda_t\bigr\rVert^p\Bigr] &\leq t^{p-1} \int_0^t \lVert{Q^{J}_{s}}(\sigma_R\sigma_R^\top)^{-1}\rVert^p \mathbb{E}\bigl[\lVert{m^{Z,\lambda}_{s}}-{m^{J}_{s}}\rVert^p\bigr]\,\textrm{d} s \\ &\leq C_{{Q^{}_{}}}^p\lVert(\sigma_R\sigma_R^\top)^{-1}\rVert^p T^{p-1} \int_0^t v^\lambda_s\,\textrm{d} s \,=\!:\, C_C\int_0^t v^\lambda_s\,\textrm{d} s. \end{aligned}\end{equation}
Estimate for  ${\textbf{\textit{D}}}^{\boldsymbol{\lambda}}$. The estimation of
 $D^\lambda_t$ is more involved. We can write
 \begin{equation*} \begin{aligned} D^\lambda_t &= \int_0^{\frac{N_t}{\lambda}} H^\lambda_s\sigma_J\,\textrm{d} W^J_s - \int_0^t {Q^{J}_{s}}(\sigma_J\sigma_J^\top)^{-1}\sigma_J\,\textrm{d} W^J_s, \end{aligned}\end{equation*}
where  $H^\lambda_s=P^\lambda_k$ for
 $s\in\big[\frac{k-1}{\lambda},\frac{k}{\lambda}\big)$. Note that the two stochastic integrals do not align. We distinguish different cases by means of the random variable
 $n_t\,:\!=\,\min\{N_t,\lambda t\}$. This leads to the representation of
 $D^\lambda_t$ as
 $D^{1,\lambda}_t+D^{2,\lambda}_t+D^{3,\lambda}_t$, where
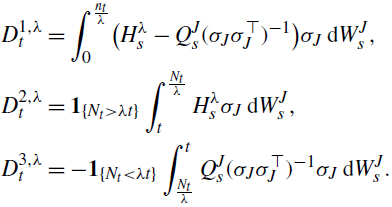 \begin{align*} D^{1,\lambda}_t &= \int_0^{\frac{n_t}{\lambda}} \bigl(H^\lambda_s-{Q^{J}_{s}}(\sigma_J\sigma_J^\top)^{-1}\bigr)\sigma_J\,\textrm{d} W^J_s,\\
D^{2,\lambda}_t &= \textbf{1}_{\{ N_t>\lambda t \}}\int_{t}^{\frac{N_t}{\lambda}}H^\lambda_s\sigma_J\,\textrm{d} W^J_s,\\
D^{3,\lambda}_t &= -\textbf{1}_{\{ N_t<\lambda t \}}\int_{\frac{N_t}{\lambda}}^t {Q^{J}_{s}}(\sigma_J\sigma_J^\top)^{-1}\sigma_J\,\textrm{d} W^J_s.\end{align*}
For the first term, due to (A.6) we have
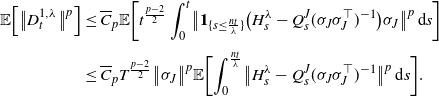 \begin{align} \mathbb{E}\Bigl[\bigl\lVert D^{1,\lambda}_t\bigr\rVert^p\Bigr] &\leq \overline{C}_p \mathbb{E}\biggl[ t^{\frac{p-2}{2}}\int_0^t \bigl\lVert\textbf{1}_{\{s\leq\frac{n_t}{\lambda}\}}\bigl(H^\lambda_s-{Q^{J}_{s}}(\sigma_J\sigma_J^\top)^{-1}\bigr)\sigma_J\bigr\rVert^p\,\textrm{d} s\biggr] \nonumber\\[3pt] &\leq \overline{C}_p T^{\frac{p-2}{2}}\bigl\lVert\sigma_J\bigr\rVert^p \mathbb{E}\biggl[ \int_0^{\frac{n_t}{\lambda}} \bigl\lVert H^\lambda_s-{Q^{J}_{s}}(\sigma_J\sigma_J^\top)^{-1}\bigr\rVert^p\,\textrm{d} s\biggr]. \end{align}
Let  $k\leq n_t$ and
 $s\in\big[\frac{k-1}{\lambda},\frac{k}{\lambda}\big)$. Then
 \begin{equation*} \begin{aligned} H^\lambda_s-{Q^{J}_{s}}(\sigma_J\sigma_J^\top)^{-1} &= \bigl( {Q^{Z,\lambda}_{T_k-}}({Q^{Z,\lambda}_{T_k-}}+\lambda\sigma_J\sigma_J^\top)^{-1}\lambda\sigma_J\sigma_J^\top-{Q^{J}_{s}} \bigr)(\sigma_J\sigma_J^\top)^{-1}. \end{aligned}\end{equation*}
Hence, we can deduce that there exists a constant  $\overline{C}>0$ with
 \begin{equation*} \begin{aligned} \bigl\lVert H^\lambda_s-{Q^{J}_{s}}&(\sigma_J\sigma_J^\top)^{-1}\bigr\rVert^p \leq \bigl\lVert(\sigma_J\sigma_J^\top)^{-1}\bigr\rVert^p \bigl\lVert {Q^{Z,\lambda}_{T_k-}}({Q^{Z,\lambda}_{T_k-}}+\lambda\sigma_J\sigma_J^\top)^{-1}\lambda\sigma_J\sigma_J^\top-{Q^{J}_{s}} \bigr\rVert^p \\ &\leq 3^{p-1}\bigl\lVert(\sigma_J\sigma_J^\top)^{-1}\bigr\rVert^p \Bigl(\lVert{Q^{J}_{s}}-{Q^{J}_{T_k}}\rVert^p+\lVert{Q^{J}_{T_k}}-{Q^{Z,\lambda}_{T_k-}}\rVert^p+\frac{\overline{C}^p}{\lambda^p}\Bigr), \end{aligned}\end{equation*}
see [Reference Westphal24, Lemma A.4]. Since  ${Q^{J}_{s}}$ is differentiable in s with bounded derivative, we deduce that
 $\lVert{Q^{J}_{s}}-{Q^{J}_{T_k}}\rVert^p\leq \widetilde{C}_{{Q^{}_{}}}^p|T_k-s|^p$. Using the moment-generating function of
 $T_k\sim\textrm{Erl}(k,\lambda)$ we can show
 $\mathbb{E}[|T_k-s|^p]\leq C_\textrm{Erl}\lambda^{-\frac{1}{2}}$ for a constant
 $C_\textrm{Erl}>0$ and all
 $\lambda\geq 1$. Using Theorem 3.1 and plugging back into (A.10), this implies that
 \begin{equation} \mathbb{E}\Bigl[\bigl\lVert D^{1,\lambda}_t\bigr\rVert^p\Bigr] \leq 3^{p-1}\overline{C}_p T^{\frac{p}{2}}\bigl\lVert\sigma_J\bigr\rVert^p\bigl\lVert(\sigma_J\sigma_J^\top)^{-1}\bigr\rVert^p \biggl( \frac{\widetilde{C}_{{Q^{}_{}}}^pC_\textrm{Erl}}{\sqrt{\lambda}} + \frac{K_{Q,p}}{\lambda}+\frac{\overline{C}^p}{\lambda^p}\biggr) \leq \frac{C_{D,1}}{\sqrt{\lambda}}\end{equation}
for all  $\lambda\geq 1$, where
 $C_{D,1}>0$ is a constant. Next, we consider
 $D^{2,\lambda}_t$, where (A.6) yields
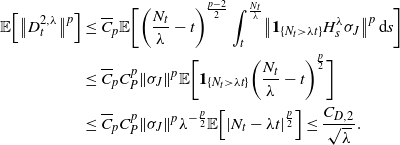 \begin{equation} \begin{aligned} \mathbb{E}\Bigl[\bigl\lVert D^{2,\lambda}_t\bigr\rVert^p\Bigr] &\leq \overline{C}_p\mathbb{E}\biggl[\biggl(\frac{N_t}{\lambda}-t\biggr)^{\frac{p-2}{2}} \int_{t}^{\frac{N_t}{\lambda}}\bigl\lVert\textbf{1}_{\{ N_t>\lambda t \}}H^\lambda_s\sigma_J\bigr\rVert^p\,\textrm{d} s\biggr] \\ &\leq \overline{C}_pC_P^p\lVert\sigma_J\rVert^p \mathbb{E}\biggl[\textbf{1}_{\{ N_t>\lambda t \}} \biggl(\frac{N_t}{\lambda}-t\biggr)^{\frac{p}{2}}\biggr] \\ &\leq \overline{C}_pC_P^p\lVert\sigma_J\rVert^p\lambda^{-\frac{p}{2}} \mathbb{E}\Bigl[|N_t-\lambda t|^{\frac{p}{2}}\Bigr] \leq \frac{C_{D,2}}{\sqrt{\lambda}}. \end{aligned}\end{equation}
For the last inequality, note that using the moment-generating function of  $N_t\sim\textrm{Poi}(\lambda t)$ it can be shown for any
 $r\geq 1$ that
 $\mathbb{E}[|N_t-\lambda t|^r]\leq C_\textrm{Poi}(\lambda t)^{r-\frac{1}{2}}$ for all
 $\lambda\geq 1$ and a constant
 $C_\textrm{Poi}>0$. For
 $D^{3,\lambda}_t$ the estimation works similarly. By using (A.6) we obtain
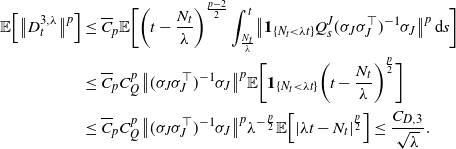 \begin{equation} \begin{aligned} \mathbb{E}\Bigl[\bigl\lVert D^{3,\lambda}_t\bigr\rVert^p\Bigr] &\leq \overline{C}_p \mathbb{E}\biggl[\biggl(t-\frac{N_t}{\lambda}\biggr)^{\frac{p-2}{2}} \int_{\frac{N_t}{\lambda}}^t \bigl\lVert\textbf{1}_{\{ N_t<\lambda t \}}{Q^{J}_{s}}(\sigma_J\sigma_J^\top)^{-1}\sigma_J\bigr\rVert^p\,\textrm{d} s \biggr] \\ &\leq \overline{C}_pC_{{Q^{}_{}}}^p\bigl\lVert(\sigma_J\sigma_J^\top)^{-1}\sigma_J\bigr\rVert^p\mathbb{E}\biggl[\textbf{1}_{\{ N_t<\lambda t \}}\biggl(t-\frac{N_t}{\lambda}\biggr)^\frac{p}{2}\biggr] \\ &\leq \overline{C}_pC_{{Q^{}_{}}}^p\bigl\lVert(\sigma_J\sigma_J^\top)^{-1}\sigma_J\bigr\rVert^p\lambda^{-\frac{p}{2}}\mathbb{E}\Bigl[|\lambda t-N_t|^\frac{p}{2}\Bigr] \leq \frac{C_{D,3}}{\sqrt{\lambda}}. \end{aligned}\end{equation}
Combining (A.11), (A.12), and (A.13), for  $C_D=3^{p-1}(C_{D,1}+C_{D,2}+C_{D,3})$ and all
 $\lambda\geq 1$ we have
 \begin{equation} \begin{aligned} \mathbb{E}\Bigl[\bigl\lVert D^\lambda_t\bigr\rVert^p\Bigr] &\leq 3^{p-1}\Bigl(\mathbb{E}\Bigl[\bigl\lVert D^{1,\lambda}_t\bigr\rVert^p\Bigr]+\mathbb{E}\Bigl[\bigl\lVert D^{2,\lambda}_t\bigr\rVert^p\Bigr]+\mathbb{E}\Bigl[\bigl\lVert D^{3,\lambda}_t\bigr\rVert^p\Bigr]\Bigr) \leq \frac{C_D}{\sqrt{\lambda}}. \end{aligned}\end{equation}
Estimate for  ${\textbf{\textit{E}}}^{\boldsymbol{\lambda}}$. By the same approach as for
 $D^\lambda_t$ we find
 $C_{E,1},C_{E,2}>0$ such that, for all
 $\lambda\geq 1$,
 \begin{equation} \mathbb{E}\Bigl[\bigl\lVert E^\lambda_t\bigr\rVert^p\Bigr] \leq C_{E,1}\int_0^t v^\lambda_s\,\textrm{d} s + \frac{C_{E,2}}{\sqrt{\lambda}}.\end{equation}
Conclusion with Gronwall’s lemma. The upper bounds in (A.7), (A.8), (A.9), (A.14), and (A.15) now imply that, for all  $\lambda\geq 1$,
 \begin{equation*} \begin{aligned} v^\lambda_t &\leq 5^{p-1}(C_A+C_C+C_{E,1})\int_0^t v^\lambda_s\,\textrm{d} s+5^{p-1}(C_B+C_D+C_{E,2})\frac{1}{\sqrt{\lambda}}. \end{aligned}\end{equation*}
Now, Gronwall’s lemma in integral form [Reference Pachpatte19, Section 1.3] implies that
 \begin{equation*} \begin{aligned} v^\lambda_t &\leq 5^{p-1}(C_B+C_D+C_{E,2})\textrm{e}^{5^{p-1}(C_A+C_C+C_{E,1})T}\frac{1}{\sqrt{\lambda}\,} \,=\!:\, \frac{K_{m,p}}{\sqrt{\lambda}}. \end{aligned}\end{equation*}
This proves the claim for  $p\geq 2$. For
 $p<2$ we obtain
 \[ \mathbb{E}\Bigl[\bigl\lVert {m^{Z,\lambda}_{t}}-{m^{J}_{t}}\bigr\rVert^p\Bigr] \leq \mathbb{E}\Bigl[\bigl\lVert{m^{Z,\lambda}_{t}}-{m^{J}_{t}}\bigr\rVert^2\Bigr]^\frac{p}{2} \leq \Bigl(\frac{K_{m,2}}{\sqrt{\lambda}}\Bigr)^\frac{p}{2}=\frac{K_{m,p}}{\lambda^{p/4}} \]
from Lyapunov’s inequality.