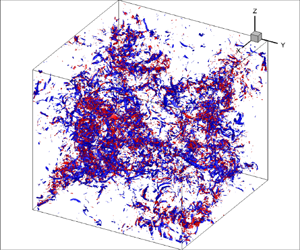

1. Introduction
Liquid helium below the critical (lambda) temperature  $T_\lambda =2.17 {\rm K}$ is a quantum fluid, also called He II. Following the two-fluid concept suggested by Tisza (Reference Tisza1938) and reformulated and enriched by Landau (Reference Landau1941), He II is represented as a mixture of two fluids with independent velocity fields: a normal viscous fluid and an inviscid superfluid. A detailed account of the historical events leading to the two-fluid model is offered by Balibar (Reference Balibar2017). A striking feature of the superfluid component is the nucleation of quantized vortices, with fixed (quantized) circulation and fixed core diameter (of atomic size). Stretching or viscous diffusion of vortices, which are essential vortex phenomena in classical fluids, are absent in the superfluid component. Complex interactions between quantized vortices lead to quantum turbulence (QT), a relatively young investigation field opened by Vinen's 1957 experiments on thermally induced counterflow in He II (see the review by Vinen & Niemela (Reference Vinen and Niemela2002)). Since then, considerable experimental and theoretical efforts (see Halperin & Tsubota Reference Halperin and Tsubota2009; Skrbek & Sreenivasan Reference Skrbek and Sreenivasan2012b; Barenghi, L'vov & Roche Reference Barenghi, L'vov and Roche2014a; Barenghi, Skrbek & Sreenivasan Reference Barenghi, Skrbek and Sreenivasan2014b) have been devoted to unravelling the properties of QT and underlining similarities to or differences from classical turbulence (CT).
Several investigation paths have been explored for the study of QT. Since it is admitted that in He II below 0.3 K the normal fluid fraction is negligible, important focus was given to characterize QT in superfluid flow. This state is also referred to as superfluid turbulence, or vortex tangle turbulence, since it is generated in an inviscid flow from the interaction of a large number of quantized vortices tangled in space. Quantized vortices being topological line defects, with infinite velocity and singular vorticity at the centreline, can be modelled by ‘vortex filament’ methods. In such methods, the vorticity is represented by Dirac distributions localized at vortex line locations, which are moved following the Biot–Savart–Laplace law for the velocity induced by neighbouring lines. Phenomenological models for vortex reconnection are applied. Since the pioneering work by Schwarz in the 1980s, numerous numerical studies of superfluid turbulence using the vortex filament method have been published (see the recent review by Tsubota, Fujimoto & Yui (Reference Tsubota, Fujimoto and Yui2017) and citations therein). Another model used for inviscid superfluid turbulence is the Gross–Pitaevskii equation, which is a nonlinear Schrödinger equation describing at macroscopic level a quantum system of weakly interacting bosons, as in Bose–Einstein condensates. Even though the Gross–Pitaevskii model offers only a partial description of the complexity of superfluid helium, it was extensively used to explore properties of superfluid turbulence in an ideal setting containing only the superfluid (Nore, Abid & Brachet Reference Nore, Abid and Brachet1997; Abid et al. Reference Abid, Huepe, Metens, Nore, Pham, Tuckerman and Brachet2003; Kobayashi et al. Reference Kobayashi, Parnaudeau, Luddens, Lothodé, Danaila, Brachet and Danaila2021).
Considering simultaneously the viscous and inviscid components of He II in a global model is a difficult problem, since characteristic scales range from angstroms (size of the quantized vortex) to metres (size of the container). The Hall–Vinen–Bekharevich–Khalatnikov (HVBK) model (Hall & Vinen Reference Hall and Vinen1956; Khalatnikov Reference Khalatnikov1965; Donnelly Reference Donnelly2009) follows the original idea of the two-fluid model. The Navier–Stokes (NS) model describes the normal fluid motion and the superfluid motion is defined by an Euler-like equation (Roberts & Donnelly Reference Roberts and Donnelly1974). The two fluids do not slip one over the other, as they are coupled through a friction force. The improvement over the original two-fluid model is that the expression of the friction force takes into account the influence of quantized vortices through a coarse-grained averaged superfluid vorticity. The average is considered over an ensemble of parallel (polarized) vortex filaments and uses Feynman's rule to find an equivalent solid-body vorticity for a dense vortex bundle of line density  $\mathcal {L}$. Derived initially for two-dimensional or rotating QT, the HVBK model has been widely used to study QT for general settings.
Recent modelling efforts were focused on more realistic estimations of the vortex line density using approaches considering  $\mathcal {L}$ as an independent variable, described by an additional evolution equation (based essentially on Vinen's equation) (Donnelly Reference Donnelly1991; Lipniacki Reference Lipniacki2006; Nemirovskii Reference Nemirovskii2013, Reference Nemirovskii2020).
In Mongiovi, Jou & Sciacca (Reference Mongiovi, Jou and Sciacca2018), the averaged vortex line density per unit volume was introduced and its evolution equations were considered, for homogeneous, inhomogeneous, isotropic and anisotropic situations. Jou, Mongiovì & Sciacca (Reference Jou, Mongiovì and Sciacca2011) studied the effects of anisotropy and polarization in the hydrodynamics of inhomogeneous vortex tangles, thus generalizing the HVBK equations. These effects contribute to the mutual friction force between normal and superfluid components and to the vortex tension force. An additional equation for the vortex line density was proposed. Applications pertained to rotating counterflows, flow behind a cylinder and other types of superfluid turbulence.
Other recent contributions (Yui, Tsubota & Kobayashi Reference Yui, Tsubota and Kobayashi2018; Galantucci et al. Reference Galantucci, Baggaley, Barenghi and Krstulovic2020) use ideas from the HVBK expression of the friction force to derive models for coupling NS equations with vortex filament dynamics for superfluid vortices. These NS-VF models, which also include phenomenological approximations, are not discussed in this contribution.
These models are still flow-dependent and a general theory of coupling NS equations with quantized vortex effects is not yet available (Nemirovskii Reference Nemirovskii2020).
The focus of this paper is the detailed investigation of turbulent dynamics of the HVBK model, considered in its original form. The HVBK model has the merit of providing a physically consistent closed set of equations for the coarse-grained (two-fluid) dynamics of He II and of yielding results in agreement with experimental studies of He II (Roche, Barenghi & Lévêque Reference Roche, Barenghi and Lévêque2009; Salort et al. Reference Salort, Baudet, Castaing, Chabaud and Daviaud2010a, Reference Salort, Chabaud, Lévêque and Roche2012; Baggaley et al. Reference Baggaley, Barenghi, Shukurov and Sergeev2012; Boué et al. Reference Boué, L'vov, Nagar, Nazarenko, Pomyalov and Procaccia2015; Biferale et al. Reference Biferale, Khomenko, L'vov, Pomyalov, Procaccia and Sahoo2018). The analysis presented here is based on direct numerical simulations (DNS) of the model and thus could be easily adapted to further evolutions of the HVBK or other equivalent QT models based on NS-type equations. We adapt statistic analysis tools originally developed for CT governed by classical NS equations. Exploring similarities between CT and QT has been a permanent guideline for studying QT (Skrbek & Sreenivasan Reference Skrbek and Sreenivasan2012a,Reference Skrbek and Sreenivasanb).
The novelty of this study is to push the analysis to higher-order moments of each component of velocity, with the aim of probing internal intermittency, i.e. assessing the fourth-order structure function, and the corresponding flatness of the velocity derivative. Previous contributions used low-order statistics (spectra, or second-order structure functions in real space) to describe exchanges between the two fluids. We derive transport equations for the third-order moments based on first principles. New equations involve the fourth-order moments, which are classical probes for internal intermittency at any scale. The general purpose of this contribution is therefore to build new bridges between CT and QT, as explained in detail below.
Previous studies have noted that QT in He II has a lot in common with CT. Experimental studies focused on the total velocity of the fluid are unable, as yet, to distinguish between the normal and the superfluid components. Several authors (Maurer & Tabeling Reference Maurer and Tabeling1998; Roche et al. Reference Roche, Diribarne, Didelot, Français, Rousseau and Willaime2007; Bradley et al. Reference Bradley, Fisher, Guénault, Haley, O'Sullivan, Pickett and Tsepelin2008; Salort et al. Reference Salort, Baudet, Castaing, Chabaud, Daviaud, Didelot, Diribarne, Dubrulle, Gagne and Gauthier2010b, Reference Salort, Chabaud, Lévêque and Roche2012) have reported that, in the inertial range, the isotropic and homogeneous QT velocity spectrum has a  $-5/3$ scaling law. The effective spectrum of superfluid vorticity (superfluid vortices averaged on a volume much larger than the inter-vortex length scale) scales as
 $1/3$. Scaling laws such as
 $5/3$, or
 $1/3$ for the vorticity, are predicted by Kolmogorov theory and are well established for CT, when the Reynolds number of the flow is large enough (Djenidi, Antonia & Danaila Reference Djenidi, Antonia and Danaila2017). Numerical studies of QT have proved the same large-scale behaviour using the HVBK, ‘vortex filament’ or Gross–Pitaevskii models (see the recent review by Tsubota et al. (Reference Tsubota, Fujimoto and Yui2017)).
Turbulence statistics have received much attention since 1941, when Kolmogorov (Reference Kolmogorov1941a) argued that small scales have the best prospect to exhibit universal properties. This theory did not account for the internal intermittency, defined as strong fluctuations in space and time of the local, instantaneous kinetic energy dissipation rate  $\varepsilon$ (Batchelor & Townsend Reference Batchelor and Townsend1949; Townsend Reference Townsend1951). While the famous Kolmogorov turbulence theory in 1941 accounted for neither the internal intermittency phenomenon nor the finite Reynolds number (FRN) effect (e.g. Tang et al. Reference Tang, Antonia, Djenidi, Danaila and Zhou2017, Reference Tang, Antonia, Djenidi, Danaila and Zhou2018), Kolmogorov theory of 1962 (Kolmogorov Reference Kolmogorov1962) was underpinned by modified similarity hypotheses, aimed at accounting for intermittency. One important merit of the Kolmogorov theories of 1941 and 1962 is that they confer a phenomenological (Kolmogorov Reference Kolmogorov1941a, Reference Kolmogorov1962) and a theoretical (Kolmogorov Reference Kolmogorov1941b) framework allowing one to link statistics at large scales (presumably, within in an inertial range) and the smallest scales at which
 $\varepsilon$ is properly defined. Numerous later studies (She & Lévêque Reference She and Lévêque1994; Yakhot Reference Yakhot2003; Tang et al. Reference Tang, Antonia, Djenidi, Danaila and Zhou2018; Shi Reference Shi2021; Zhou Reference Zhou2021) discussed the inappropriateness of these hypotheses, and proposed adequate amendments. One of them is the accounting for the FRN effect, which implies considering in theoretical developments all specific physical phenomenon of the flow, such as decay, diffusion, production, etc. The approach developed in this work follows this philosophy, and considers all terms in the transport equations, none of them being a priori neglected.
Turbulence statistics which pertain to internal intermittency usually encompass two kinds of methods: (i) one-point statistics of small scales (reflected by gradients of the velocity field) and (ii) two-point statistics, particularly by the scaling exponents of higher-order structure functions. Note that the small-scale limit of (ii) fully recovers (i). Scaling laws of longitudinal structure functions of order  $p$, defined as the difference of the velocity component
 $u$ between two space points separated by the scale
 $r$, are sought as follows:
 \begin{equation} \langle (u(x+r) - u(x))^p \rangle \sim r^{\zeta_p}, \end{equation}
where  $u$ is the
 $x$-component velocity in the
 $(x,y,z)$ reference system,
 $r$ is the separation distance between the two points and
 $\langle \rangle$ denotes averaging. Assessing the scaling exponents demands particular care. Strictly speaking, they can only be correctly assessed in a range of scales called ‘inertial subrange’, which, in turn, requires a large Reynolds number. The exact value of the threshold depends on the flow: for instance, Ishihara, Gotoh & Kaneda (Reference Ishihara, Gotoh and Kaneda2009) showed that
 $Re_\lambda$ (based on Taylor's microscale
 $\lambda$) must exceed
 $500$, which implies a minimum resolution of
 $1024$ in a periodic box simulating homogeneous and isotropic turbulence. This requirement is very impelling for the computational resources of DNS. For lower Reynolds numbers, it is common to designate as restricted scaling range (RSR) those scales for which a scaling of different statistics can be discerned. In the RSR, the value of the scaling exponent is smaller than the asymptotic prediction of Kolmogorov. Kolmogorov theory of 1941 predicts that, under the assumption of sufficiently high Reynolds numbers, the structure function of order
 $p$ should scale as
 $\zeta _p^K=p/3$ within the inertial range (the superscript ‘
 $K$’ denotes Kolmogorov). The prediction is exact for
 $p=3$ since the Kármán–Howarth–Kolmogorov equation is deduced from the NS equations and grants the 4/5 law for longitudinal third-order structure function, for sufficiently high Reynolds numbers. However, for
 $p>3$, the deviation of the scaling exponent
 $\zeta _p$ from
 $p/3$ is often attributed to the effect of internal intermittency, although the FRN effect is also mixed up with intermittency (Tang et al. Reference Tang, Antonia, Djenidi, Danaila and Zhou2017). For CT, a solid theory for predicting higher-order moment scaling laws is still missing. One of the intricacies lies in the correct account of the FRN, and associated closures for the numerous terms highlighted in transport equations (Tang et al. Reference Tang, Antonia, Djenidi, Danaila and Zhou2018; Shi Reference Shi2021; Zhou Reference Zhou2021). Intermittency has also been addressed through Gross–Pitaevskii models (Krstulovic Reference Krstulovic2016). It is outlined that the incompressible velocity is found to be skewed for turbulent states. Comparisons with homogeneous and isotropic Taylor–Green flow revealed the universality of the statistics, including a Kolmogorov constant close to that of a classical fluid.
The HVBK model of QT at finite temperature is the perfect framework to develop such statistical analysis, since the two components of the flow are governed by NS-type equations (over which the coupling, mutual friction term is to be accounted for) and thus can be easily separated. The two components are denoted by subscripts ‘ $n$’ and ‘
 $s$’ standing for normal fluid and superfluid, respectively. The total density of the fluid is the sum of each component density,
 $\rho =\rho _n+\rho _s$. The density ratio is temperature-dependent. For
 $T \approx T_\lambda$,
 $\rho _n/\rho = 1$ and for
 $T = 0$,
 $\rho _n/\rho = 0$. Both experimental (Rusaouen et al. Reference Rusaouen, Chabaud, Salort and Roche2017) and numerical (based on the HVBK shell model) (Lvov, Nazarenko & Skrbek Reference Lvov, Nazarenko and Skrbek2006; Shukla & Pandit Reference Shukla and Pandit2016; Biferale et al. Reference Biferale, Khomenko, L'vov, Pomyalov, Procaccia and Sahoo2018) studies were devoted to inspecting intermittency by analysing the scaling exponents for higher-order structure functions. A consensus emerged that the intermittency of QT is very similar to that of CT for temperatures close to
 $T_\lambda$, or close to absolute zero (see table I in Rusaouen et al. (Reference Rusaouen, Chabaud, Salort and Roche2017)). There is no clear conclusion for intermediate temperatures (between
 $T_\lambda$ and
 $0$). Experimental studies covered a wide range of temperatures (
 $0< T< T_\lambda$) and concluded that for QT, the higher-order scaling exponents are smaller than
 $p/3$ as in CT, and they are almost unaffected by the temperature (Rusaouen et al. Reference Rusaouen, Chabaud, Salort and Roche2017). However, HVBK shell model studies led to different conclusions at intermediate temperatures, where
 $\rho _n \approx \rho _s$. Shukla & Pandit (Reference Shukla and Pandit2016) claim that for the QT at intermediate temperatures
 $\rho _n \approx \rho _s$, the scaling exponents are more significant than the Kolmogorov prediction,
 $\zeta _p^c<\zeta _p^K<\zeta _p^q$ (superscripts ‘
 $c$’ and ‘
 $q$’ stand for classical and quantum, respectively), while Boué et al. (Reference Boué, L'vov, Pomyalov and Procaccia2013) found that scaling exponents are smaller than the Kolmogorov prediction and even smaller than the scaling exponents of CT,
 $\zeta _p^q<\zeta _p^c<\zeta _p^K$. Biferale et al. (Reference Biferale, Khomenko, L'vov, Pomyalov, Procaccia and Sahoo2018) performed DNS for a gradually damped HVBK model and provided support for the latter conclusion. This discrepancy is due to the additional effect of the mutual friction force in both normal fluid and superfluid, in the case of
 $\rho _n \approx \rho _s$.
In the present work, we use DNS results based on the HVBK model for forced homogeneous isotropic turbulent flow with Reynolds number of the normal fluid (based on Taylor's microscale) close to 100. We consider density ratios  $\rho _n/\rho _s$ between 0.1 and 10, corresponding to temperature spanning
 $[0, T_\lambda ]$. Because of the moderate Reynolds numbers of the normal fluid, the range of scales over which statistics will be revealed are: the dissipative range, the RSR (intermediate scales) and large scales (comparable with the size of the simulation box, at which forcing is applied). The first question we address is regarding the role of the mutual friction in the transport equation of the third-order structure function. We deduce this equation from first principles (here, two-fluid HVBK model) by accounting for the FRN effect at each scale and different temperatures, as a function of the density ratio
 $\rho _n/\rho$. Each term of the balance equation is assessed from DNS data. We corroborate this analysis with one-point statistics of velocity derivatives, which is another tool to probe turbulent intermittency. We quantitatively study the tails of probability distribution functions (p.d.f.s) of velocity derivatives by computing the flatness, defined as the fourth-order moment normalized by the square of the second-order moment. We then compare with CT, for which DNS at very high Reynolds numbers (Ishihara et al. Reference Ishihara, Kaneda, Yokokawa, Itakura and Uno2007) revealed that the flatness of the velocity gradients is much larger than
 $3$ (typical for a Gaussian distribution). Despite the easy accessibility of small scales in numerical simulations of QT, we are not aware of any report of similar analysis for probing internal intermittency.
The paper is organized as follows. Section 2 describes the two-fluid HVBK model and the main parameters of DNS. Section 3 is devoted to inspecting each term in the transport equation of the third-order structure function, with particular attention paid to the influence of the mutual friction term over the whole range of scales and for different density ratios. Section 4 reports one-point statistics of the longitudinal velocity gradients of each fluid component and the total velocity of the turbulent flow. Section 5 deals with the flatness of the velocity derivative. Conclusions are drawn in § 6.
2. The HVBK model and DNS
We use the so-called incompressible HVBK model (Lipniacki Reference Lipniacki2006; Donnelly Reference Donnelly2009). The NS equations describe the normal fluid (variables with subscript ‘ $n$’) and the superfluid motion (variables with subscript ‘
 $s$’), with very small viscosity, is governed by an Euler-like equation:
 \begin{gather} \boldsymbol{\nabla}\boldsymbol{\cdot}\boldsymbol{v}_n =0 , \quad \boldsymbol{\nabla}\boldsymbol{\cdot} \boldsymbol{v}_s =0, \end{gather}
 \begin{gather}\frac{\partial\boldsymbol{v}_n}{\partial t}+(\boldsymbol{v}_n \boldsymbol{\cdot}\boldsymbol{\nabla})\boldsymbol{v}_n={-}\frac{1}{\rho_n}\boldsymbol{\nabla} p_n + \frac{1}{\rho_n} \boldsymbol{F}_{ns} + \nu_n \nabla^2\boldsymbol{v}_n, \end{gather}
 \begin{gather}\frac{\partial\boldsymbol{v}_s}{\partial t}+(\boldsymbol{v}_s \boldsymbol{\cdot} \boldsymbol{\nabla})\boldsymbol{v}_s={-}\frac{1}{\rho_s}\boldsymbol{\nabla} p_s - \frac{1}{\rho_s}\boldsymbol{F}_{ns}+ \nu_s \nabla^2\boldsymbol{v}_s, \end{gather}
where  $\boldsymbol {\nabla }$ stands for the nabla operator,
 $\boldsymbol {v}$ is the velocity vector,
 $\rho$ is the density and
 $p$ is the pressure. Note that the superfluid viscosity
 $\nu _s$ is theoretically zero, and it is added for the purpose of stability of numerical simulations at very low temperatures. It may also be viewed as a crude surrogate for the superfluid dissipation processes at inter-vortex scales and below (see Appendix A).
The two fluid components are coupled through a mutual friction force  $\boldsymbol {F}_{ns}$. The form of the friction force is (Hall & Vinen Reference Hall and Vinen1956; Lvov et al. Reference Lvov, Nazarenko and Skrbek2006)
 \begin{equation} \boldsymbol{F}_{ns} ={-}\frac{B}{2}\frac{\rho_s\rho_n}{\rho}\frac{\boldsymbol{\omega}_s \times (\boldsymbol{\omega}_s \times (\boldsymbol{v}_s -\boldsymbol{v}_n))}{|\boldsymbol{\omega}_s |} -\frac{B'}{2}\frac{\rho_s\rho_n} {\rho}\boldsymbol{\omega}_s \times (\boldsymbol{v}_s -\boldsymbol{v}_n), \end{equation}
where  $\boldsymbol {\omega }_s = \boldsymbol {\nabla } \times \boldsymbol {v}_s$ is the coarse-grained superfluid vorticity (see below). We assume that for the superfluid the predominant energy loss is due to macroscopic friction with the normal fluid. We implicitly neglect dissipation process by vortex reconnection. This certainly excludes the validity of such a model for temperatures very close to 0 K, and does not allow the investigation of scales smaller than the inter-vortex distance. The perpendicular component of the force in (2.4) is neglected, since it does not contribute to the energy exchange. A discussion of the impact of these simplifications is provided in Appendix C. The simplified form of the friction force is then (Lvov et al. Reference Lvov, Nazarenko and Skrbek2006)
 \begin{equation} \boldsymbol{F}_{ns} ={-}\frac{B}{2}\frac{\rho_s\rho_n}{\rho}|\boldsymbol{\nabla} \times\boldsymbol{v}_s| (\boldsymbol{v}_n -\boldsymbol{v}_s), \end{equation}
where  $B$ is a temperature-related parameter, measured in various experiments (see e.g. Barenghi, Donnelly & Vinen Reference Barenghi, Donnelly and Vinen1983). We set the value
 $B=1.5$ corresponding to the averaged value extracted from experimental data.
This calculation of the mutual friction was based on Feynman's rule. Assuming that a large number of superfluid vortices of quantized circulation  $\kappa$ are parallel (polarized) in a bucket, the equivalent solid-body rotation vorticity is
 $2 \boldsymbol {\varOmega }=|\boldsymbol {\nabla } \times \boldsymbol {v}_s| = |\boldsymbol {\omega }_s |=\kappa \mathcal {L}$, where
 $\mathcal {L}$ is the vortex line density per unit volume and
 $\boldsymbol {\varOmega }$ the equivalent angular velocity. The equivalent averaged coarse-grained velocity of the superfluid is then
 $\boldsymbol {v}_s = \boldsymbol {\varOmega } \times \boldsymbol {r}$. The validity of the expression of the mutual friction force (2.5) in general QT flows, where vortex lines are randomly oriented rather than highly polarized, is still a matter of debate. The existence in QT of dense vortex clusters (bundles) with quasi-parallel vortex lines (Sasa et al. Reference Sasa, Kano, Machida, Lvov, Rudenko and Tsubota2011; Baggaley et al. Reference Baggaley, Barenghi, Shukurov and Sergeev2012; Galantucci, Krstulovic & Barenghi Reference Galantucci, Krstulovic and Barenghi2023) supports the idea of an averaged vorticity. Obtaining a model equation for the evolution of
 $\mathcal {L}$ that accounts for non-polarized vortices is still an open question (Lipniacki Reference Lipniacki2006; Nemirovskii Reference Nemirovskii2020).
The kinematic viscosity  $\nu _n =\mu /\rho _n$ in (2.2) is a simulation parameter. Based on the concept of the two-fluid model,
 $\rho _n$ decreases with temperature, while the dynamic viscosity
 $\mu$ is also temperature-dependent. Naturally, the parameter
 $\mu$ in the two-fluid model should be taken as the dynamic viscosity
 $\mu _*$, which was measured in superfluid helium for a range of temperatures
 $1~{\rm K}< T< T_\lambda$ (see Barenghi et al. Reference Barenghi, Donnelly and Vinen1983). It is common practice in HVBK simulations to fix
 $\mu$ as a constant, independent of temperature. We adopt this simplification, since the dynamic viscosity of the normal fluid could be different from
 $\mu _*$ at low temperatures because of other dissipative effects in the superfluid. We choose here to fix
 $\nu _n$ as a constant, independent of the temperature.
We solved numerically the system of (2.1a,b)–(2.3) using Fourier pseudo-spectral methods classically used for NS equations. Direct numerical simulations were performed by adapting a NS code that proved efficient and accurate in computing higher-order statistics of turbulent flows (Gauding, Danaila & Varea Reference Gauding, Danaila and Varea2017). Periodic boundary conditions were applied to a computational box of length  $2{\rm \pi}$. Grid resolution was
 $512^3$, which was sufficient to reach a moderate
 $Re_\lambda \sim 100$, based on Taylor's microscale. We have also performed numerical simulations with a better resolution of
 $1024^3$ (see Appendix B). The results reported are not affected by the resolution, except the value of the flatness of the velocity derivative of the superfluid, as discussed later. To achieve a quasi-stationary homogeneous isotropic turbulence, an additional forcing term was added in the momentum equations (2.2) and (2.3) at large scales.
The energy injection rate  $\varepsilon _{*}$ is constant in time, for different temperatures and for both fluid components. We set
 $\varepsilon _*=7\times 10^{-4}$ for all simulations. The energy injected in the superfluid is transferred by mutual friction and eventually dissipated by the normal fluid component. But, the energy transfer becomes less efficient for low temperatures because of
 $\rho _n/\rho$ tending to zero. Accounting for an additional forcing term would result in unstable simulations. To maintain the stability of the simulations for very low temperatures, a common technique in the HVBK model is to impose an artificial viscosity
 $\nu _s$ on the superfluid. To respect the two-fluid concept, one should make sure that the artificial viscosity of the superfluid is much smaller than the viscosity of the normal fluid,
 $\nu _s\ll \nu _n$.
To summarize, in the present work we fix  $\nu _n$ as a constant independent of the temperature, and
 $\nu _s=0.1\nu _n$ for all numerical simulations. Other techniques exist, like the gradually damped HVBK model (Biferale et al. Reference Biferale, Khomenko, L'vov, Pomyalov, Procaccia and Sahoo2018) and the shell model (Boué et al. Reference Boué, L'vov, Nagar, Nazarenko, Pomyalov and Procaccia2015), for which a temperature-dependent normal fluid viscosity
 $\nu _n$ and temperature-dependent superfluid viscosity
 $\nu _s$ are imposed. The statistics of the DNS HVBK model were computed over
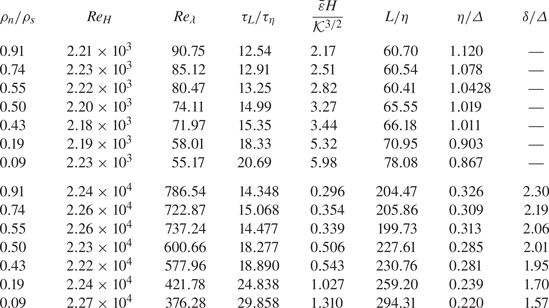
 $30$ integration time scales. Table 1 contains simulation parameters for all seven considered cases. The first part refers to the normal fluid, while the second one pertains to the superfluid.
Simulation parameters of the turbulent flow field. Here  $H = 2{\rm \pi}$ is the size of the numerical domain and
 $\varDelta =H/512$ is the mesh size in each direction;
 $Re_H$ and
 $Re_\lambda$ are the Reynolds numbers based on the large scale of the flow and Taylor's microscale, respectively;
 $\mathcal {K}$ is the mean turbulent kinetic energy; and
 $\varepsilon$ is the mean energy dissipation rate. The eddy turnover time was computed as
 $\tau _L = (2/3\mathcal {K})/\varepsilon$ and the scale of the large eddies as
 $L = (2/3 \mathcal {K})^{3/2} /\varepsilon$. Kolmogorov length and time scales are
 $\eta$ and
 $\tau _\eta$, respectively. Parameter
 $\delta = {\mathcal {L}}^{-1/2}=\sqrt {\kappa /|\omega _s|}$ is the inter-vortex length scale, with
 $\kappa =\nu _n(\kappa _{phys}/\nu _{phys})$. In all computations
 $\kappa _{phys}\approx 1\times 10^{-7}\ ({\rm m}^2\ {\rm s}^{-1})$ and
 $\nu _{phys}\approx 2.0\times 10^{-8}\ ({\rm m}^2\ {\rm s}^{-1})$.

3. Scale-by-scale evolution of the third- and fourth-order structure functions of normal fluid and superfluid
We present in this section the scale-by-scale budget equation for the fourth-order structure functions of velocity increments in a HVBK turbulent flow. We start from the transport equation of the third-order structure function for a single-fluid NS turbulent flow. This equation was derived by Hill (Reference Hill2001) and Yakhot (Reference Yakhot2003) and assessed through experimental and numerical data by Hill & Boratav (Reference Hill and Boratav2001) and Gotoh & Nakano (Reference Gotoh and Nakano2003). Denoting by  $r$ the space increment,
 $\delta u=u(x+r)-u(x)$ the longitudinal velocity increment and
 $\delta v=v(x+r)-v(x)$ the transverse velocity increment, the following transport equation was established under the assumption of homogeneity and isotropy:
 \begin{equation} \underbrace{\partial_t D_{111}}_{Term1} + \underbrace{\left(\partial_r+ \frac{2}{r}\right) D_{1111}}_{Term2} - \underbrace{\frac{6}{r} D_{1122}}_{Term2'}= \underbrace{-T_{111}}_{Term3}+ \underbrace{2\nu C}_{Term4}- \underbrace{2 \nu Z_{111}}_{Term5}, \end{equation}
where  $\partial _r \equiv \partial / \partial r$,
 $\nu$ is the kinematic viscosity and
 \begin{equation} \left.\begin{gathered} D_{111}=\langle{(\delta u)^3}\rangle, \\ D_{1111}=\langle{(\delta u)^4}\rangle, \\ D_{1122}=\langle{(\delta u)^2(\delta v)^2}\rangle, \\ C(r,t)={-}\frac{4}{r^2} D_{111} (r,t) + \frac{4}{r} \partial_r D_{111} + \partial_r \partial_r D_{111}, \\ Z_{111}=3 \left\langle{\delta u \left[\left(\frac{\partial u}{\partial x_l} \right)^2+\left(\frac{\partial u'}{\partial x_l'} \right)^2\right]}\right\rangle. \end{gathered}\right\} \end{equation}
In expressions (3.2) double indices indicate summation (over  $l=1,2,3$) and a prime refers to variables at point
 $x+r$. Term
 $Z_{111}$, also called the dissipation source term, couples components of the dissipation with
 $\delta u$, and thus acts at all scales (this is discussed in detail later). Term
 $T_{111}$ is related to the pressure gradient and has the form
 \begin{equation} {T_{111}=3\left\langle{\left( \delta u\right)^2 \delta \left( \frac{\partial p}{\partial x}\right)}\right\rangle}. \end{equation}
We apply the same approach to obtain a similar transport equation for HVBK equations (2.2)–(2.3), which have NS structure. We denote by  $D_{111}^n$ and
 $D_{111}^s$ the third-order longitudinal structure functions for normal and superfluid components, respectively. The two transport equations are
 \begin{align} \underbrace{\partial_t D_{111}^n}_{Term1} + \underbrace{\left(\partial_r+ \frac{2}{r}\right) D_{1111}^n}_{Term2} + \underbrace{\left(-\frac{6}{r} D_{1122}^n \right)}_{Term2'}&= \underbrace{-T_{111}^n}_{Term3}+ \underbrace{2\nu_n C^n}_{Term4} +\underbrace{\left({-}2 \nu_n Z_{111}^n\right)}_{Term5}\nonumber\\ &\quad + \underbrace{\left\langle(\delta u_n)^2 \left(3 \frac{\rho_s}{\rho}\delta F_{{\parallel}}^{ns}\right)\right\rangle}_{Term 6}+\underbrace{3 \langle{(\delta u_n)^2 \delta f_{{\parallel}}^{n}}\rangle}_{Term 7} , \end{align}
 \begin{align} \underbrace{\partial_t D_{111}^s}_{Term1} + \underbrace{\left(\partial_r+ \frac{2}{r}\right) D_{1111}^s}_{Term2} + \underbrace{\left(-\frac{6}{r} D_{1122}^s\right)}_{Term2'}&= \underbrace{-T_{111}^s}_{Term3}+ \underbrace{2\nu_s C^n}_{Term4} + \underbrace{\left({-}2 \nu_s Z_{111}^s\right)}_{Term5}\nonumber\\ &\quad + \underbrace{\left\langle(\delta u_s)^2 \left({-}3 \frac{\rho_n}{\rho}\delta F_{{\parallel}}^{ns}\right)\right\rangle}_{Term 6}+\underbrace{3 \langle{(\delta u_s)^2 \delta f_{{\parallel}}^{s}}\rangle}_{Term 7}. \end{align}
For the sake of simplicity, we used the same notations for different terms as in (3.1), while referring to either normal or superfluid components. New Term6 and Term7 appear. The former comes from the mutual friction force  $\boldsymbol {F}_{ns}$ (appearing with opposite signs in the two equations) and the latter from forcing terms
 $\boldsymbol {f}^{n}$ and
 $\boldsymbol {f}^{s}$ added in both equations to force turbulence.
Equations (3.4) and (3.5) allow us to obtain exact expressions of the fourth-order structure function (and, further on, of the flatness factor). Recalling that  $(\partial _r+ {2}/{r})=(\partial _r(r^2 ))/r^2$, we obtain after integration with respect to the scale
 $r$:
 \begin{gather} D_{1111}^n=\frac{1}{r^2} \int_0^r s^2 \left({-}Term1\!-\!Term2'\!+\!Term3+Term4+Term5+Term6+Term7\right)^n \,{\rm d}s, \end{gather}
 \begin{gather} D_{1111}^s=\frac{1}{r^2} \int_0^r s^2 \left({-}Term1\!-\!Term2'\!+\!Term3+Term4+Term5+Term6+Term7\right)^s \,{\rm d}s. \end{gather}
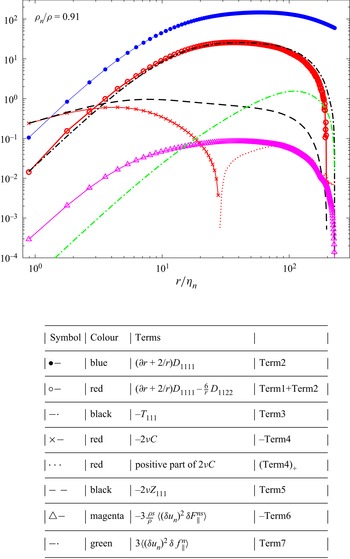
To assess the importance of each term in transport equations (3.4)–(3.5) for the third-order structure functions, we naturally start with the simulation case  $\rho _n/\rho =0.91$ (see table 1). For this case, where the normal fluid is predominant, the results are expected to be similar to those known for a classical single-fluid turbulent flow (Hill & Boratav Reference Hill and Boratav2001). Figure 1 shows the scale dependence of each term in (3.4), after normalization by
 $\varepsilon _*^{5/4}\nu _n^{1/4}$, with
 $\varepsilon _*$ the constant energy rate injected to force turbulence. Note that for this case the smallest resolved scale is smaller than the Kolmogorov scale
 $\eta _n$ (see table 1).
Case  $\rho _n/\rho =0.91$ (the normal fluid is dominant). Terms in the budget equation (3.4) for the normal fluid. Scale
 $r$ is normalized by the Kolmogorov scale
 $\eta _n$ of the normal fluid. All terms are normalized by
 $\varepsilon _*^{5/4}\nu _n^{1/4}$, with
 $\varepsilon _*=7\times 10^{-4}$ the constant energy rate injected to force turbulence.

Term1 reflects the temporal decay of the third-order structure function. This term is zero for steady-state flows and thus negligible here. Term2 (blue filled circles) is the prevalent term over the scales within the RSR. The sum of the two transport terms Term2  $+$ Term2
 $'$ (red open circles) balances the pressure-related Term3 (black dot-dashed curve) fairly well, over the whole range of scales.
Term4 (red crosses, plotted with changed sign) is negative at small scales and positive at large scales. It represents the viscous destruction of the third-order structure functions. As expected, this contribution is negligible over the RSR, but becomes important in the viscous range. At the smallest resolved scale, this is the most prevalent term and is balanced by Term5 (black dashed curve), the dissipation source term. This term exhibits a plateau over the RSR, and it is  $15\,\%$ of the other terms. Albeit smaller, this term cannot be ruled out.
Term6 (magenta triangles), representing the friction force coupling, is the less important term. This seems reasonable behaviour for a fluid essentially composed of normal fluid. Note also that Term6 is negative for the normal fluid, so the figure illustrates ( $-Term6$). Finally, the forcing term (Term7; green dot-dashed curve) affects the very large scales only and its effect gradually diminishes towards small scales.
The analysis of this case suggests that, as in classical single-fluid turbulence (Hill & Boratav Reference Hill and Boratav2001), the two transport terms (Term2  $+$ Term2
 $'$) are only balanced by the pressure-related term, Term3. This occurs over the whole range of scales, albeit the effect of the viscosity is obviously felt within the viscous range. The same conclusion was reached by Hill & Boratav (Reference Hill and Boratav2001) on the basis of experimental and DNS data. However, those authors did not calculate exactly the dissipation source term or the forcing term (which was neglected within the derivation, on the basis of the assumption of very large Reynolds numbers). They also noted departures from homogeneity and isotropy, which are clearly observed in our simulations.
Another important remark is that, despite the low Reynolds number of the flow ( $R_\lambda \leq 100$), all terms that might have represented the FRN effect (friction force coupling through Term6, forcing term Term7 and dissipation source term Term5) are negligible. Therefore, there is no direct imprint of the FRN effect on the fourth-order moments of velocity increments. There is the possibility that this effect might be indirect, through the pressure field. The conclusion that the FRN effect is negligible is further supported by other simulations for different temperatures (see below). The consequences are that fourth-order structure functions are only shaped by the pressure field. This observation was revealed by, for example, Yakhot (Reference Yakhot2003) and Gotoh & Nakano (Reference Gotoh and Nakano2003). The latter authors suggested a valuable model for the role of the pressure in turbulence.
We now extend our analysis to other cases (see table 1). We consider the case  $\rho _n/\rho =0.5$ (temperature around 2 K) with balanced normal and superfluid fractions and the case
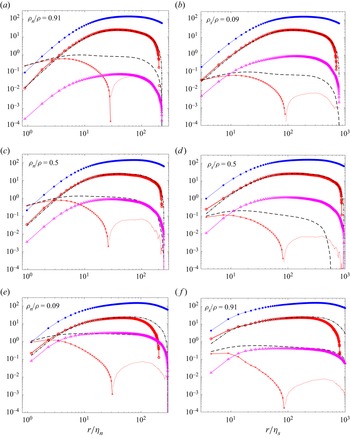
 $\rho _n/\rho =0.09$ (temperature close to 0.3 K) with the superfluid dominating the flow. Terms in (3.4)–(3.5) are depicted in figure 2. For the coherence of the message, we replot in figure 2(a,b) the results obtained for
 $\rho _n/\rho =0.91$.
Terms in (3.4) for the normal fluid (a,c,e) and in (3.5) for the superfluid (b,d,f). Simulations were performed for three density ratios  $\rho _n/\rho = 0.91$ (a,b),
 $0.5$ (c,d) and
 $0.09$ (e,f). Scale
 $r$ is normalized by Kolmogorov scales
 $\eta _n$ (normal fluid) and
 $\eta _s$ (superfluid). All terms are normalized by
 $\varepsilon _*^{5/4}\nu _n^{1/4}$, with
 $\varepsilon _*=7\times 10^{-4}$ the constant energy rate injected to force turbulence in both fluid fractions. Same legend as in figure 1 for the graphical representation of different terms.

Term1 reflects the temporal decay of the third-order structure function. As stated above, this term is absent in our simulations. We have kept it in the transport equations, as it provides a way to assess the degree to which other terms influence its behaviour. For a direct cascade,  $D_{111}$ is negative. An enhancement of the cascade is consistent with positive values of the temporal derivative of
 $(-D_{111})$. For the normal fluid, this enhancement can be the result of the friction force coupling, via Term6, which is negative (so
 $-Term6$ is positive). Therefore, the cascade of the normal fluid may be enhanced by Term6. The opposite effect stands for the superfluid, for which Term6 is positive. The origin of this different sign is at the level of the HVBK model, for which the coupling term is accounted for with different signs, reflecting an enhancement of the momentum for the normal fluid and a reduction of the momentum for the superfluid.
Forcing terms (Term7) are not shown in figure 2, because they only affect very large scales. Generally speaking, as already emphasized, they exhibit behaviour similar to that of CT, if high temperatures are considered, corresponding to  $\rho _n/\rho =1$. However, the additional mutual friction term (Term6) plays a requisite role particularly for low temperatures, thus distinguishing the HVBK flow from classical fluids. In the following section, we analyse the results for each specific range of scales.
3.1. Dissipative scales
For the normal fluid, similar to CT at small scales, the pressure source Term3 and transport terms (Term2  $+$ Term2
 $'$) scale as
 $r^3$. In contrast, the viscous Term4 and dissipation source Term5 vary proportionally to
 $r$. The viscous Term4 balances the dissipation source Term5 for the very small scales. Although small differences between these two terms are noticeable for the lowest density ratio (
 $\rho _n/\rho =0.09$; see figure 2e,f), they are most likely due to the limited grid resolution. If we decrease
 $r$ to very small values, the two terms eventually cancel each other. Moreover, transport terms (Term2
 $+$ Term2
 $'$) are nearly balanced by the pressure source Term3 for the normal fluid (as already discussed and illustrated in figure 2a,c,e).
For the superfluid (figure 2b,d,f), unlike CT at smallest scales, transport terms are slightly larger than the pressure source term. This difference is most likely attributable to the equipartition of energy (Salort et al. Reference Salort, Baudet, Castaing, Chabaud and Daviaud2010a), which finally results in the accumulation of energy at highest wavenumbers due to the very small value of the superfluid viscosity. Moreover, when the superfluid is dominant in the flow, the kinetic energy cannot be completely dissipated. This energy accumulates at the scales of the same order as the inter-vortex scale, which leads to an upward trend for the superfluid velocity spectrum. In quantum physics, this is associated with a partial thermalization of superfluid excitations (Barenghi et al. Reference Barenghi, Skrbek and Sreenivasan2014b). Note that the upward trend of the superfluid velocity spectrum depends on simulation parameters of the HVBK model. The truncated HVBK model resolves two coupled viscous fluids with different, albeit constant, viscosities. The ability to settle the smallest scales of both fluids requires, nonetheless, a sufficiently high resolution.
For small scales, the mutual friction term (Term6) scales as  $r^3$ in both normal and superfluid components. Term6 decreases much faster than both dissipation source and viscous terms. This underlines that at small scales, the viscous and the dissipation source terms (both directly depending on the viscosity) are dominant.
3.2. Intermediate scales
Considering the moderate values of the Reynolds number in these simulations, a clear inertial range is not established. We prefer to refer to a RSR, defined as the range of scales over which different statistics exhibit a discernible scaling, albeit with exponents smaller than those predicted by asymptotic (for infinitely large Reynolds numbers) theories.
An analytical form of the fourth-order longitudinal structure function can be obtained from (3.1) by integrating the sum of terms 1 to 5:
 \begin{equation} D_{1111}=\frac{1}{r^2} \int_0^r s^2 \left({-}Term1-Term{2'}+Term3+Term4+Term5\right) {\rm d}s. \end{equation}
In a statistically steady flow, Term1 is zero. In the RSR, Term4 is negligible. One condition that  $D_{1111}$ follows a pure power law is consistent with the requirement that all terms on the right-hand side of (3.8) also exhibit pure power laws, or cancel each other. Term2
 $'$ and Term3 are shown to follow similar power laws, while the dissipation source Term5 exhibits a different exponent (Boschung et al. Reference Boschung, Hennig, Denker, Pitsch and Hill2017). It is important to shed some light on the difference between CT and HVBK QT entailed by the mutual friction coupling effect quantified by Term6.
Similar to CT, the RSR is not clearly discernible due to the low value of the Reynolds number. Nonetheless, the pressure source Term3 perfectly balances transport terms (Term2  $+$ Term2
 $'$), while the viscous Term4 is negligible. Unlike the CT in the RSR, the mutual friction Term6 acts as a source term. Since
 $D_{111}$ is negative,
 $\partial _t D_{111} < 0$ reflects vortex stretching enhancement, whilst
 $\partial _t D_{111} > 0$ correlates with reduced vortex stretching. The sign of Term6 (negative in (3.4) and positive in (3.5)) directly reflects enhanced vortex stretching in the normal fluid (thus, an accelerated cascade) and reduced vortex stretching and cascade in the superfluid.
For the normal fluid, Term6 and the dissipation source Term5 have opposed signs. For decreasing values of the density ratio  $\rho _n/\rho$, the mutual friction Term6 gradually increases, which in turn leads to an enhancement of the dissipation source Term5. The physical picture behind this statistical equilibrium between terms is that the increase of the vortex stretching rate reflected by Term5 requires damping through the dissipation source term. For the flow to be statistically stationary at the highest normal fluid density ratio (
 $\rho _n/\rho =0.91$), only a small vortex stretching rate has to be introduced by the mutual friction. The normal fluid remains indeed unaffected by the superfluid, thus behaving as in CT. When the superfluid is dominant (
 $\rho _n/\rho =0.09$), the mutual friction becomes important in the normal fluid, thus resulting in a large dissipation source term. At the level of (3.6) and (3.7), the dissipation source term is non-negligible. This term can effectively modify the scaling exponent of the fourth-order structure functions of velocity increment in the RSR. Interestingly, one can expect that for
 $0.09<\rho _n/\rho <0.5$, the mutual friction term cancels the dissipation source term completely. This could trigger an exact
 $4/3$ scaling exponent for the fourth-order structure functions in the RSR, for the normal fluid. Therefore, one of our important conclusions is that the normal fluid behaves at very low temperatures as a perfect fluid, since viscous effects are annihilated by the mutual friction coupling.
For the superfluid, the mutual friction Term6 and the dissipation source Term5 are positive and thus reduce the vortex stretching. When one of them grows, the other one diminishes. In the inviscid limit  $\nu _s = 0$, only Term6 prevails. When the temperature goes to absolute zero, Term6 diminishes and there is no source in the superfluid. In CT, the scaling exponent of the fourth-order structure functions of the velocity increment in RSR (or in the inertial range) should be
 $\zeta _4=4/3$ as predicated by the Kolmogorov theory of 1941. In the HVBK model, the viscosity of the superfluid
 $\nu _s$ is not exactly zero. For large superfluid density ratios (
 $\rho _s/\rho =0.91$) the mutual friction term is small and the dissipation source term prevails, being comparable with Term6. For low superfluid density ratios (
 $\rho _s/\rho =0.09$), the dissipation source term is negligible compared with the mutual friction term in the RSR. Both Term6 and Term5 are scale-dependent and they may impact the scaling exponent of the fourth-order structure functions.
Finally, the mutual friction terms make the behaviour of the fourth-order structure function in the RSR to be more complicated than in CT. The normal fluid is associated with an enhanced dissipation source term in the RSR for lower and lower temperatures (decreasing  $\rho _n/\rho$). In the superfluid, the mutual friction term acts as an addition to the dissipation source term.
In the following, we complete our overview of the flow by focusing on the smallest scales, represented by velocity gradients.
4. One-point statistics of velocity gradients
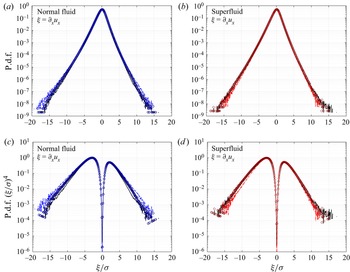
We focus on one-point statistics of the small-scale motion. Particular emphasis is put on the flatness of the velocity gradient, which reflects the effect of turbulence intermittency on small-scale dynamics. The p.d.f.s of the longitudinal velocity gradient  $\xi = \partial _x u$, for the same density ratios as previously (
 $\rho _n/\rho =0.91,0.5, 0.09$), are shown in figures 3(a) and 3(b) for normal and superfluid components, respectively. Similar to CT, p.d.f.s exhibit non-Gaussian skewed shapes, with stretched tails skewed towards negative values of the velocity gradients. Note that negative values of velocity gradients are much larger than the variance. For decreasing values of the normal fluid density ratios, the p.d.f. tails become more and more stretched. However, p.d.f.s of the velocity gradients in the superfluid show non-monotonic trends.
The p.d.f.s of gradients of longitudinal velocity in the normal fluid (a) and superfluid (b). (c,d) Corresponding normalized p.d.f.s as  $(\xi /\sigma )^4 \times \textrm {p.d.f.}$, with
 $\sigma = \sqrt {\langle \xi ^2 \rangle - \langle \xi \rangle ^2}$ the standard deviation of the velocity gradient. Results are provided for three density ratios:
 $\rho _n/\rho =0.09$ (dot-dashed curve),
 $\rho _n/\rho =0.5$ (open circles) and
 $\rho _n/\rho =0.91$ (solid curve).

The integration over the whole domain leads to the  $p$th-order moment of
 $\xi$:
 \begin{equation} \langle \xi^p \rangle = \int_{-\infty}^{\infty}\xi^p PDF(\xi) \,{\rm d}\xi. \end{equation}
The normalized fourth-order moment is the flatness factor:
 \begin{equation} F = \frac{\langle \xi^4\rangle}{\langle \xi^2\rangle ^2}. \end{equation}
Figure 3 shows p.d.f.s of gradients of longitudinal velocity (figure 3a,b) and normalized p.d.f.s (figure 3c,d) as  $(\xi /\sigma )^4 \times \textrm {p.d.f.}$, where
 $\sigma = \sqrt {\langle \xi ^2 \rangle - \langle \xi \rangle ^2}$ is the standard deviation of the velocity gradient. The p.d.f.s are well converged for large events, with errors smaller than
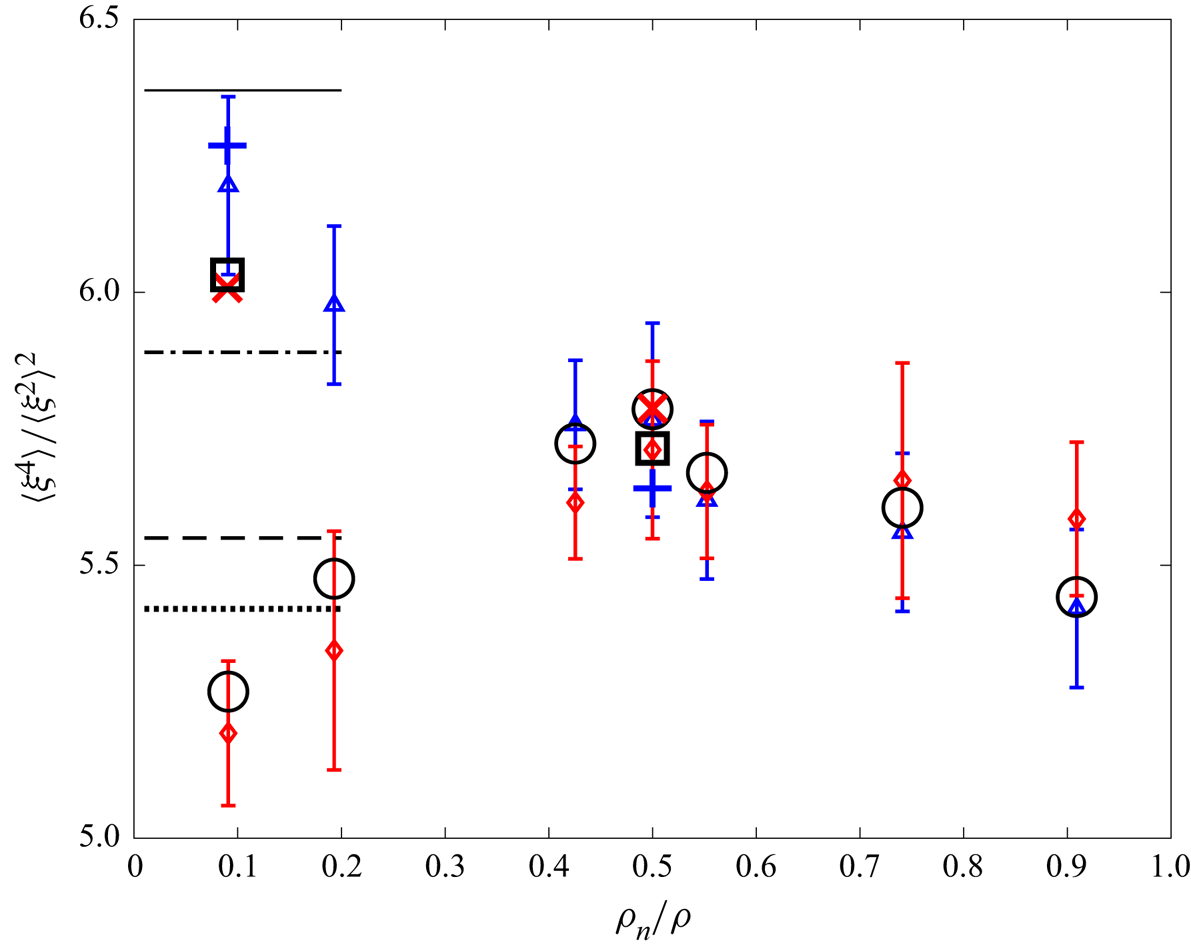
 $1\,\%$. This signifies that flatness factors computed from the p.d.f.s are accurate. Flatness factors are plotted in figure 4 for all considered cases. For the normal fluid, the flatness factor increases monotonically when
 $\rho _n/\rho$ diminishes, which indicates that the intermittency in normal fluid is enhanced for lower and lower temperatures. The superfluid follows the same trend as that of the normal fluid.
Flatness factors of the longitudinal velocity gradient  $\xi =\partial _x u$ versus density ratio
 $\rho _n/\rho$ for the normal fluid (triangles), the superfluid (diamonds) and total fluid (circles). Error bars are the root-mean-square value of the variance of the flatness factors computed with 20 to 50 snapshots, and
 $10^8$ data points for each snapshot. Horizontal lines mark the flatness factor computed from DNS of CT (Ishihara et al. Reference Ishihara, Kaneda, Yokokawa, Itakura and Uno2007):
 $Re_\lambda =94.6$ (dotted),
 $R_\lambda =94.4$ (dashed),
 $R_\lambda =167$ (dot-dashed) and
 $R_\lambda =173$ (solid). All points are computed for
 $N=512$, except the following ones, based on
 $N=1024$ resolution: blue plus (normal fluid), red cross (superfluid) and black square (total fluid).

This observation can be explained by the energy exchange between the two fluid components. On average, mutual friction acts as a source term that enhances energy at all scales in the normal fluid. Since energy input is expected to occur mainly at locations with strong vorticity, we suggest the following scenario. First, vorticity distributions in the two fluids are coherent (aligned) and the mutual friction depends directly on the magnitude of the vorticity. As the relative velocity seems to be uniformly distributed in space, with a Gaussian p.d.f., we infer that the mutual friction enhances locally the vorticity and thus the intermittency. When the density ratio  $\rho _n/\rho$ decreases, the mutual friction term in the normal fluid momentum equation is more important. As a consequence, the intermittency grows when the temperature diminishes. The superfluid is strongly locked with the normal fluid, thus following a similar trend.
We further compute the flatness of the total longitudinal velocity gradient  $\partial _x u = ({\rho _n}/{\rho })\partial _x u_n +({\rho _s}/{\rho })\partial _x u_s$, with
 $u_n$ and
 $u_s$ the longitudinal velocity components in normal fluid and superfluid, respectively. Flatness factors of the total longitudinal velocity gradient are plotted against
 $\rho _n/\rho$ in figure 4. The flatness factor is controlled by the normal fluid for high
 $\rho _n/\rho$ and by the superfluid for low
 $\rho _n/\rho$. The intermittency of the total fluid continuously increases when the temperature diminishes.
In figure 4, horizontal short lines indicate DNS results of CT flatness factor for different values of  $R_\lambda$ (Ishihara et al. Reference Ishihara, Kaneda, Yokokawa, Itakura and Uno2007). For Reynolds numbers close to that considered in our simulations (
 $R_\lambda \approx 94$), the flatness
 $F$ in CT ranges between
 $5.42$ and
 $5.55$. These values are very close to the flatness we obtained for
 $\rho _n/\rho = 0.91$, corresponding to
 $R_\lambda \approx 90$ in the normal fluid. When
 $\rho _n/\rho$ decreases,
 $R_\lambda$ also decreases in normal fluid (due to the mutual friction), and the flatness factor increases for the total fluid. We obtained the value
 $F=5.786$ for
 $\rho _n/\rho =0.5$. While a resolution of
 $N=512$ leads to a flatness that drops back to
 $F=5.268$ for
 $\rho _n/\rho =0.09$, an enhanced resolution of
 $N=1024$ leads to values comparable for both normal and superfluid, thus emphasizing their locking.
The HVBK QT simulated here exhibits the same degree of intermittency as observed in CT.
5. The flatness of the velocity derivative in superfluid turbulence
At this stage, it is important to go back to the theoretical framework provided by first principles (here the HVBK equations) and to consider the limiting behaviour of (3.4) and (3.5).
To obtain the expression of the flatness derivative, we consider that  $r \rightarrow 0$ and apply a Taylor series expansion up to the fifth order in
 $r$ (Djenidi et al. Reference Djenidi, Antonia and Danaila2017; Tang et al. Reference Tang, Antonia, Djenidi, Danaila and Zhou2017, Reference Tang, Antonia, Djenidi, Danaila and Zhou2018). Using the homogeneity hypothesis, we obtain
 \begin{equation} \frac{\partial}{\partial x}
\left\langle \left( \frac{\partial u}{\partial x} \right)^2
\left(\frac{\partial ^2u}{\partial {x^2}} \right)\right\rangle =
0 \Longrightarrow 2 \left\langle
\left(\frac{\partial u}{\partial x}\right) \left(
\frac{\partial^2 u}{\partial x^2}\right) \right\rangle
={-}\left\langle \left(\frac{\partial u}{\partial
x}\right)^2 \left( \frac{\partial^3 u}{\partial
x^3}\right) \right\rangle,
\end{equation}
and hence
 \begin{equation} \left\langle {(\delta u)^3} \right\rangle \simeq \left\langle {\left(\frac{\partial u}{\partial x} \right)^3} \right\rangle r^3 {- \frac{1}{4}} \left\langle {\left(\frac{\partial u}{\partial x}\right) \left( \frac{\partial^2 u}{\partial x^2}\right)^2} \right\rangle r^5+\cdots. \end{equation}
The fourth-order structure function can be written as
 \begin{equation} D_{1111}= \left\langle {(\delta u)^4} \right\rangle \simeq \left\langle { \left( \frac{\partial u}{\partial x}\right)^4} \right\rangle r^4+ \cdots\end{equation}
and similarly
 \begin{equation} D_{1122}= \langle{\left(\delta u \right)^2\left(\delta v \right)^2} \rangle \simeq \left\langle { \left( \frac{\partial u}{\partial x}\right)^2 \left( \frac{\partial v}{\partial x}\right)^2} \right\rangle r^4+\cdots. \end{equation}
An equation for  $F$, the velocity derivative flatness factor (4.2), can be obtained (Tang et al. Reference Tang, Antonia, Djenidi, Danaila and Zhou2018) by applying the following operator
 ${{O}}$ to terms in (3.4) and (3.5):
 \begin{equation} {{O}}(Term) \equiv \lim_{r\rightarrow 0} \frac{\dfrac{Term}{r^3}}{\dfrac{\left\langle {(\delta u)^2} \right\rangle^2}{r^4}}=\lim_{r\rightarrow 0} r {\cdot} \frac{Term}{\left\langle {(\delta u)^2} \right\rangle^2}. \end{equation}
We obtain that
 \begin{equation} {{O}} (Term 2')= \left. -6 \left\langle { \left( \frac{\partial u}{\partial x}\right)^2 \left( \frac{\partial v}{\partial x}\right)^2} \right\rangle \right/ \left\langle { \left( \frac{\partial u}{\partial x}\right)^2} \right\rangle^2 ={-}6 S_{uv,2}, \end{equation}
where the notation  $S_{uv,2}$ is introduced for the sake of simplicity. The pressure term becomes, once
 ${O}$ is applied,
 \begin{equation} {{O}} (Term 3) ={-}\frac{\displaystyle 3 \left\langle {\left(\dfrac{\partial u}{\partial x}\right)^2 \dfrac{\partial^2 p }{\partial x^2} } \right\rangle}{\displaystyle \left\langle {\left(\dfrac{\partial u}{\partial x}\right)^2} \right\rangle^2}. \end{equation}
After applying the operator  ${O}$, the dissipation term leads to
 \begin{equation} {{O}} (Term 4)|_{r^3} = \frac{\displaystyle 9\nu \left\langle { \left( \frac{\partial^3 u}{\partial x^3}\right)\left( \frac{\partial u }{\partial x}\right)^2 } \right\rangle }{\displaystyle \left\langle {\left(\frac{\partial u}{\partial x}\right)^2} \right\rangle^2}. \end{equation}
Term5 leads to
 \begin{equation} {{O}} (Term 5)|_{r^3} ={-}\frac{\displaystyle 2\nu \left\langle { \left( \frac{\partial^3 u}{\partial x^3}\right)\left(\frac{\partial u }{\partial y}\right)^2 } \right\rangle +4\nu \left\langle { \left(\frac{\partial^3 u}{\partial x^3}\right)\left(\frac{\partial u }{\partial x}\right)^2} \right\rangle}{\displaystyle \left\langle {\left(\frac{\partial u}{\partial x}\right)^2} \right\rangle^2}. \end{equation}
Term6, specific to HVBK equations, after Taylor series expansion and application of the operator  ${O}$, leads to for the normal fluid
 \begin{equation} {{O}} (Term 6)^n \sim \frac{\displaystyle 3 \frac{\rho_s}{\rho} \left\langle {\left(\frac{\partial u}{\partial x}\right)^2\left(\frac{\partial F_{{\parallel}}}{\partial x}\right)^{ns}} \right\rangle}{\displaystyle{\left\langle {\left(\frac{\partial u}{\partial x}\right)^2} \right\rangle^2}} \end{equation}
and for the superfluid
 \begin{equation} {{O}} (Term 6)^s \sim{-}\frac{\displaystyle 3 \frac{\rho_n}{\rho} \left\langle {\left(\frac{\partial u}{\partial x}\right)^2\left(\frac{\partial F_{{\parallel}}}{\partial x}\right)^{ns}} \right\rangle}{\displaystyle{\left\langle {\left(\frac{\partial u}{\partial x}\right)^2} \right\rangle^2}}. \end{equation}
Similarly, Term7 leads to for the normal fluid
 \begin{equation} {{O}} (Term 7)^n \sim \frac{\displaystyle 3 \left\langle {\left(\frac{\partial u}{\partial x}\right)^2\left(\frac{\partial f_{{\parallel}}}{\partial x}\right)^{n}} \right\rangle}{\displaystyle {\left\langle {\left(\frac{\partial u}{\partial x}\right)^2} \right\rangle^2}} \end{equation}
and for the superfluid
 \begin{equation} {{O}} (Term 7)^s \sim \frac{\displaystyle 3 \left\langle {\left(\frac{\partial u}{\partial x}\right)^2\left(\frac{\partial f_{{\parallel}}}{\partial x}\right)^{s}} \right\rangle}{\displaystyle{\left\langle {\left(\frac{\partial u}{\partial x}\right)^2} \right\rangle^2}}. \end{equation}
The limiting form of (3.4) and (3.5) as  $r \rightarrow 0$ can be finally presented as
 \begin{align} {6(F^n-S_{uv,2}^n)} &= {{O}} (Term 3)^n +{{O}} (Term 4)^n|_{r^3} +{{O}} (Term 5)^n|_{r^3}+ {{O}} (Term 6)^n\nonumber\\ &\quad +{{O}} (Term 7)^n, \end{align}
 \begin{align} {6(F^s-S_{uv,2}^s)} &= {{O}} (Term 3)^s +{{O}} (Term 4)^s|_{r^3} +{{O}} (Term 5)^s|_{r^3}+ {{O}} (Term 6)^s\nonumber\\ &\quad +{{O}} (Term 7)^s . \end{align}
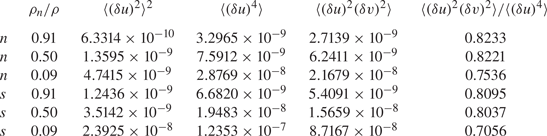
Djenidi et al. (Reference Djenidi, Antonia and Danaila2017) showed that  $S_{uv,2} / F \approx 0.85$ if
 $Re_\lambda >200$ and this constant is independent of the Reynolds number. For the present study, values of
 $S_{uv,2} / F$ are shown for different density ratios in table 2. These values remain almost unchanged for
 $\rho _n/\rho = 0.91, 0.5$, but, for
 $\rho _n/\rho = 0.09$,
 $S_{uv,2} / S_4$ slightly diminishes and decreases to
 $0.75$ for the normal fluid and
 $0.705$ for the superfluid.
Values used in expressing the flatness factor at the smallest scales in the limit  $r\rightarrow 0$. Practically
 $(r\rightarrow \varDelta$), with
 $\varDelta$ the smallest grid size in simulations (see table 1 for the Kolmogorov normalized mesh size).

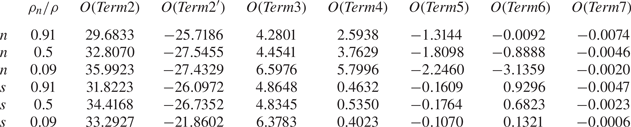
Table 3 shows that all terms in (5.14) and (5.15) are reasonably well balanced. This proves that all terms are correctly accounted for. In the normal fluid, the balance between different terms is reached within an error of  $0.05\,\%$ for the flatness
 $F$. Term
 ${{O}}(Term3)$ increases as the temperature diminishes (the normal fluid is less and less present). Viscous terms are not negligible in the case of the present
 $Re_\lambda$. The combined contribution of
 ${{O}}(Term4)+{{O}} (Term5)$ increases, but this enhancement is counterbalanced by the mutual friction force contribution
 ${{O}} (Term 6)$. The external force has a negligible contribution.


For the superfluid, only the pressure-related term  ${{O}}(Term 3)$ matters. This result corroborates with a scenario valid for large Reynolds numbers in CT. Term
 ${{O}}(Term 3)$ increases monotonically when the temperature decreases. For the lowest temperature, the ratio
 $S_{uv,2} /F$ is the smallest and both
 $S_{uv,2}$ and
 $F$ are smaller than for higher temperatures. This behaviour is corroborated by the spectral cut-off inherently introduced in DNS at the inter-vortex scale, which leads to an underestimation of high-order moments of small scales (here, represented by velocity gradients). However, this behaviour can have a physical explanation in superfluid helium by the energy accumulation at scales close to the inter-vortex scale. We finally note that for
 $\rho _n/\rho =0.09$ the terms are not well balanced as in other cases and errors are larger. This is due to the limited resolution for the superfluid at low temperatures.
6. Conclusion
We used DNS of the HVBK model to inspect, for different density ratios, the behaviour of the fourth-order structure function, as resulting from the transport equation of the third-order structure function. Starting from the HVBK equations for two fluids, we derived the third-order structure function transport equations in both normal fluid and superfluid. Within the RSR, we found that the mutual friction does not modify significantly the dynamics of viscous scales. Similar to CT, viscous terms and dissipative source terms are less important than the other terms. The mutual friction term acts differently for the two fluid components. For the normal fluid, the mutual friction term has an opposite sign with respect to the dissipation source terms. Depending on the density ratios, it can diminish, and even completely cancel the action of the dissipation source term. For the lowest temperature, we show that the normal fluid behaves, in the RSR, as a fluid with zero viscosity. In superfluid, the mutual friction term is mostly irrelevant. It can be neglected when compared with the transport terms and the pressure source term. The dissipation source term, introduced by the (artificial) superfluid viscosity, has the same sign as the mutual friction term, finally resulting in a diminished cascade and reduced small-scale intermittency, as reflected by the flatness of the velocity derivative. Note that RSR intermittency effects are not addressed here, as the conventional assessment of the scaling exponents is limited by the relatively low values of the Reynolds numbers.
We also used one-point statistics, p.d.f.s of longitudinal velocity gradient to analyse the temperature dependency of small-scale intermittency of QT. We conclude that both the normal fluid and superfluid intermittency is enhanced when  $\rho _n/\rho$ is decreasing. This is consistent with the strong locking of the two fluids. The flatness factors are also found to be in reasonable agreement with CT. Further perspectives of this work include the account of a more general expression of the friction force, based upon at least one additional equation, for example that for the vortex line density (Nemirovskii Reference Nemirovskii2020). Another open question is the coupling between NS-like equations and the Gross–Pitaevskii equation for very small scales and very low temperatures.
Acknowledgements
Dr M. Gauding and Dr G. Sadaka are warmly thanked for technical support and useful discussions.
Funding
The authors acknowledge financial support from French ANR grant ANR-18-CE46-0013 QUTE-HPC. This work used computational resources provided by CRIANN (Centre Régional Informatique et d'Applications Numériques de Normandie).
Declaration of interests
The authors declare no conflict of interest.
Appendix A. Robustness of the results for a smaller viscosity ratio
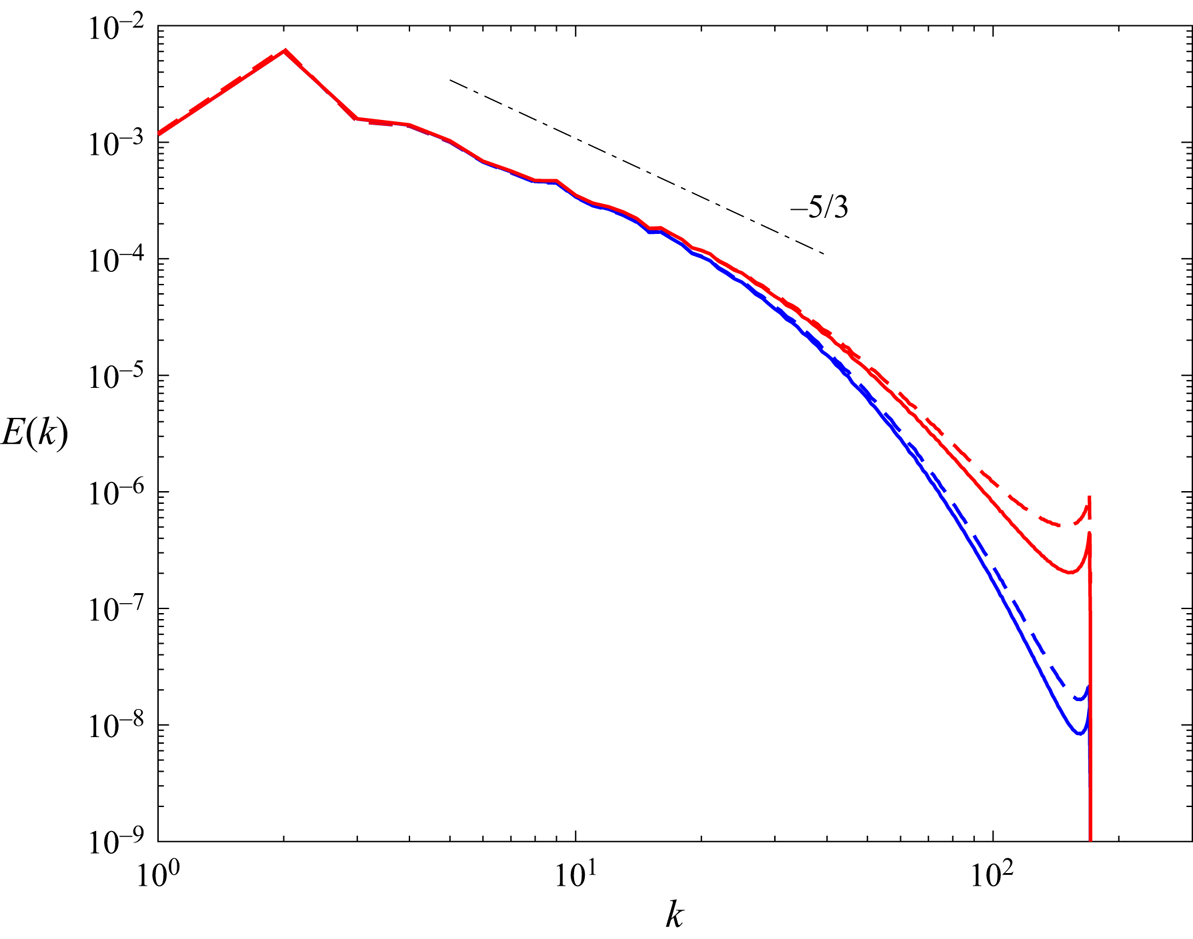
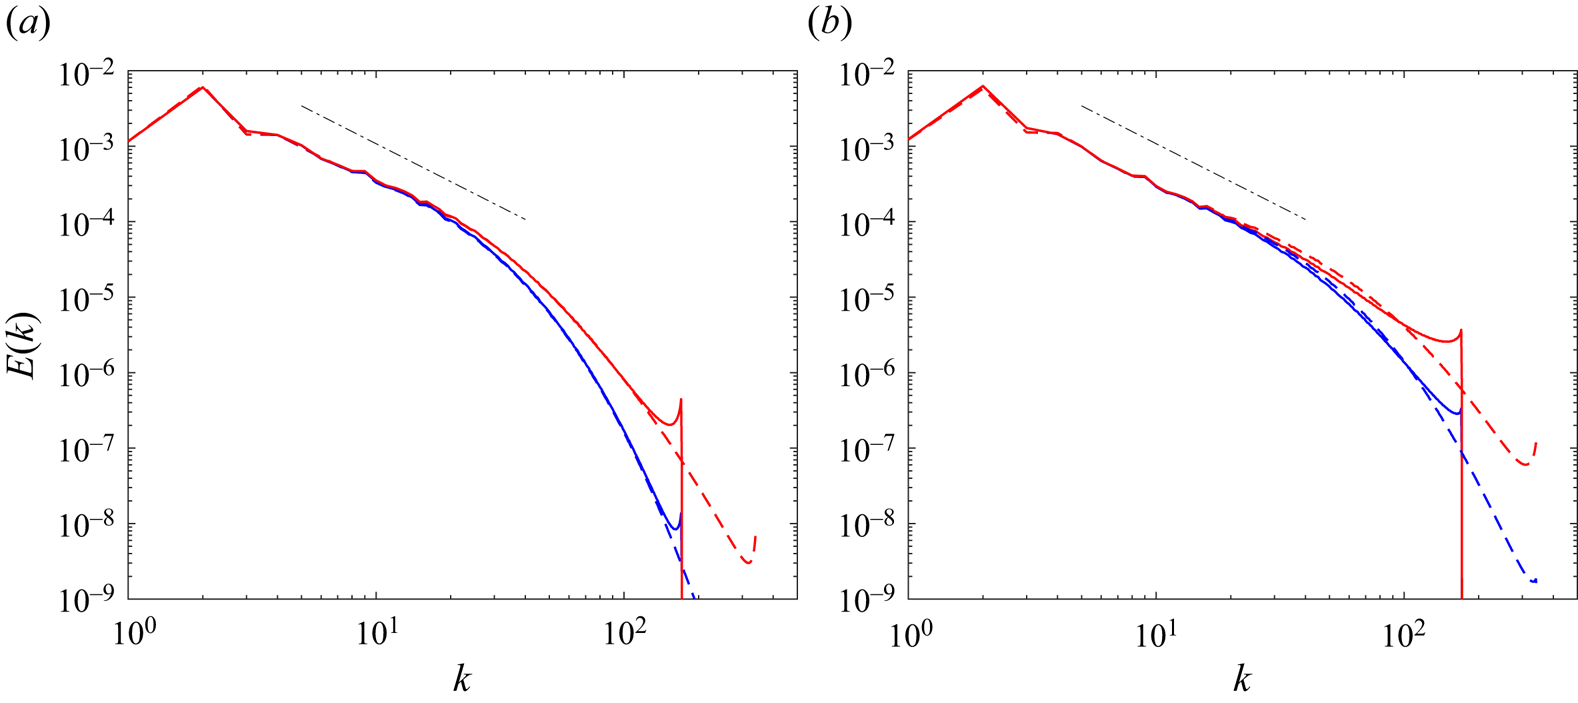
We have performed numerical simulations for a different viscosity ratio, i.e.  $0.025$, a quarter of that initially studied and reported in the corpus of the paper. Figure 5 shows the energy spectrum for different viscosity ratios, and for the density ratio of
 $\rho _s/\rho _n = 1$. For smaller viscosity ratio
 $\nu _s/\nu _n=0.025$, the energy content at the level of the cut-off scales is slightly larger than for the viscosity ratio
 $\nu _s/\nu _n=0.1$. While this result is obvious, as the superfluid dissipates less, the difference is negligible. The dissipation scale
 $\eta _s = (\nu _s^3/\varepsilon _s)^{1/4}$ (the Kolmogorov scale) for the smaller viscosity ratio
 $\nu _s/\nu _n=0.025$ is significantly reduced, and equal to
 $\eta _s = 0.0017$, whereas it was
 $\eta _s = 0.0034$ for
 $\nu _s/\nu _n=0.1$. For
 $\nu _s/\nu _n=0.025$, the viscosity of the superfluid decreases, while the mean energy dissipation rate of the superfluid increases. The dissipation rate for
 $\nu _s/\nu _n=0.1$ was
 $\varepsilon _s = 1.8\times 10^{-4}$, while for
 $\nu _s/\nu _n=0.025$ we compute
 $\varepsilon _s = 5.5463\times 10^{-4}$. The reason for this increase is the accumulation of the energy at small scales, resulting in an increase of velocity gradients.
Energy spectrum for  $\rho _s/\rho _n=1$ and different viscosity ratios: for
 $\nu _s/\nu _n = 0.025$ (dashed curve) and for
 $\nu _s/\nu _n = 0.1$ (solid curve). The dash-dotted line marks the power law of
 $-5/3$.

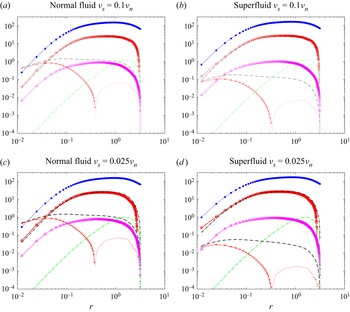
Figure 6 shows terms in the equations for different viscosity ratios. Noticeable is the fact that variations of the density ratio affect only the dissipation source term of the superfluid, i.e. crosses and dashed curve in figure 6(b,d). The inertial terms are the same. We can therefore conclude that the choice of the viscosity ratio has limited influence on the results, as long as the ratio of viscosities is small ( ${<}0.1$) and respects the concept of the HVBK two-fluid model. The same result is supported by our simulations for other values of density ratios.
Terms in the budget equations for the normal fluid (a,c) and for the superfluid (b,d). Simulations are performed for density ratios  $\rho _n/\rho = 0.5$ and for viscosity ratios:
 $\nu _s/\nu _n=0.1$ (a,b) and
 $\nu _s/\nu _n=0.025$ (c,d). All terms are normalized by
 $\varepsilon _*^{5/4}\nu _n^{1/4}$, with
 $\varepsilon _*=7\times 10^{-4}$ the constant energy rate injected to force turbulence for both fluid fractions. We use the same legend as in the main text for different terms in the equations.

For lowest temperatures, the resolution currently used is not sufficient to capture the smallest scales of motion. We recall that the mesh size should be smaller than both the normal fluid Kolmogorov scale  $\eta _n$ and the inter-vortex length of the superfluid. The superfluid also has its Kolmogorov scale
 $\eta _s$ but it should be irrelevant in the framework of the HVBK two-fluid model.
Appendix B. The effect of the resolution on the results
We have performed additional numerical simulations, with a better resolution. Different statistics, such as spectra for a number of grid points  $N=512$ and
 $N=1024$, are depicted in figure 7 for
 $\rho _n/\rho _s = 1$ and
 $\rho _n/\rho _s = 0.1$. For
 $N=1024$, the spectrum is cut off at higher wavenumbers. The additional kinetic energy is, however, negligible.
The spectra for (a)  $\rho _s/\rho _n = 1$ and (b)
 $\rho _s/\rho _n = 10$ for different resolutions:
 $N=512$,
 $k_{max}\eta _n = (N/3)\eta _n=1.816$,
 $k_{max}\eta _s = (N/3)\eta _s=0.4651$ (solid curve) and
 $N=1024$,
 $k_{max}\eta _n = (N/3)\eta _n=3.8105$,
 $k_{max}\eta _s = (N/3)\eta _s=0.9132$ (dashed curve).

The normalized fourth-order structure function (figure 8) tends towards a slightly larger value at the smallest scales, but still within the error bars. Figure 4 depicts values for the flatness of the velocity derivative for two resolutions. While for the normal fluid the results are the same, we notice a slight increase of the flatness of the superfluid at the lowest temperature, from a value of  $5.25$ obtained for
 $N=512$ to a value of
 $6$ for
 $N=1024$.
The normalized ‘fourth’-order structure function, as a function of  $r/\eta _{n,s}$ for normal fluid (blue) and superfluid (red) for (a)
 $\rho _s/\rho _n = 1$ and (b)
 $\rho _s/\rho _n = 10$. Resolutions:
 $N=512$,
 $k_{max}\eta _n = (N/3)\eta _n=1.816$,
 $k_{max}\eta _s = (N/3)\eta _s=0.4651$ (solid curve) and
 $N=1024$,
 $k_{max}\eta _n = (N/3)\eta _n=3.8105$,
 $k_{max}\eta _s = (N/3)\eta _s=0.9132$ (dashed curve).

Appendix C. Effect of considering the full expression of the mutual friction force
We test our claims by considering a generalized expression of the mutual friction force (Henderson & Barenghi Reference Henderson and Barenghi2004):
 \begin{equation} \boldsymbol{F}_{ns} = \frac{B}{2}\frac{\rho_s\rho_n}{\rho}\hat{\boldsymbol{\omega}}_s\times \left[ \boldsymbol{\omega_s} \times (\boldsymbol{v}_n -\boldsymbol{v}_s -\dot{L})\right]+\frac{Bp}{2}\frac{\rho_s\rho_n}{\rho} \boldsymbol{\omega_s} \times (\boldsymbol{v}_n -\boldsymbol{v}_s - \dot{L}), \end{equation}
where  $\hat{\boldsymbol{\omega}}_s$ is the unit vector in the direction of superfluid vorticity,
 $\dot {L}$ is the vortex line velocity due to the oscillation of the vortex wave, expressed as
 \begin{equation} \dot{L} = \frac{\kappa}{4{\rm \pi}}\log(l/a_0) \boldsymbol{\nabla} \times \hat{\boldsymbol{\omega}}_s , \end{equation}
where  $l=\sqrt {\kappa /\boldsymbol {\omega }_s}$ is the inter-vortex length,
 $a_0$ is the vortex core size and
 $\kappa$ is the unit circulation.
In this work, we have made two simplifications. First, we neglected the velocity due to the vortex line oscillation  $\dot {L}$. Because in the limit of high Reynolds numbers,
 $l \rightarrow {O}(a_0)$ implies
 $\dot {L} \rightarrow {O}(\kappa )$. The latter is too small compared with the characteristic velocity of the superfluid to be taken into account.
On the other hand, in the original idea of the mutual friction force proposed by Hall and Vinen, the vortex lines are considered as filaments with no mass, which implies that the inertial effects of the vortex lines are irrelevant. As a matter of fact, based on the concept of the two-fluid model, the superfluid velocity resolved by the NS equations is a space-smoothed value  $\tilde {\boldsymbol {v}}_s$, which is the velocity induced by the vortex line smoothed (or averaged) over a large volume of fluid. In this context,
 $\tilde {\boldsymbol {v}}_s$ is equivalent to
 $\boldsymbol {v}_s + \dot {L}$. The velocity due to the vortex tangle oscillation is not actually neglected, but merged into
 $\tilde {\boldsymbol {v}}_s$.
Although we have ignored  $\dot {L}$ in a simplified scenario, we do not suggest
 $\dot {L}$ should always be neglected. The contribution of
 $\dot {L}$ is interesting to be considered in some situations. For instance, when
 $\boldsymbol {v}_n -\boldsymbol {v}_s = 0$, due to the contribution of
 $\dot {L}$ the mutual friction force is not zero. However, for the present work, we neglect
 $\dot {L}$. The mutual friction force then consists of two components. One is parallel to the relative velocity
 $\boldsymbol {v}_n -\boldsymbol {v}_s$, denoted
 $F_{ns\parallel } = ({B}/{2})({\rho _s\rho _n}/{\rho })\hat {\boldsymbol {\omega }}_s\times [ \boldsymbol {\omega _s} \times (\boldsymbol {v}_n -\boldsymbol {v}_s)]$. The other one is perpendicular to the relative velocity
 $\boldsymbol {v}_n -\boldsymbol {v}_s$, denoted
 $F_{ns\perp } = ({Bp}/{2})({\rho _s\rho _n}/{\rho })\boldsymbol {\omega _s} \times (\boldsymbol {v}_n -\boldsymbol {v}_s)$. The mutual friction force is
 \begin{equation} \boldsymbol{F}_{ns} = \frac{B}{2}\frac{\rho_s\rho_n}{\rho}\hat{\boldsymbol{\omega}}_s\times \left[ \boldsymbol{\omega_s} \times (\boldsymbol{v}_n -\boldsymbol{v}_s)\right]+\frac{Bp}{2}\frac{\rho_s\rho_n}{\rho} \boldsymbol{\omega_s} \times (\boldsymbol{v}_n -\boldsymbol{v}_s), \end{equation}
and with the supposition that  $\boldsymbol {\omega }_s \perp (\boldsymbol {v}_n -\boldsymbol {v}_s)$, it becomes
 \begin{equation} \boldsymbol{F}_{ns\parallel} = \frac{B}{2}\frac{\rho_s\rho_n}{\rho}\hat{\boldsymbol{\omega}}_s\times \left[ \boldsymbol{\omega_s} \times (\boldsymbol{v}_n -\boldsymbol{v}_s)\right] ={-} \frac{B}{2}\frac{\rho_s\rho_n}{\rho}|\boldsymbol{\omega}_s|(\boldsymbol{v}_n -\boldsymbol{v}_s) \end{equation}
and
 \begin{equation} \boldsymbol{F}_{ns\perp} = \frac{Bp}{2}\frac{\rho_s\rho_n}{\rho} \boldsymbol{\omega_s} \times (\boldsymbol{v}_n -\boldsymbol{v}_s). \end{equation}
The second simplification of the present work is to consider only the component  $F_{ns\parallel }$, basically because
 $F_{ns\perp }$ is considered as being non-dissipative and represents a Magnus effect associated with quantized vortices (Roche et al. Reference Roche, Barenghi and Lévêque2009). It signifies that
 $F_{ns\parallel }$ is responsible for the energy exchange between the two components, while
 $F_{ns\perp }$ does not contribute much to the energy exchange between the two fluids.
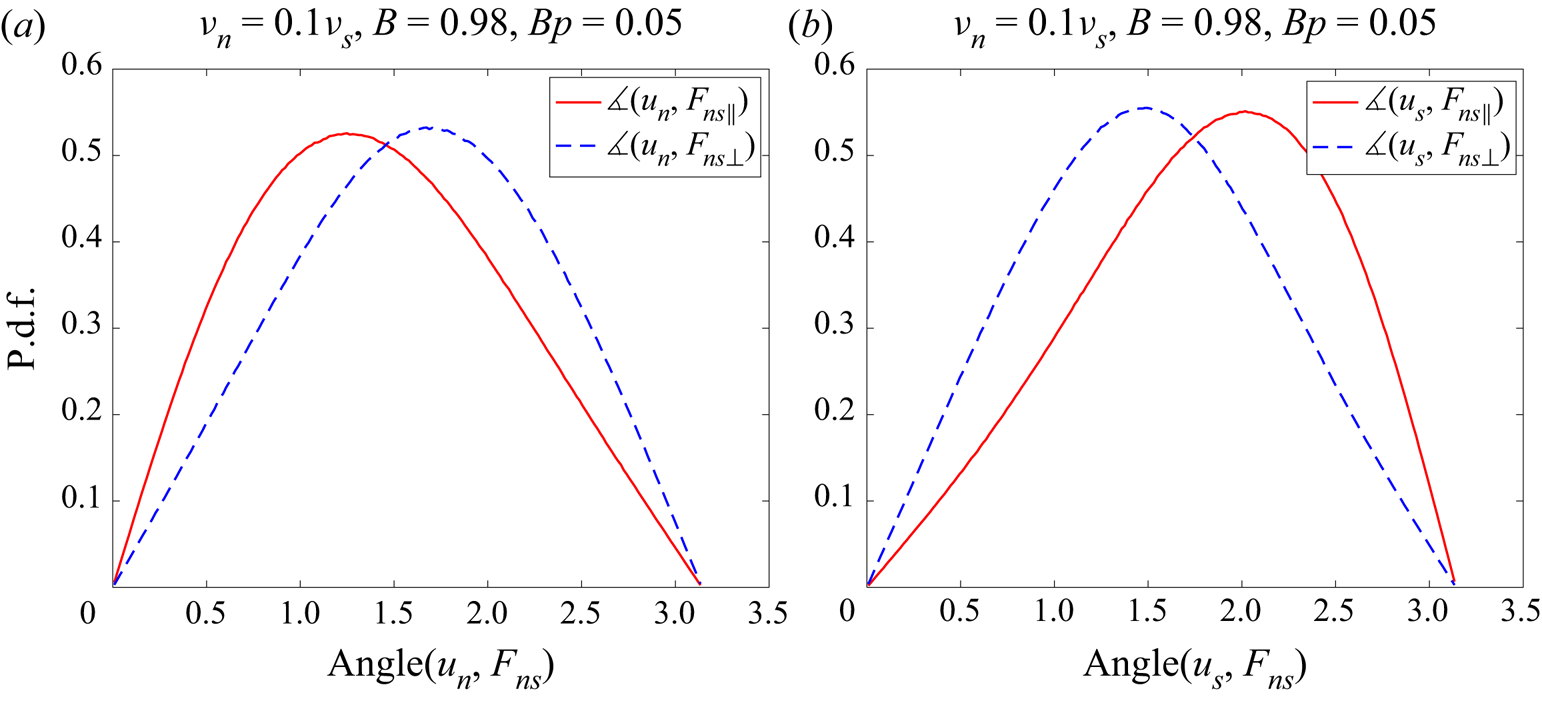
A first validation of our considerations is backed by the statistics of the angle made by  $\boldsymbol {u}_n$ and
 $F_{ns}$. Figure 9 depicts the p.d.f. of the angle made by the velocity vector and different components of the force
 $F_{ns\perp }$ and
 $F_{ns\parallel }$, for the normal fluid (figure 9a) and the superfluid (figure 9b). The p.d.f. of
 $\measuredangle (\boldsymbol {u}_n, F_{ns\parallel })$ is skewed towards values of the angle between
 $(0,{\rm \pi} /2)$. This signifies that
 $\boldsymbol {u}_n$ is preferably aligned with
 $F_{ns\parallel }$. Therefore,
 $F_{ns\parallel }$ injects energy to the normal fluid. The p.d.f. of
 $\measuredangle (\boldsymbol {u}_n, F_{ns\perp })$ is almost symmetric about the value of
 ${\rm \pi} /2$. This signifies that
 $F_{ns\perp }$ does not inject energy to the normal fluid. The same qualitative observation holds for the p.d.f. of
 $\measuredangle (\boldsymbol {u}_s, F_{ns})$. The parallel component
 $F_{ns\parallel }$ extracts energy from the superfluid and
 $F_{ns\perp }$ does not affect, on average, the superfluid. These are arguments that serve as a basis in neglecting
 $F_{ns\perp }$.
The p.d.f. of angle between the velocity and different friction force components for normal fluid (a) and superfluid (b).

Furthermore, the temperature-related coefficient  $B$ is generally larger than
 $Bp$. For example, for
 $T=1.95\ \textrm {K}$,
 $B=0.98$ and
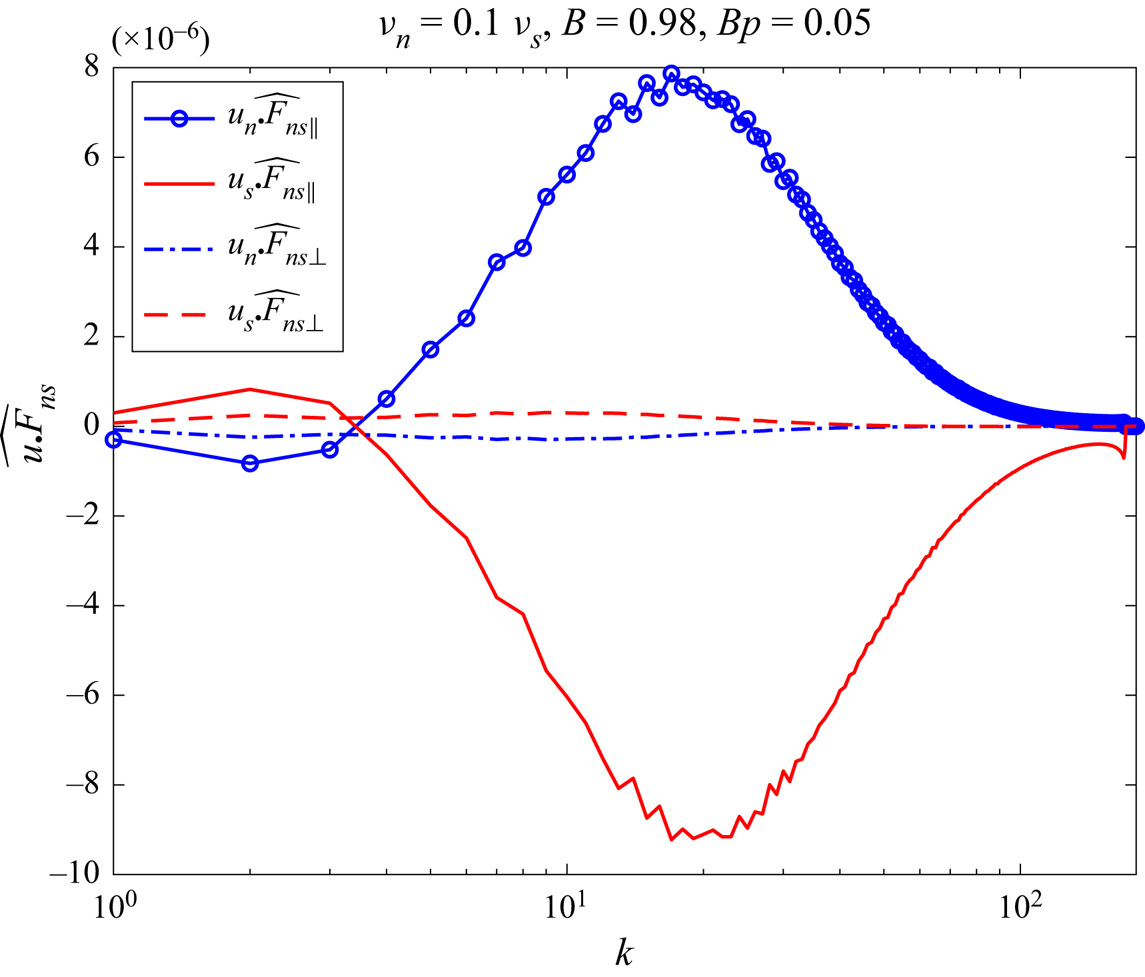
 $Bp=0.05$. The spectrum of
 $\boldsymbol {u}_{n,s}F_{ns\perp }$ is negligible compared to that of
 $\boldsymbol {u}_{n,s}F_{ns\parallel }$ (see figure 10). This is an additional reason for considering the simplified form of the mutual friction force, as provided by (C4), and considered in the present work.
The spectra of  $\boldsymbol {u}_{n}F_{ns\parallel }$ (open circles),
 $\boldsymbol {u}_{s}F_{ns\parallel }$ (solid curve),
 $\boldsymbol {u}_{n}F_{ns\perp }$ (dot-dashed curve) and
 $\boldsymbol {u}_{s}F_{ns\perp }$ (dashed curve).

The scale-by-scale transport equation for the third-order structure function is not affected by the consideration of the complete expression of the friction force, (C3). Additional numerical studies considering the full expression of vortex oscillations will be performed in the future.