


INTRODUCTION
The Belt and Road Initiative (BRI) was proposed in 2013 by President Xi Jinping as the key national strategy to strengthen economic integration and cooperation between China and countries in Asia, Europe, and Africa on a transcontinental scale. The BRI involves two major directions: the Silk Road Economic Belt, which focuses on land connectivity; and the Twenty-First Century Maritime Silk Road, which focuses on sea routes.Footnote 1 According to the World Bank (2019), should the BRI be fully implemented, it will increase global trade between 1.7 and 6.2 percent, and increase global real income by 0.7 to 2.9 percent.
In the meantime, the ambitious Chinese strategy has generated countless critiques and counteractions in other countries. Among them, environmental concerns have been salient, as China's outward investment is argued to severely increase pollution outside China. There are two reasons for such environmental concerns. First, China has faced mounting pressure to reduce pollution within its borders and alleviate overcapacity issues in pollution-intensive industries. Hence, it could be the case that its outward investment likely reflects an intent to relocate pollution-intensive industries to less-developed countries. This expectation is consistent with the Pollution Haven Hypothesis (Al-Aameri et al. Reference Al-Aameri, Fu, Garcia, Mak, McGill, Reynolds and Vinze2012; Cai et al. Reference Cai, Che, Zhu, Zhao and Xie2018). Second, Chinese investors generally follow a lower threshold of social and environmental standards than their Western counterparts, and such standards may carry over to the activities being implemented in the countries that receive the Chinese investment, as discussed by Chin and Gallagher (Reference Chin and Gallagher2019) and Ray et al. (Reference Ray, Gallagher, López and Sanborn2017). Some of these concerns and comments are shared by others in discussing the environmental and resource impacts of the BRI (Ascensão et al. Reference Ascensão, Fahrig, Clevenger, Corlett, Jaeger, Laurance and Pereira2018; Hafeez et al. Reference Hafeez, Chunhui, Strohmaier, Ahmed and Jie2018; Tracy et al. Reference Tracy, Shvarts, Simonov and Babenko2017).
This article has two tasks. First, we focus on the third “block” of the Chinese state, as spelled out in Min Ye's article in this issue, and investigate the logic and behavior of China's pollution-intensive industries (PIIs) during the BRI implementation. We argue that, while the political leadership launched the BRI in Beijing, it is local governments and business actors that ultimately interpret and implement the BRI. In doing so, their implementation has been carried out in line with their own interests, opportunities, and constraints, both inside and outside of China. It is such localized implementation that determines the actual economic and environmental impacts of the BRI. In our model, local governments and businesses view the launch of the BRI as an opportunity to expand their overseas market to maintain excess domestic production capacity. Many of these industries that have reached excess production capacity in China are pollution intensive, so their interpretation of the BRI is likely to aggravate China's environmental woes.
Second, we conduct an analysis of several large-scale economic and environmental databases, including China's Customs Statistical Yearbook 2010–2016, Wind Economic Database, the BRI Industrial Platform, the Eora Global Supply Chain Database, and the Chinese National Statistical Yearbook. Our empirical findings largely aligned with our hypotheses based on the domestic political economy, as explained above. China's outward investment after the launch of the BRI has not featured PIIs strongly. Rather, the exports of PIIs have increased rapidly since the BRI, and the increase in China's exports of overcapacity PIIs have accounted for most of the growth in trade between China and the BRI countries. Given this empirical pattern, the true risk of increased pollution under the BRI lies within China, rather than abroad.
The rest of the article proceeds as follows. In the next section, building on Min Ye's tri-block state framework, we explain the factors that drive localized implementation of the BRI. The following two sections analyze the new patterns of industrial activities after implementation of the BRI. These new patterns confirm that local governments and businesses have interpreted and implemented the BRI to serve their immediate economic priorities. We then calculate the environmental and resource impacts under the BRI. Finally, we conclude the article with a summary of key findings and a discussion of future research.
THE FRAMEWORK: LOCALIZED IMPLEMENTATION
Min Ye's article in this issue describes how policymaking in China has been conducted by the political leadership in responding to external and internal pressures. After the leader announces an ambitious and ambivalent national policy, it is followed by top-down mobilization and bottom-up fragmentation, ending with feedback to readjust the policy. In Ye's tri-block state framework, the central government's top-down approach to policymaking can be powerful and effective in terms of mobilizing local behaviors because Beijing has concentrated power in making economic, social, and budgetary decisions across the country (Blanchard Reference Blanchard2015). However, the high aggregation of multiple goals and interests in the central government also offers a great deal of discretionary power to local governments during implementation. Local governments often interpret a top-down policy in line with their own interests, some of which do not necessarily align with the motivations behind the policy in Beijing. For example, as explained by Cai et al. (Reference Cai, Chen and Gong2016), when the central government pressured local governments to curb river pollution, the growth-minded provincial governments merely allocated their enforcement efforts to the upstream counties and ignored the downstream counties. Their strategic responses transferred pollution to their neighboring provinces, and therefore counteracted the central government's initial goal.
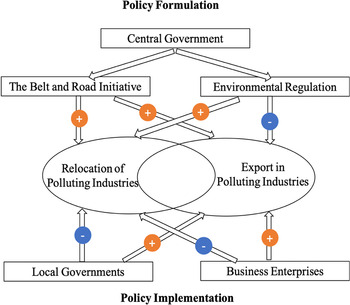
The logic of our model starts when the central government proposes the BRI as a response to several domestic and international factors. Local governments then interpret and implement the initiative considering both their own interests and other concurrent national policies. Because our focus is on the environmental impacts of the BRI, the “concurrent national policy” that we particularly need to consider is the increasingly tightened environmental regulations from the central government, as shown in Figure 1.
The local policy framework

Ye's article in the special issue has elaborated upon the ambitious and ambivalent nature of the central government's rhetoric with regards to the BRI. The model in our article focuses on local governments and business enterprises, and investigates factors that may shape their response. For local governments, two factors are important. The first is to maintain rapid economic growth, which has been a long-term priority for local governments. This is institutionalized by China's personnel control system. As Li and Zhou (Reference Li and Zhou2005) found, economic performance during local government officials’ tenures is the key determining factor for their promotion and termination. Therefore, the personnel control system in China creates a strong political incentive for local officials to compete with each other on economic performance. Even after many years of rapid economic growth, many local governments still view economic development as the top priority, compared with other policy goals. For instance, the Minister of Ecology and Environment, Ganjie Li, complained in his 2020 address that, “Many local governments still emphasize development and neglect environmental protection. As a result, the energy intensive industries expanded significantly in 2019 as the local government attempt to contract economic slowdown with lax enforcement of environmental regulations.”Footnote 2 Undoubtedly, local governments view the BRI as an opportunity to grow the local economy. This is particularly important considering the slowdown of China's economy in recent years.
The second factor considered in local governments’ implementation of the BRI is the need to ensure local environmental protection. In recent years, the importance of environmental protection has reached an unprecedented level. The 18th National Congress of the Chinese Communist Party (CPC) in 2012 added ecological civilization as one of the central causes for socialistic development, along with political, economic, cultural, and social civilization. On many occasions, including in the report of the 19th National Congress of the CPC, Chairman Xi Jinping has stated his view that “clear water and green mountains are as good as mountains of gold and silver.” Policy wise, the Environmental Protection Law of China was amended in 2014, imposing much heavier penalties for environmental violations. In 2015, the Central Environmental Protection Inspection was established, in which the central government sent inspection teams to local governments, collecting environmental complaints and compelling local enforcement of environmental regulations. All these factors placed pressure on local governments to strive for a cleaner environment. However, in most cases the goal of environmental protection did not always remain aligned with the goal of economic prosperity. For instance, Chen et al. (Reference Chen, Li and Lu2018) found that in efforts to reduce SO2 emissions, local governments had to sacrifice GDP growth for environmental benefits. Local governments have to make a choice when the two goals conflict.
In Figure 1, in addition to the central government and local governments, the third group of key players consists of businesses. We are particularly concerned with pollution-intensive industries, given our environmental focus. At the time the BRI was initiated, most pollution-intensive industries in China were suffering from excess production capacity—indeed, overcapacity has been a significant challenge for China's economy since the late 1990s. Scholars have offered two primary explanations. First, capital tends to flow into the most lucrative industries, resulting in vicious competition, excess supply, and therefore low profits (Lin et al. Reference Lin, Wu and Xing2010). Between 1999 and 2003, steel, cement, and other building materials were in high demand because of the rapid expansion of infrastructure and real estate development in China. The increasing prices of commodities, such as aluminum and copper, attracted a high level of investment. However, when real estate and infrastructure development slowed down, demand dropped, production fell, and factories became idle.
Second, due to fiscal decentralization, local governments competitively encouraged investment, leading to overlapping projects and overproduction (Zhou Reference Zhou2007). Together with the incentives built into the personnel control system, fiscal decentralization prompted local governments to attract investment by offering various preferential policies and protecting the local market. The duplicate development projects resulted in a large stock of production capacity that exceeded demand (Jiang et al. Reference Jiang, Geng, Lv and Li2012). Furthermore, to cope with the employment pressure caused by urbanization, local governments lent more financial and land support to businesses, eventually exacerbating the overcapacity issue (Liu and Sun Reference Liu and Sun2014).
The BRI clearly opened a new market for industries with excess production capacity. Some scholars argued that forging new markets as a way to address excess production capacity in China was a primary driver for initiating the BRI (Chen Reference Chen2018). Additionally, the BRI also served as an opportunity for capital in industries with excess production capacity to flow to BRI countries. In other words, businesses could take advantage of the BRI to either produce more domestically and then export to the BRI countries; or relocate to the BRI countries as a form of foreign direct investment and then sell back to China.
The strategy that would dominate depended on which aligned most directly with the interests of businesses and local governments. The relevance of this strategic choice to environmental concerns stems from the fact that industries with excess production capacity happen to be pollution intensive (to be discussed in detail later). The export strategy is ideal for businesses, since it helps to avoid the cost of relocation. The strategy also serves local governments’ interest in maintaining economic prosperity, though it could be detrimental to the goal of environmental protection. The relocation strategy supports the goal of local environmental protection, but is not preferable for businesses because of the relocation costs, and does not suit local governments because of the negative impacts on local GDP.
Given these considerations, the environmental impact of the BRI depends on the balancing of the different interests of local governments and businesses, and is ultimately an empirical matter. Consideration of environmental protection was not stated by the central government in its formulation of the BRI. Thus, the environmental impacts that resulted were not a centrally designed outcome, but rather a result of fragmented implementation. In the next two sections, we provide data analysis to demonstrate how domestic political-economic factors drove the implementation and outcomes of the BRI, with a focus on China's pollution-intensive industries and the ensuing environmental impacts.
RELOCATION OF POLLUTION-INTENSIVE INDUSTRIES TO THE BRI COUNTRIES?
The BRI facilitates investment in the BRI countries. In fact, the existing environmental concerns with the BRI are related mainly to China's increasing overseas investment, as pointed out in Kong and Gallagher's article in this issue.
This concern is theoretically consistent with the Pollution Haven Hypothesis (PHH): that developed countries shift their pollution-intensive production to developing countries to avoid the increasing costs of complying with more stringent environmental regulations, while developing countries may have the incentive to lower their environmental standards in order to attract more foreign investment and thus become havens for pollution (Walter Reference Walter, Rubin and Graham1982). According to the PHH, firms in polluting industries can redesign their supply chains and shift their domestic production to cleaner segments, then import products that are more pollution intensive to produce from poor or low-wage countries (Li and Zhou, Reference Li and Zhou2017).
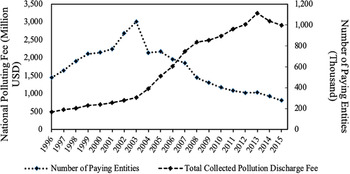
As discussed in Section 2, the urgency in relieving China's environmental woes has led to more stringent enforcement of environmental regulations, and has therefore driven up the costs faced by firms face in maintaining compliance with stricter environmental regulations. For instance, as demonstrated in Figure 2, the total pollution discharge fee increased from $700 million in 2000 to $2,905 million in 2015, even though the number of entities paying discharge fees decreased significantly. The cost was expected to further increase after the environmental tax reform that took place in 2018.
Total pollution discharge fee, 1996–2015
Data from: Environment Statistical Yearbook (1997–2016).

Furthermore, the increased cost of complying with environmental regulations was only one of many impacts of China's efforts to strengthen the protection of the environment. China's new environmental law, which came into effect in 2014, increased the penalty for environmental infractions, resulting in everything from hefty fines to jail time for the more egregious violators. In 2016, the central government also initiated the Central Environmental Protection Inspection (CEPI), which was intended to enhance environmental enforcement at the local level. It is estimated that 40 percent of all China's factories have been shut down at some point by their local governments as part of the CEPI. Over 80,000 factories have been fined and charged with criminal offenses for environmental violations.Footnote 3
Another factor that propels relocation is the increase in labor costs. Abundant labor supply and low labor costs have been widely cited as one of the most important factors that contribute to China's economic miracle. However, this competitive advantage is vanishing. In 2015, the national average employee salary in China reached 62,000 CNY (around $8,857 in 2020)—about 54 times as high as the level in 1985.Footnote 4 Shen and Xiao (Reference Shen and Xiao2014) suggest that the BRI could encourage labor-intensive industries to move to the BRI countries through overseas investment.
With the BRI opening new venues and providing supporting policies for foreign investment, business enterprises have the motivation to relocate to the BRI countries to avoid increased environmental and labor costs. If this is a popular strategy, we would observe that business enterprises—particularly those in pollution-intensive industries—would relocate to the BRI countries, produce abroad and ship their products back to China. This is exactly what had happened in the United States and other advanced economies. Li and Zhou (Reference Li and Zhou2017) found that US plants produce less waste when their parent imports more from low-wage countries (LWCs), and goods imported by US firms from LWCs are in more polluting industries. If this is the case, we would observe that after the BRI, China's imports from the BRI countries would increase more than otherwise, providing indirect evidence of PHH.
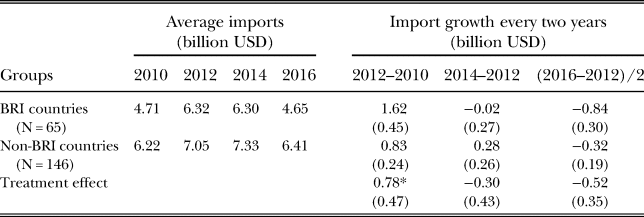
To empirically test this hypothesis, we compare the import changes in BRI countries after the BRI with those in the non-BRI countries. We ask whether China has imported more from the BRI countries since the BRI, compared with the non-BRI countries. Furthermore, we ask this question industry by industry, and observe whether the imports increase more in pollution-intensive industries. We obtained the trade data from China's Customs Statistical Yearbooks for 2010, 2012, 2014 and 2016.Footnote 5 The list of BRI countries is collected from the Belt and Road Portal.Footnote 6
Table 1 reports the results at an aggregate level. It shows that China's imports from the BRI countries grew by $1.62 billion in the period 2011–2012 before the BRI; however, after the BRI imports from the BRI countries declined by US$0.84 billion from 2013 to 2016. This trend is similar between the BRI and non-BRI countries, and imports from the BRI countries seem to have declined to a larger extent. The statistical analysis does not show any sign of significance, telling us that China's import growths from the BRI and non-BRI countries do not differ significantly from each other.
Two-yearly import growth: BRI countries vs. non-BRI countries

Note: The T-test is used to compare the import growth of the BRI and non-BRI countries. All tests are two-tailed. Robust standard errors are in the parentheses. *p < 0.10, **p < 0.05, ***p < 0.01. We eliminate the impact of inflation using a consumer price index from CSMAR because the trade volume is measured at current year prices. All values are at the 2010 price.
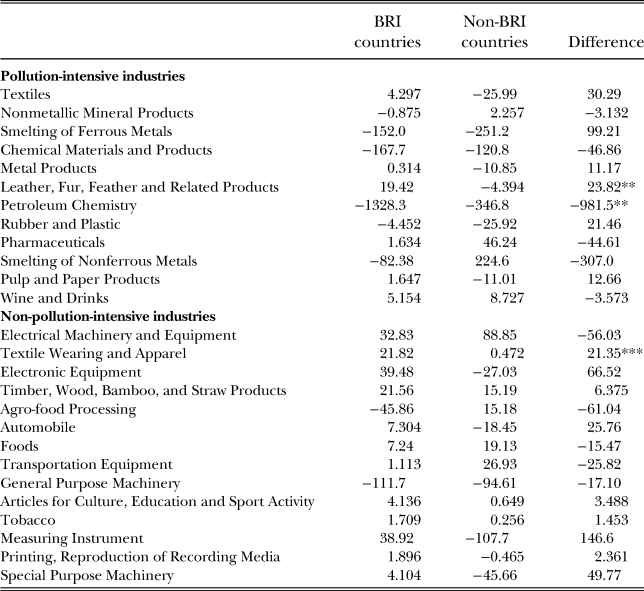
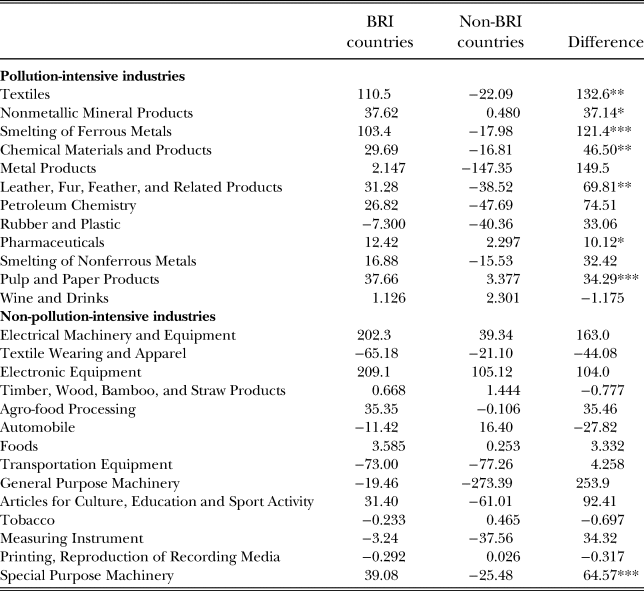
We further repeat this analysis industry by industry, and investigate whether China imported more goods produced by pollution-intensive industries after the BRI, compared with industries that did not create significant pollution, as Li and Zhou (Reference Li and Zhou2017) suggest. Table 2 demonstrates China's import growth from 2013 to 2016 from both BRI and non-BRI countries, as well as the differences between them, by industry. It is clear that among the 12 pollution-intensive industries, only one—the leather, fur and related products industry—witnessed a more rapid growth of imports from the BRI countries, after implementation of the BRI, compared with the non-BRI countries.Footnote 7 For the pollution-intensive petroleum chemistry industry, imports from the BRI countries declined dramatically. Thus, these findings do not support the hypothesis that pollution-intensive industries relocate their factories to the BRI countries.
Average two-year import growth (2012–2016) in different industries: BRI countries vs. non-BRI countries (million USD)

Note: The T-test is used to compare the import growth of the BRI and non-BRI countries. All tests are two-tailed. *p < 0.10, **p < 0.05, ***p < 0.01.
What about the BRI's long-term impacts on the environment, assuming it takes many years for production relocation and growth in imports adequate for domestic needs to be implemented? This is a possibility, but not very likely, as industrial restructuring and new energy technology may phase out a large part of polluting industries. Furthermore, being more conscious of environmental standards, the recipients are likely to limit the prospect of such relocation.
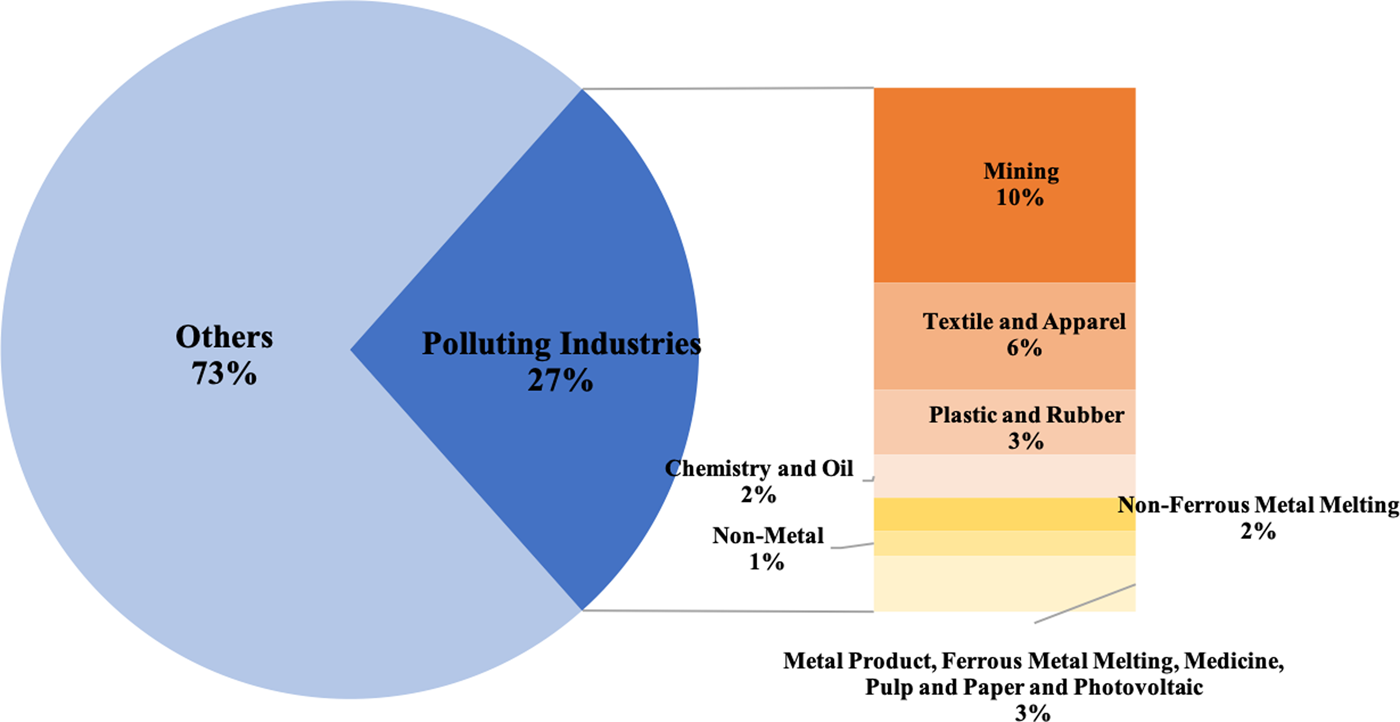
Figure 3 identifies all of China's investment projects as of 2020, in member countries of the Association of Southeast Asian Nations (ASEAN), which is the primary destination for China's outward investment and accounts for about 58 percent of China's outward investment to the BRI countries.Footnote 8 As seen in Figure 3, as of 2020, only 27 percent of the total Chinese projects in ASEAN countries involved pollution-intensive industries. Of the total number of domestic pollution-intensive manufacturing industries in China, the proportion of firms that directed outward investment to ASEAN countries was just 0.6 percent. In short, after seven years and in the closest and largest investment destination, very few Chinese producers in pollution-intensive industries have relocated manufacturing there.
China's investment projects, 2020

Further, what about the concern that pollution-intensive industries in the BRI may have grown with China's investment but the output primarily supplies domestic markets and non-China foreign markets? If this is the case, the trade patterns would not reflect the change in the investment patterns. To check this possibility, we look at the Chinese investment in several concerning industries and find that the overall investment patterns of Chinese capital in the BRI countries have not changed much since the BRI (Du and Zhang Reference Du and Zhang2018). The energy and power industry still occupied the top position in the list of Chinese industries with the highest outward capital investment; however, the high-technology and financial industries entered the top five list in 2014–2015, occupying the third and the fourth positions, respectively. In short, the data show that the rise in China's investment in the BRI countries took place in industries that were not pollution intensive.
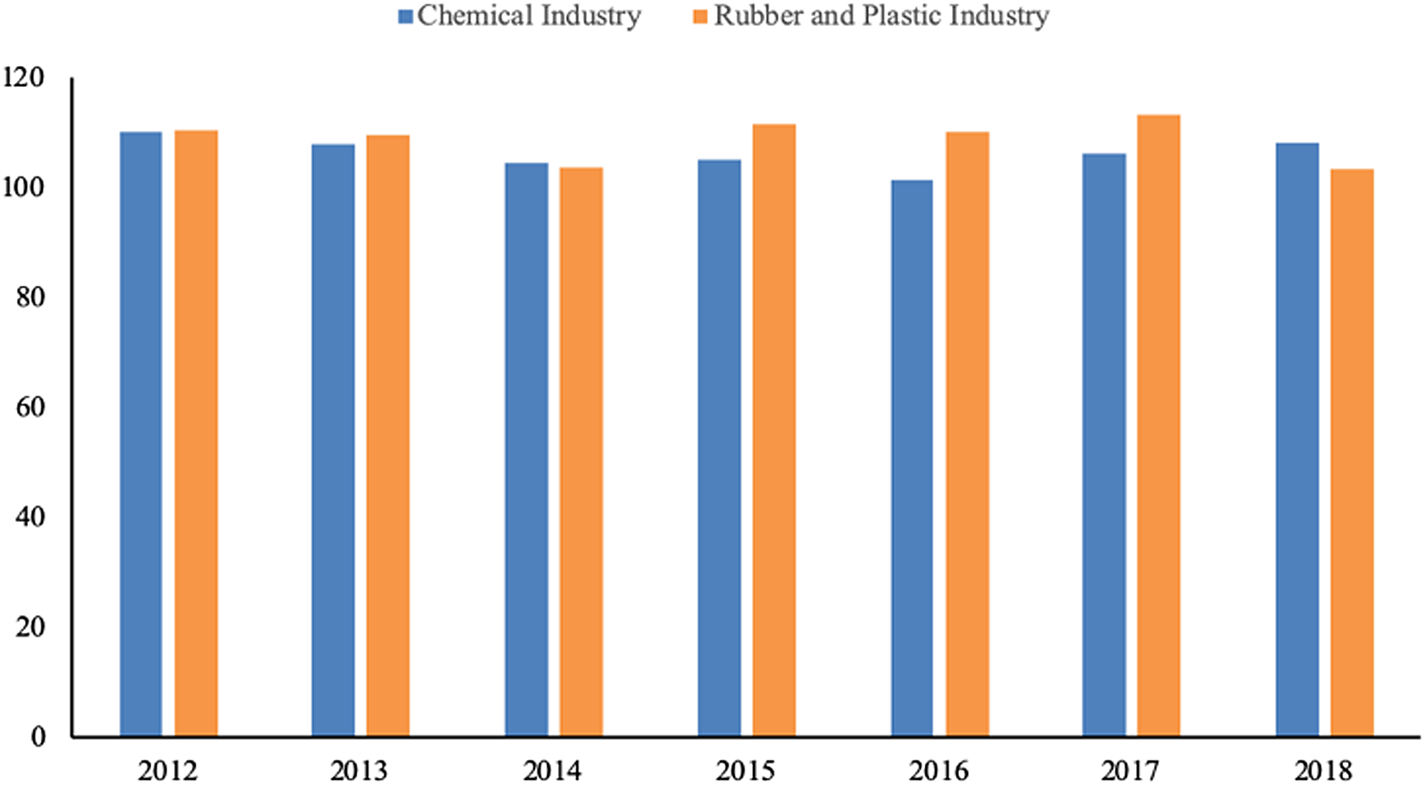
Figure 4 shows production index data from Vietnam, an important destination for Chinese FDI, and provides no evidence for increased investment in pollution-intensive industries under the BRI. The production of chemical, and rubber and plastics products in Vietnam has been stagnant from 2012 to 2018, showing no support for PHH.
Production index data from Vietnam
Data from: Statista, www.statista.com/statistics/910746/vietnam-industrial-production-index-chemicals-and-chemical-products

As discussed earlier, the pressure from increased environmental and labor costs provides strong incentives for business enterprises—particularly those in pollution-intensive industries—to relocate. However, the empirical data do not provide supporting evidence. Several reasons, rooted in our domestic and process-centered framework, could explain the business hesitation in relocation. First, local governments tend to discourage relocation. As discussed earlier, economic performance is the key determining factor for the promotion of local officials. These officials are therefore less likely to encourage the outflow of investment, as this would likely damage the local economy, reduce the fiscal revenue and hurt their position in the political promotion. Instead, despite the tightening of environmental regulations from the central government, local governments are inclined to urge pollution-intensive industries to improve their environmental standards as methods of enforcement, as long as their actions are not opposed to the national strategy (Donaldson Reference Donaldson2016; Huang and Xia Reference Huang and Xia2016; Woods Reference Woods2006).
Second, pollution-intensive businesses—particularly private businesses—do not have strong incentives to relocate. The BRI facilitates the regional movement of goods, as much as the movement of capital. Compared to the strategy of “production and export,” the strategy of “relocation and production” is relatively more costly. Furthermore, pollution-intensive businesses must consider the interests of local officials who directly impact them (Du and Wang Reference Du, Wang and Zhang2013; Kung and Ma Reference Kung and Ma2018). Overseas investment also introduces more risks for firms that seek to relocate. As Shi and Siem's article in this issue establishes, such firms would face the “reputation deficit” and the vulnerability of cooperation abroad. Political risks add to the costs of investments under the BRI. As an example, Malaysian Prime Minister Mahathir Mohamad voiced concerns in 2018 over China's increased influence and suspended $40 billion worth of Chinese infrastructure projects pending further review. Additionally, some BRI countries are politically unstable, and the risks of war and violence pose unaffordable costs for Chinese investors.
In summary, in recent years China has quickly increased its environmental standards and tightened regulation on polluting industries. In the meantime, the BRI has urged the Chinese industry to go global. According to the PHH, it is expected that the relocation of Chinese pollution-intensive industries to the BRI countries will increase, with products imported back to China for domestic consumption. The empirical data do not support the PHH, and investment patterns in such industries have not changed, nor have the imports of pollution-intensive goods.
There are two reasons rooted in the fragmented state system: first, local governments have incentives to keep pollution-intensive industries in their localities, and the BRI enabled them to keep the industry while downplaying the environmental regulation; second, the local business finds relocation to overseas markets costly and risky because of critical perception of Chinese capital in the recipient states. Their rational choice is to maintain production locally while exporting finished goods to the BRI countries.
EXPANSION OF EXPORTS IN POLLUTION-INTENSIVE INDUSTRIES?
Aside from serving as a channel for the outward flow of capital, the BRI also offers opportunities for Chinese exporters, given the large economies and populations of the BRI area. It is estimated that the BRI regions encompass more than 60 emerging market economies, with a total population of over four billion. Furthermore, these economies produce approximately $21 trillion in output, which accounts for 65 percent and 30 percent of the global totals of land-based and maritime-based economic production, respectively (Swaine Reference Swaine2015).
The BRI facilitates international trade through two channels: trade facilitation and infrastructure connectivity. First, the BRI aims to encourage economic, political, and cultural communication between China and the BRI countries. China had signed 17 free trade agreements involving 25 countries or districts by October 2019.Footnote 9 Second, the BRI helps to create more favorable environments for trade by developing better transportation networks – for example, ports, roads, airports, and railways. For one thing, this will eliminate physical trade barriers among the BRI countries and significantly reduce the logistical costs of trade among the countries. Additionally, China will enjoy a higher level of independence in trade, with access to new markets and trade routes (Enderwick Reference Enderwick2018). At present, 80 percent of China's trade routes, and their key chokepoints, are controlled by other nations (Stratfor 2015). As many have observed, the improvement of infrastructure in target markets would enhance the volume of trade in those markets (Francois and Manchin Reference Francois and Manchin2013; Portugal-Perez and Wilson Reference Portugal-Perez and Wilson2010).
This opportunity for increased trade is welcomed by pollution-intensive industries, which suffer from excess production capacity. According to the Development Research Center of the State Council, capacity utilization in China was only slightly over 70 percent in industries such as steel, coal, cement, glass, and electrolytic aluminum in 2012, and fell to around 65 percent at the end of 2015 (Zhao et al. Reference Zhao, Xu, Yuan and Liao2015). In other words, overcapacity in these pollution-intensive industries was as high as 35 percent in 2015. Given the negative effect of overcapacity on economic development, dealing with excess production capacity was ranked the first among China's five missions to boost its economy at the Central Economic Work Conference held in December 2015. Export clearly helps alleviate such excess supply.
As discussed in Kong and Gallagher's article in this issue, the BRI reflects the specific intentions of policymakers and enforcers to boost exports. In its Guiding Opinions on Promotion of International Production Capacity and Equipment Manufacturing Cooperation issued in May 2015 (State Council of the People's Republic of China 2015), “the State Council called on the country's financial institutions, especially its policy banks, to facilitate the export of industries, especially in the 13 sectors designated as pertinent to production capacity and equipment manufacturing, which largely overlap with the sectors the State Council views as suffering from excess capacity” (Kong and Gallagher, this issue). That is, the BRI has intentionally been used as a tool to encourage exports in industrial sectors that are struggling with excess production capacity. In Ye's article in this issue, the predominant domestic drivers for the launch and implementation of the BRI were overcapacity and the potential for job loss in China. Chen (Reference Chen2018) likewise argued that one of the key drivers for the BRI was to find new markets for China's excessive production capacity. From these points of view, the BRI was promoted by Beijing to address the overcapacity issue in the economy.
We should emphasize that this “production and export” strategy is well aligned with the interests of local governments and pollution-intensive enterprises. First, the production remains in China, continuing to serve the goal of creating job opportunities and sustaining the local economy. Local government officials welcome this idea because a successful local economy helps them in their performance evaluation and political promotion. Second, pollution-intensive industries with excess production capacity find overseas markets to which to expand their production and thereby create more profits. Compared with sustaining economic development and job opportunities, environmental protection is still a secondary consideration, at least for local governments. There is evidence in China's recent economic downturn. In 2018, the goal for the reduction of PM 2.5 concentrations in the Jing–Jin–Ji (Beijing–Tianjin–Hebei province) region was set at 3 percent, a sharp drop from 18 percent in 2017. As mentioned earlier, in his 2020 address, Ganjie Li, the Minister of Ecology and Environment of China, bemoaned that some local governments relaxed their enforcement of environmental regulations under the pressure of an economic downturn, resulting in a new round of expansion in pollution-intensive industries.
In an effort to observe the BRI's impact on China's export patterns, we calculated China's export growth from 2013 to 2016 in both BRI countries and non-BRI countries, as well as the differences between them, industry by industry. The results are reported in Table 3 and reveal that China's exports to the BRI countries increased significantly faster than exports to the non-BRI countries in eight industries—namely, the textile, nonmetallic mineral products, smelting of ferrous metals, chemical materials and products, leather, fur, feather and related products, pharmaceuticals, pulp and paper products, and special-purpose machinery industries.
Average two-year export growth (2012–2016) in different industries: BRI countries vs. non-BRI countries (million USD)

Note: The T-test is used to compare the export growth of the BRI and non-BRI countries. All tests are two-tailed. *p < 0.10, **p < 0.05, ***p < 0.01.
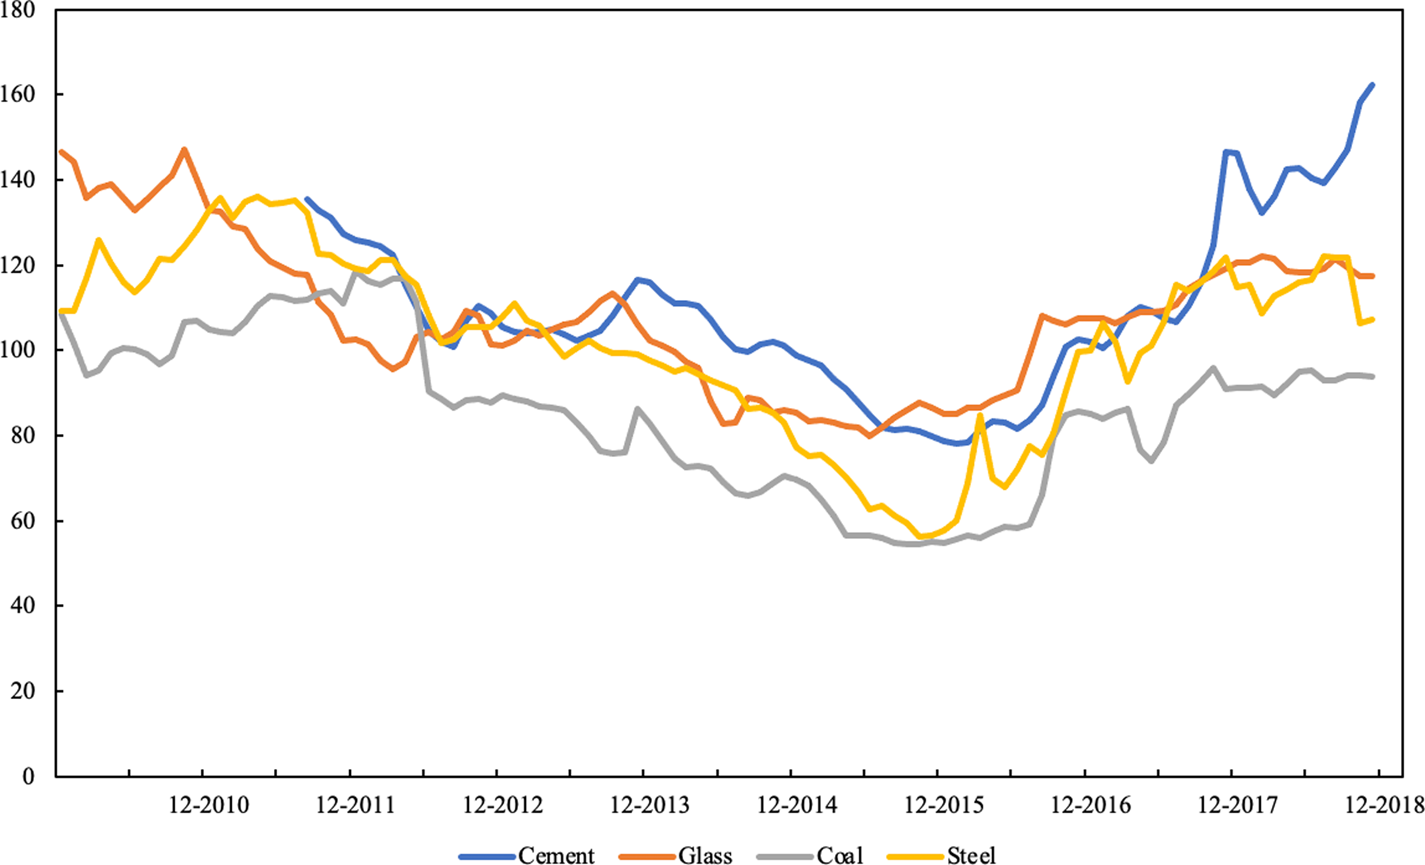
According to Shen and Chen (Reference Shen and Chen2017), manufacturing industries can be divided into two types—overcapacity and non-overcapacity—based on the rate of capacity utilization in each industry.Footnote 10 Among the 12 industries with overcapacity, six have exported more to the BRI countries after the launch compared with non-BRI countries. In contrast, for the 14 industries with no significant overcapacity issue, only two experienced a growth in exports after the BRI. These industries benefited from export growth. Figure 5 plots the price index of steel, coal, glass, cement and aluminum, which have been identified with significant excess production capacity (Zhao et al. Reference Zhao, Xu, Yuan and Liao2015). As can be seen, the prices hit the bottom around the end of 2014 when the BRI began, then rebounded following the BRI, suggesting that excess supply fell due to the expansion of overseas demand. The increase in the price index of these industries with overcapacity implies that they have benefited from the BRI.
Price index of steel, coal, glass, cement and aluminum
Data from: Wind Economic Database.

Our findings suggest that industries with overcapacity saw the BRI as an opportunity to expand to new markets, resulting in increased exports. This is highly consistent with articles by Ye, Kong and Gallagher in this special issue, and Chen (Reference Chen2018). All this research has argued that China's globalization and its patterns are shaped by domestic economic factors.
This article goes one step further, even when local governments and companies are motivated for localized economic interest, they have options to relocate production or export of pollution-intensive products. The BRI has allowed the localities to choose the more expedient means of implementation that can best serve their own interest. The autonomy Chinese actors have, in the actual implementation of the BRI, resulted in environmental outcomes that cannot be easily captured by theories developed in another context, such as the PHH. We have to study localized projects and business choices to pin down the actual costs to China's and global environment in the backdrop of BRI.
CALCULATING THE ENVIRONMENTAL COSTS
The central task of this article is to investigate how local governments and businesses choose to implement the BRI and what are the environmental implications of their choices. We argued earlier that firms in pollution-intensive industries—particularly those with overcapacity—may strategically respond to the BRI in two different ways: (1) by relocating to the BRI countries and creating environmental concerns in the latter; and (2) by expanding exports to the BRI countries and aggravating environmental woes in China. The response that dominates depends on how local governments and business enterprises interpret and implement the BRI in ways that are tailored to their own interests. The analyses later in the article show strong empirical evidence supporting the “produce and export” hypothesis and little evidence for the “relocation” hypothesis.
We devote this section to analyzing the added environmental burdens that come with the BRI, in hopes of shedding light on the pollutants and industries that are of most concern. Table 3 splits the manufacturing sector into two categories: pollution-intensive industries and non-pollution-intensive industries. It is clear that among the eight industries that experienced significantly faster growth of exports to BRI countries compared to non-BRI countries, seven are pollution-intensive industries, and only one is non-pollution-intensive. These observations support the notion that pollution-intensive industries have responded to the BRI by expanding their exports to the BRI countries. It is also evident that export growth leads to concerns that globalization under the BRI may create an environmental burden for China, rather than for the less developed BRI countries.
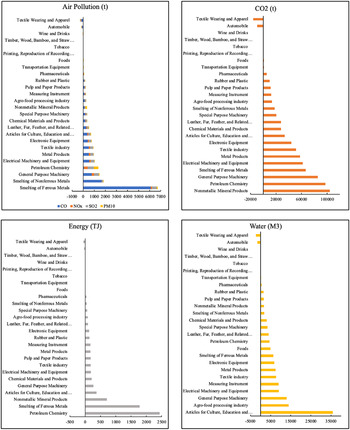
We further calculate the embedded pollution and resource consumption from the increased exports due to the BRI. First, following Tian et al. (Reference Tian, Hu, Yin, Geng and Bleischwitz2019), we computed the average intensities of air pollution, CO2 emissions, energy and water consumption for each industry.Footnote 11 Second, we multiplied the net change in China's export to the BRI countries reported in section 4 by the average intensity for each industry. Figure 6 reports the results from these calculations. And the environmental costs are staggering.
Embedded pollution and resource consumption from the increased exports due to the BRI

The top-left panel in Figure 6 illustrates the embedded air pollution. We include four pollutants—carbon monoxide (CO), sulfur dioxide (SO2), oxides of nitrogen (NOX) and coarse particulate matter (PM10). It is estimated that the export growth due to the BRI has resulted in 17,987.1 tons more air pollutants within the borders of China, of which about 12,007.6 tons or 66.76 percent are CO. The increased emission of CO is mainly due to export growth in two industries: smelting of ferrous metals and smelting of nonferrous metals. A long period (weeks or months) of exposure to low levels of CO can cause headache, fatigue, malaise, numbness, unexplained vision problems, sleep disturbances, and impaired memory and concentration.Footnote 12 The increased emission of SO2, NOx, and PM10 is not as significant as that of CO, but its negative effects are not negligible because these pollutants are known to be the primary cause for premature deaths in low- and middle-income countries.Footnote 13
The top-right panel of Figure 6 illustrates CO2 emissions, the leading cause of global warming. It is estimated that the export growth due to the BRI resulted in 724,980.2 tons of CO2 emissions in China from 2013 to 2016. The contributing industries included nonmetallic mineral products, petroleum chemistry, general-purpose machinery manufacturing, smelting of ferrous metals, and metal products. China has made a serious commitment to the reduction of CO2 emissions, in which its total CO2 emissions would reach a peak in 2030 and start to decline thereafter. Given the impacts of the BRI on CO2 emissions, it may become more difficult for China to fulfill this goal.
The lower-left panel of Figure 6 concerns energy consumption. It is estimated that the export growth due to the BRI resulted in 7.0 PJ more energy consumption from 2013 to 2016. This increase was primarily driven by export growth in two industries: petroleum chemistry and smelting of ferrous metals. China's energy consumption has two salient features. First, about 57.7 percent of China's total energy consumption in 2019 came from coal, the dirtiest energy source on average.Footnote 14 Second, China's consumption of oil and natural gas is relying increasingly on international markets. In 2017, about 67.11 and 39.38 percent of China's consumption of oil and natural gas respectively was imported.Footnote 15 Increases in energy demand place more pressure on China's environmental protection goals and lead to complexities in regional economic cooperation.
The lower-right panel of Figure 6 concerns water consumption. It is estimated that the export growth due to the BRI resulted in 133,138.6 m3 more water consumption from 2013 to 2016. This was driven by the export growth in industries such as articles for culture, education and sports activities, agro-food processing, general machinery, and electrical machinery and equipment.
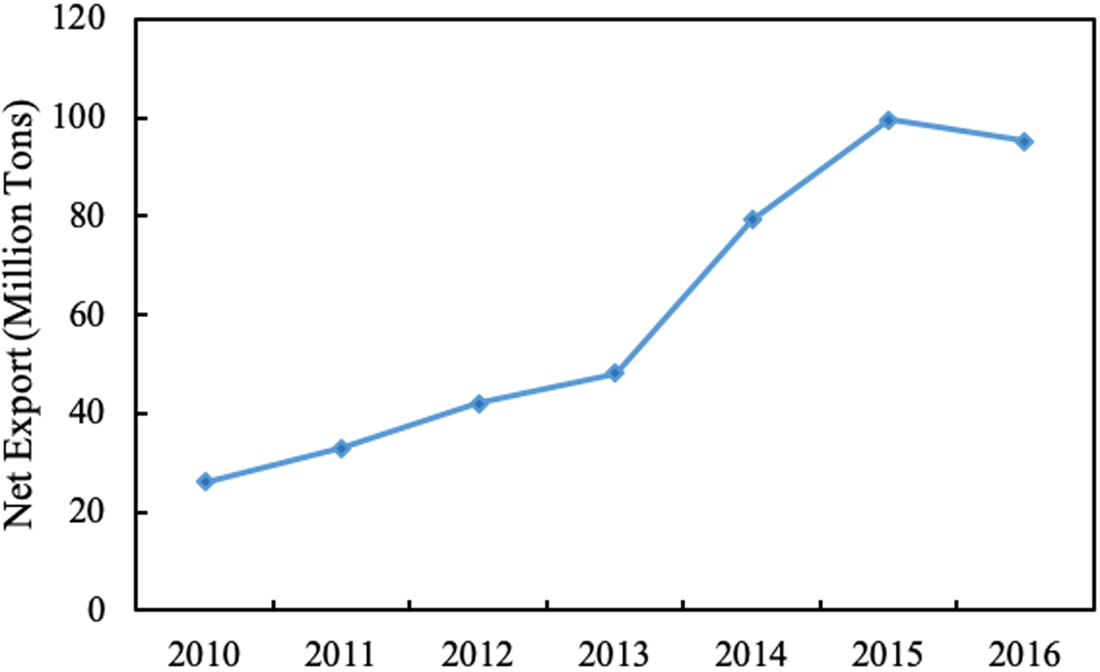
The ferrous metal melting sector appears to contribute the most to environmental concerns. We take a closer look at this sector. Figure 7 illustrates the increase in China's steel exports from 2010 to 2016. It is clear that the growth rate increased after 2013, when the BRI was initiated. In 2015, gross steel exports hit a record high of 112.41 million tons and net exports reached 99.37 million tons (Kim Reference Kim2017). The steel industry is one of the biggest polluters among industrial activities, largely due to the use of coking coal in the production process. Specifically, Chinese steelmakers emit 4.94 kg of particulate matter and 3.53 kg of sulfur dioxide per ton of steel produced, compared with 0.25 kg and 0.7 kg in the United States (Alliance for American Manufacturing 2009). Although the growth of steel exports helps to maintain economic development and employment, it impairs the goals of restructuring the economy towards a low-carbon society and improving the local environment. Further policymaking regarding the BRI must take this into consideration.
Increase in China's steel exports, 2010–2016
Data from: National Bureau of Statistics.

In summary, Chinese investment faces a reputation deficit abroad, and is often observed to have low environmental standards and cause pollution in the recipients. Shi and Siem's article in this issue finds that is a misperception. In the resources sector in Zambia, the Chinese projects are found to be no worse than their Western counterparts. This article has investigated Chinese polluting producers inside China and how they used the BRI to maintain production capacity for exports, resulting in more pollutants and environmental waste inside China, rather than abroad. Such localized patterns, however, often escape the scrutiny of external observers. Indeed, by critiquing the BRI abroad and increasing the cost of relocation, global environmentalists are barking up the wrong tree and reinforce the tendency to export in the pollution-intensive industries, while the relocation of Chinese plants abroad often employs more efficient and cleaner technology, as established by Kong and Gallagher's article in this issue.
CONCLUDING REMARKS
The One Belt One Road Initiative is China's ambitious effort toward regional integration. The initiative aims to strengthen the economic integration between China and countries in Asia, Europe, and Africa. A grave concern in Western society and the recipient countries, however, is the potential environmental cost of the initiative. History already indicates that, when advanced capital moves to developing countries, it brings pollution in the recipient countries as a result of the new levels of production. The Chinese state-directed capital makes such concerns even more imminent and dangerous—the BRI would start a new round of pollution migration from China to other BRI countries, as the Pollution Haven Hypothesis has implied.
We investigated this concern using a domestic and process-centered approach. The BRI was formulated by the central government for multiple purposes. The outcomes largely depended on how local governments and business enterprises implemented the BRI to serve their respective interests. Regarding the concerns over environmental impacts, we particularly analyzed how pollution-intensive industries have responded to the investment and trade opportunities offered by the BRI.
In our analyses, we find that pollution-intensive industries with excess production capacity do not often relocate to the BRI countries, adding to the BRI countries’ environmental burden. Instead, they expand their exports to the BRI countries. The consequences are twofold: on the one hand, the export growth would alleviate the excess capacity issue, and therefore help sustain China's economic growth; on the other hand, the fact that the industries with significant export growth happen to be pollution intensive implies that the export growth would keep pollution within the boundaries of China, thus potentially slowing down China's environmental improvement.
This analysis offers new evidence regarding the environmental impacts of the BRI and highlights the importance of taking an actor-centered approach to understanding the impacts of centrally formulated initiatives in China. The BRI is still unfolding and evolving due to the response of the central government to feedback. During the COVID-19 pandemic, the health dimension of BRI has been highlighted and the BRI could serve as one mechanism in the fight against the pandemic and stabilize global supply chains. As President Xi has emphasized, open, green and clean cooperation, which improves people's lives and promotes sustainable development, is one of the cornerstones of the BRI 2.0. Based on our framework, we expect to provide more analysis and evidence on how the BRI 2.0 shapes China's industrial transformation at the local level in the post-COVID-19 period.
ACKNOWLEDGMENTS
We thank Min Ye, Xinyue Ma, Kevin Gallagher, Bill Grimes, Weiyi Shi, John Ravenhill, and Bo Kong for valuable comments and suggestions at the seminar held at Boston University. The authors also benefited from the input of the editor, Stephan Haggard, and three anonymous reviewers.
FUNDING INFORMATION
Financial support was provided by the National Natural Science Foundation of China (71974124, 71322305, 71704104, and 7177410), the Shanghai Institute of International Finance and Economics, and the China Postdoctoral Science Foundation.
CONFLICT OF INTEREST
The authors declare no conflicts of interest.