





1. Introduction
In this paper, we examine turbulent boundary layers over surfaces that have roughness change in the streamwise direction, which are simplified two-dimensional forms of spatially varying roughness. These type of surface changes occur between rural and urban areas, forest and grasslands, oceans and landmasses; and these large topographical transitions have a direct effect on atmospheric boundary layer flows, therefore, on dispersion of air pollution and wind patterns over urban areas. Surfaces with spatially-varying roughness are also encountered in various engineering applications, such as when a ship hull is partially covered by vegetation grown naturally or regional surface degradations on turbine blades. These surface transitions might affect aero/hydrodynamic performance of these engineering systems significantly, in particular in terms of drag, depending on the magnitude of the abrupt roughness changes. Hence, it is of significant interest to understand and model the behaviour of flows over surfaces exposed to transition in roughness.
Historically, flows over surfaces with roughness change have been mostly studied through an abrupt transition either from a certain type of rough surface to a smooth surface (e.g. Bradley Reference Bradley1968; Antonia & Luxton Reference Antonia and Luxton1971b; Mulhearn Reference Mulhearn1978; Chamorro & Porte-Agél Reference Chamorro and Porte-Agél2009; Hanson & Ganapathisubramani Reference Hanson and Ganapathisubramani2016; Ismail, Zaki & Durbin Reference Ismail, Zaki and Durbin2018; Rouhi, Chung & Hutchins Reference Rouhi, Chung and Hutchins2019; van Buren et al. Reference van Buren, Floryan, Ding, Hellström and Smits2020; Li et al. Reference Li, de Silva, Chung, Pullin, Marusic and Hutchins2021) or vice versa (e.g. Bradley Reference Bradley1968; Antonia & Luxton Reference Antonia and Luxton1971a; Efros & Krogstad Reference Efros and Krogstad2011; Lee Reference Lee2015; Rouhi et al. Reference Rouhi, Chung and Hutchins2019). These studies have shown that the flow in the close vicinity of the wall is affected after the surface transition, and this affected region grows in height (towards the edge of the external boundary layer) forming a new distinguished layer, called the internal boundary layer (IBL). The growth rate of this new layer has been reported to fit a power law with an exponent  $b_0$, i.e.
 $\delta _{ibl} \propto x^{b_0}$, where the exponent has been found to vary between
 $0.2\unicode{x2013}0.8$ (see figure 15 and table 5 in Rouhi et al. Reference Rouhi, Chung and Hutchins2019). Although the discrepancies in the power-law exponent have been mainly attributed to the differences in the methods that are used for the identification of IBLs, in the literature it is also seen that same methods could result in different exponents, and sometimes different methods were observed to yield very similar power-law fits. Thus, it still remains unclear whether the growth of IBLs has a universal power-law constant and, if not, how it changes with the strength of the surface transition. In this regard, the dependency of the multiplication coefficient of the power law on the strength of the surface transition also remains unclear, as there is a lack of systematic study (in addition to the discrepancies in the existing literature even for similar surface transition strengths).
In addition to the formation of an IBL, immediately after the abrupt transition there also occurs a sudden change in skin friction (which overshoots and undershoots the downstream equilibrium values for a smooth-to-rough and rough-to-smooth surface transitions, respectively), and it takes a few boundary layer thickness to fully recover (as can be seen in the literature cited previously). Skin friction has a significant contribution to the overall drag penalty in various transportation and energy generation sectors (e.g. Schultz et al. Reference Schultz, Bendick, Holm and Hertel2011; Spalart & McLean Reference Spalart and McLean2011). In addition, it is used to determine wall-friction velocity which is one of the fundamental scaling parameters in wall turbulence. Hence, it is of significant interest to predict the evolution of skin friction over inhomogeneous surfaces. Recently, the oil-film anemometry measurements of Li et al. (Reference Li, de Silva, Rouhi, Baidya, Chung, Marusic and Hutchins2019) over a smooth wall (where the upstream surface is a P24 grit sandpaper) have shown that the viscous region recovers almost immediately to an equilibrium state with the new surface, whereas the buffer region takes approximately five boundary layer thicknesses before recovering to equilibrium conditions. Compared with skin friction, however, mean flow and turbulent stresses need longer streamwise patches to fully recover. Direct numerical simulations (DNS) of Ismail et al. (Reference Ismail, Zaki and Durbin2018), where the turbulent channel flow transitions from a rib-roughened surface to a smooth wall, suggested that at least a streamwise length of  $40\delta$ (where
 $\delta$ is the channel half-height) is required for the mean flow and the Reynolds shear stress to fully recover. Similarly, the pipe flow experiments of van Buren et al. (Reference van Buren, Floryan, Ding, Hellström and Smits2020) showed that although the pressure gradient, skin friction and mean streamwise momentum reach equilibrium state within approximately
 $20$ radii following the rough (54 grit garnet sandblasting media) to smooth transition, the turbulent stresses take more than
 $120$ radii to attain equilibrium state.
Given the importance of skin friction predictions, researchers have worked on some models to predict the recovery of skin friction over these type of inhomogeneous surfaces (e.g. Elliott Reference Elliott1958; Panofsky & Townsend Reference Panofsky and Townsend1964; Chamorro & Porte-Agél Reference Chamorro and Porte-Agél2009; Ghaisas Reference Ghaisas2020). They mainly divided the overall boundary layer into sections: either two (IBL and the unaffected region above the IBL) or three (equilibrium boundary layer which takes up to  $5\,\%$ of the entire IBL, transition layer within the IBL and the unaffected region above the IBL). Although these different models show significant discrepancies in skin friction prediction, recent experiments of Li (Reference Li2020) have shown that Elliott's (Reference Elliott1958) model describes the development of the skin friction quite well (with some under-prediction in the very near field and an over-prediction in the far field) for the range of the Reynolds numbers,
 $\textit{Re}_{\tau}=7100\unicode{x2013}21\,000$, as well as the roughness Reynolds numbers,
 $k_s^+=111\unicode{x2013}228$, considered in their study. However, the flow regime in their study is fully rough, and for all the cases the flow transitions from a P24 grit sandpaper to a smooth wall. Hence, it is unclear how the model would work for transitionally rough flows as well as for various other surface transition cases, such as rough-to-rougher and rough-to-smoother transitions.
Thus, as can be seen in the literature, mostly rough-to-smooth or smooth-to-rough surface transitions have been studied, covering mainly fully rough flows. Hence, surface transitions between two different rough surfaces as well as transitionally rough flow regime have remained relatively unexplored. Moreover, almost all the studies in the literature lack a comparison of different magnitudes of surface transitions, especially when the changes in surface conditions are less extreme. To fill these gaps, we employ a number of different rough surfaces, i.e. P24, P36 and P60 grit sandpapers in addition to a smooth wall, to form various mild to moderate surface transition cases both in fully rough and transitionally rough flow regimes. This allows us to examine a number of R  $\rightarrow$ S and S
 $\rightarrow$ R transition cases with varying relative strengths in these two different flow regimes. We are particularly interested in the effect of the magnitude of the surface transition on the growth rates of the IBLs, that is the dependency of the power-law coefficients on the strength as well as on the direction (i.e. whether R
 $\rightarrow$ S or S
 $\rightarrow$ R) of the surface transition. With this study, we also assess the development of coherent flow structures through two-point spatial correlations, as well as the evolution of sweep and ejection events following various surface transition cases, which also have remained quite unexplored in the literature. Moreover, in this study we provide further observations on some turbulent flow properties, such as outer-layer similarity and diagnostic plots, for both fully rough and transitionally rough flow regimes (which have not been documented for the latter flow regime as well as for the S
 $\rightarrow$ R cases), and we revisit Elliott's (Reference Elliott1958) model for skin friction. To achieve these goals, for each surface transition case, we conducted high resolution planar particle image velocimetry (PIV) measurements with multiple cameras that were placed side by side. This camera configuration was also traversed downstream to form an extended field of view in the streamwise direction.
This paper is organised as follows: a description of the experimental set-up and methodology is given in § 2. Then in § 3, the results for all the surface transition cases (i.e. R  $\rightarrow$ S and S
 $\rightarrow$ R) are presented and discussed in detail. In addition to the IBL profiles and the relation between their power-law coefficients and magnitude of the surface transition, the evolution of the sweep and ejection events as well as coherent flow structures are examined. In this section, we also revisit Elliott's (Reference Elliott1958) model for skin friction, and provide further observations on the properties of turbulent boundary layer flows (both in transitionally rough and fully rough flow regimes) that are subjected to a step change in surface roughness (i.e. diagnostic and velocity defect analysis). Finally, the findings are summarised in § 4.
2. Experimental set-up and methodology
Planar PIV experiments were performed in the open-circuit suction wind tunnel at the University of Southampton. The test section of the wind tunnel measures  $0.9\,{\rm m} \times 0.6\,{\rm m} \times 4.5\,{\rm m}$, and has a nominally zero pressure gradient Castro (Reference Castro2007). The free stream velocity of the wind tunnel can reach up to
 $30\,{\rm m}\,{\rm s}^{-1}$, with a turbulence intensity less than
 $0.5\,\%$. The free stream velocity of the tunnel was controlled through a National Instruments data-acquisition system (NI-DAQ) and FC
 $510$ manometer.
Surfaces with a step change in roughness (along the streamwise direction) were created with combinations of P $24$, P
 $36$ and P
 $60$ grit sandpapers as well as a smooth wall (S). The nominal roughness information and corresponding sandgrain roughness for the three different rough surfaces used are listed in Gul & Ganapathisubramani (Reference Gul and Ganapathisubramani2021). Surface transitions P24
 $\rightarrow$ S, P36
 $\rightarrow$ S, P60
 $\rightarrow$ S, P24
 $\rightarrow$ P60, P24
 $\rightarrow$ P36 and P36
 $\rightarrow$ P60 form the R
 $\rightarrow$ S cases (where the upstream surface is rough and the downstream is either a smooth wall or a smoother surface compared to the upstream part), whereas P60
 $\rightarrow$ P24, P60
 $\rightarrow$ P36 and P36
 $\rightarrow \,$P24 surface transitions constitute S
 $\rightarrow$ R cases (where the downstream surface is rougher: both surfaces are rough). To achieve these surface transitions, the upstream part of the wind tunnel bottom floor was covered homogeneously with one of the grit sandpapers up to a streamwise distance of
 $2.6$ m (this point is marked as
 $x=0$ in figure 1), and beyond this location the floor was covered homogeneously either with one of the other two sandpapers or with a smooth wall. We should note here that we did not align the roughness crest of the sandpapers or their mean roughness height with each other or the smooth wall. This results in a forward/backward facing physical step (S
 $\rightarrow \,$R/R
 $\,\rightarrow$ S) which was in the range of
 ${\pm }0.6$ mm across the different cases, except P24
 $\rightarrow$ S where there is no height difference between the roughness crest and the smooth wall. Note that this physical step could have been eliminated by placing an additional surface underneath the lower surface. However, this is not very practical considering the total number of the surface transition cases as well as the small thickness of the additional surfaces.
Some flow quantities across two different surface transitions, (a–c) P36  $\rightarrow$ S and(d–f) P60
 $\rightarrow$ P24: (a,d)
 $q=\partial U^+/\partial \ln (y^+)$, (b,e)
 $\overline {u^2}/u^2_{\tau 1}$ and (c, f)
 $\overline {-uv}/u^2_{\tau 1}$. Here
 $x/\delta _0=0$ is the location of the surface change, and the dotted magenta lines correspond to the IBLs obtained in the present study (see figure 2).

To enable the PIV measurements the flow was seeded with vaporised glycerol–water solution particles ( ${\sim }1\,\mathrm {\mu }{\rm m}$) generated by a Magnum
 $1200$ fog machine. Three Lavision's Imager LX 16 MP CCD cameras, each equipped with a Nikon
 $200$ mm lens, were used to acquire PIV images. These high-resolution cameras were aligned side by side, each having a field of view of
 ${\sim }0.15\,{\rm m}\times 0.1\,{\rm m}$ in the streamwise (
 $x$) and wall-normal (
 $y$) directions, respectively, with a streamwise overlapping of
 ${\sim }0.01\,{\rm m}$. After recording
 $2000$ image pairs in a double frame mode, this camera configuration was traversed downstream to capture an extended field of view up to
 ${\sim }14\delta _0$ in the streamwise direction. Here,
 $\delta _0$ is the boundary layer thickness of the upstream homogeneous surface. The regions before and after the traverse were illuminated by two twin-cavity double pulsed Litron Nd:YAG lasers operating at
 $200$ mJ. The calibration, data acquisition and post-processing were performed with a commercial software package (Davis
 $8.3.1$, LaVision). The PIV images were interrogated with a multi-pass interrogation technique, where the final interrogation window size was
 $24\times 24$ pixels (with
 $50\,\%$ overlap). This corresponds to a spatial resolution based on the window size between
 $19.5$ and
 $25.3$ viscous wall units
 $(\nu /u_\tau )$ depending on the surface roughness condition before the surface transition. Here,
 $u_\tau$ is the wall-friction velocity, and
 $\nu$ is the kinematic viscosity of the fluid which is air in the present study. To mitigate the noise in the PIV images, Gaussian smoothing with a kernel size of
 $3\times 3$ applied to each data set during post-processing.
In the present study,  $x$ and
 $y$ represent the streamwise and wall-normal directions, respectively, with the origin placed at the start of the step change in surface roughness. The corresponding mean velocities are denoted by
 $U$ and
 $V$, respectively, whereas the velocity fluctuations are denoted by
 $u$ and
 $v$. The superscript ‘
 $+$’ is used to denote the inner scaling of length (e.g.
 $y^+=yu_\tau /\nu$) and velocity (e.g.
 $U^+=U/u_\tau$). Note that throughout this paper, unless otherwise stated, we use the friction velocity of the upstream surface denoted as
 $u_{\tau 1}$ for the inner normalisation. The friction velocity of each upstream roughness/flow condition was approximated based on the floating element drag measurements of Gul & Ganapathisubramani (Reference Gul and Ganapathisubramani2021), who conducted statistically steady turbulent boundary layer experiments over the same sandpapers (homogeneous rough surfaces without any type of surface transition) in the range of the Reynolds numbers
 $Re_{\tau} (\delta u_\tau /\nu )=1281\unicode{x2013}6317$ and roughness Reynolds numbers
 $k_s^+(k_su_\tau /\nu )=14\unicode{x2013}195$. Here, in their experiments,
 $\delta$ is the streamwise-averaged boundary layer thickness, and
 $k_s$ is the equivalent sandgrain roughness height which is
 $2.30$ mm,
 $1.35$ mm and
 $0.63$ mm for the P24, P36 and P60 grit sandpapers, respectively (as determined by Gul & Ganapathisubramani Reference Gul and Ganapathisubramani2021). In the present study,
 $\delta$ represents the local boundary layer thickness at each streamwise location, whereas
 $\delta _0$ corresponds to the average boundary layer thickness of the upstream homogeneous surface. All these boundary layer thickness definitions are based on the wall-normal location of
 $99\,\%$ of the free stream velocity,
 $U_\infty$. See table 1 for details of the upstream flow conditions for each surface transition case.
Details of the upstream flow conditions for each surface transition (averaged over  ${\sim }2\delta _0$). Here,
 $u_{\tau 1}$,
 $y_{01}^+$ and
 $k_{s1}^+$ were determined based on the experimental findings of Gul & Ganapathisubramani (Reference Gul and Ganapathisubramani2021) over the same sandpapers (homogeneous surfaces without any surface transition).

Magnitudes of the surface transitions, i.e.  $M$, in the present study were determined based on the roughness lengths of the upstream and downstream rough surfaces (
 $y_{01}$ and
 $y_{02}$, respectively), i.e.
 $M \ [=\ln (y_{02}/y_{01})]$. Although
 $y_{01}$ is pretty straightforward to determine using the existing experimental data sets of Gul & Ganapathisubramani (Reference Gul and Ganapathisubramani2021) over the same homogeneous sandpapers,
 $y_{02}$ is a bit challenging to determine for the transitionally rough cases. Hence, we used two different definitions for the magnitude of the surface transitions considering the transitionally rough cases. For the first definition, for the fully rough cases (i.e. for the cases where the upstream surface is P24), we determined
 $y_{02}$ from the
 $y_{02}=k_s\exp (-\kappa A'_{FR})$ relation, with
 $A'_{FR}=8.5$ (Nikuradse Reference Nikuradse1950). For the transitionally rough and smooth wall cases,
 $y_{02}$ was determined using
 $y_{02}=({\nu }/{u_{\tau 2}}){\rm e}^{-\kappa (A-\Delta U^+)}$ and
 $y_{02}=({\nu }/{u_{\tau 2}}){\rm e}^{-A \kappa }$ relations, respectively. Here,
 $u_{\tau 2}$ is the wall-friction velocity of the downstream surface,
 $\Delta U^+$ is the roughness function and
 $\kappa$ and
 $A$ are the Kármán constant and the log-law intercept, respectively. Similar to Gul & Ganapathisubramani (Reference Gul and Ganapathisubramani2021), in this study we employed the values of
 $0.39$ and
 $4.3$ for
 $\kappa$ and
 $A$, respectively, and the values for
 $u_{\tau 2}$ and
 $\Delta U^+$ were obtained at the farthest location from the surface change through logarithmic and modified logarithmic fits for the smooth and rough walls, respectively. Details of the fitting procedure can be found in § 3.2 in Gul & Ganapathisubramani (Reference Gul and Ganapathisubramani2021). Note that for the zero-plane displacement, for the rough walls, we employed half of the nominal physical roughness height.
Although the logarithmic velocity-fit method works quite well for smooth wall, it could be challenging for the rough cases, as both the roughness function ( $\Delta U^+$) and wall-friction velocity (
 $u_{\tau,2}$) are unknown (in addition to the zero-plane displacement which was chosen as half of the physical roughness mean height). Hence, in addition to the above definition for
 $M$, we also employed a second definition for the surface transition strength, i.e.
 $M^\ast$, where the roughness length of the downstream surface was determined at the location of the step change, i.e.
 $y^*_{02}$, assuming the whole test section is covered homogeneously by the downstream rough surface. Note, however, that
 $u_{\tau,2}$ from the first definition is expected to reflect the real flow physics for the downstream surface, hence unless otherwise stated this definition is employed throughout this study.
3. Results
3.1. Internal boundary layer
Following the surface transition, as the flow tries to adjust to the new wall condition, a distinct layer, called an IBL, forms within the overall boundary layer (see figure 1). As can also be seen in figure 1, the turbulent flow properties within the IBL could differ significantly from those of the upstream flow depending on the magnitude of the surface change. Similarly, a significant change in skin friction occurs following the surface transition, and most of the existing models require the growth of the IBL as an input to predict the evolution of the skin friction over the downstream surface. Thus, identifying the structure of IBLs under various surface transition conditions is of significant interest to accurately predict and model the behaviour of overall flow and skin friction.
A number of different methods have been proposed so far to detect IBLs (see Rouhi et al. Reference Rouhi, Chung and Hutchins2019). A great number of these methods are either based on the wall-normal variation of mean streamwise velocity (e.g. Elliott Reference Elliott1958; Antonia & Luxton Reference Antonia and Luxton1971a,Reference Antonia and Luxtonb; Bou-Zeid, Meneveau & Parlange Reference Bou-Zeid, Meneveau and Parlange2004), or the streamwise variation of either mean streamwise velocity (e.g. Andreopoulos & Wood Reference Andreopoulos and Wood1982) or its variance (e.g. Saito & Pullin Reference Saito and Pullin2014; Li et al. Reference Li, de Silva, Chung, Pullin, Marusic and Hutchins2021). With the present experimental data sets which cover both R  $\rightarrow$ S and S
 $\rightarrow$ R surface transitions, we examined all of these methods. We observed that the methods based on the gradients in the streamwise direction, i.e.
 $\partial U /\partial x$ and
 $\partial u^2_{rms}/\partial x$, did not provide robust results for the identification of the IBLs, mainly due to the small gradients in the streamwise direction and comparable noise levels in PIV. The present data sets worked much better with the methods that are based on the wall-normal variation of the streamwise velocity, in particular with Elliott's (Reference Elliott1958) method, which is based on the logarithmic slope of
 $\partial U^+/\partial ln(y^+)$. With Elliott's (Reference Elliott1958) method, however, the wall-normal location to fit the logarithmic slope is not straightforward to determine. This is also the case with the method of Antonia & Luxton (Reference Antonia and Luxton1971a,Reference Antonia and Luxtonb), which is based on the inflection point in
 $U$ vs
 $y^{1/2}$ profile. This could explain some of the discrepancies in the literature for the power-law exponents describing the growth rates of IBLs (which is further discussed in the following).
To attain a more robust comparison among different surface transition cases in the present study, we employed a method that is based on the deviations in the  $q=\partial U^+/\partial \ln (y^+)$ quantity (same quantity as in Elliott Reference Elliott1958) downstream the roughness change with respect to the upstream surface. That is, after forming a new wall-normal coordinate with respect to the local boundary layer thickness,
 $\delta$, for each streamwise location, we subtracted the local
 $q(x,y/\delta )$ quantity from the upstream mean of it, i.e.
 $\bar {q}(y/\delta )_{up}$, and then binarised the region that deviates from the upstream flow by
 $10\,\%$. Afterwards, we applied a power-law fit to the edge of the binarised region (based on the lower edge of the connected region in the wall-normal direction). Here, we used
 $10\,\%$ as a common threshold to determine the edge of the IBL, as this threshold works quite well for all the present surface transition cases. Less deviations from the upstream flow do not always result in a distinguished region for all the cases after binarisation (due to the variations in the noise level in PIV for each camera image as well as the relatively small deviations in
 $q$ for weak surface transition cases). With that, for the P24
 $\rightarrow$ S surface transition case, we also used a weaker threshold, i.e.
 $5\,\%$ deviation relative to the upstream flow, as with this threshold we could obtain a similar IBL profile at each streamwise location with that in Li et al. (Reference Li, de Silva, Chung, Pullin, Marusic and Hutchins2021) (when both coordinates are normalised by
 $\delta _0$), where a similar surface transition, i.e. from P24
 $\rightarrow$ S, is used. Note that they used a threshold of
 $\Delta (\overline {u^2} /U_\infty ^2)/\Delta \log _{10}(\hat {x}/\delta _0)=1\times 10^{-3}$.
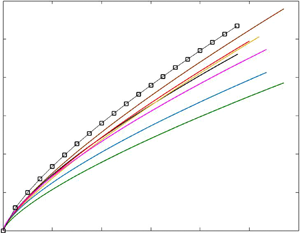
The resulting IBL profiles for all the surface transition cases in the present study are shown in figure 2(a) (except P24  $\rightarrow$ P36 and P36
 $\rightarrow$ P24 cases: we could not obtain any distinguished IBL for these cases with the same method, as the magnitude of the surface transition hence the deviation in the flow quantity was very small). The power-law exponents (
 $b_o$) together with the constants (
 $A$) of the power-law fits to these IBLs, i.e.
 $\delta _{ibl}/\delta _0=A(x/\delta _0)^{b_o}$, on the other hand, are presented in figure 2(b). As can be seen in figure 2(a), when normalised by the upstream boundary layer thickness, the thicknesses of the IBLs at each streamwise location are quite similar for the P24
 $\rightarrow$ S, P24
 $\rightarrow$ P60 and P36
 $\rightarrow$ S cases. The IBLs formed after the P60
 $\rightarrow$ P24 and P60
 $\rightarrow$ P36 transitions, on the other hand, are slightly thicker and thinner, respectively, compared with the former three R
 $\rightarrow$ S transition cases. For the P36
 $\rightarrow$ P60 and P60
 $\rightarrow$ S surface transition cases, however, the IBLs are significantly thinner compared with all other cases. From these profiles, it seems that for similar strength of the surface change (i.e. P24
 $\rightarrow$ P60 & P60
 $\rightarrow$ P24 and P36
 $\rightarrow$ P60 & P60
 $\rightarrow$ P36), slightly thicker IBLs are formed over the S
 $\rightarrow$ R transition cases compared with their R
 $\rightarrow$ S counterparts. This is consistent with the DNS and large-eddy simulation (LES) results of Rouhi et al. (Reference Rouhi, Chung and Hutchins2019) and Li & Liu (Reference Li and Liu2022), respectively, who also observed slightly thicker IBLs for the S
 $\rightarrow$ R surface transition. Note that in the former study, the surface transitions are from a rough sinusoidal surface to a smooth wall and vice versa, whereas in the latter study transition happens between two sinusoidal wavy surfaces.
(a) IBL profiles for all the surface transition cases, where a  $10\,\%$ deviation in the
 $q=\partial U^+/\partial \ln (y^+)$ quantity relative to the upstream mean of it (i.e.
 $\bar {q}(y/\delta )_{up}$ over the upstream surface) is employed. Data shown in cyan with circle correspond to the power-law fit to the data of Li et al. (Reference Li, de Silva, Chung, Pullin, Marusic and Hutchins2021) with
 $A=0.094$ and
 $b_o=0.77$ (
 $\delta _{ibl}/\delta _0=A(x/\delta _0)^{b_0}$), whereas open square symbols correspond to the data for the P24
 $\rightarrow$ S case with a weaker (
 $5\,\%$) threshold. (b) Filled symbols present the exponent,
 $b_o$, of the power-law fit to the experimental data for each surface transition case. Note that here each colour code represents a certain surface transition case, as shown in the legend in (a). Black square symbol corresponds to the result obtained with the weaker (
 $5\,\%$) threshold (corresponds to the IBL profile shown by open square symbols in a). In (c,d) power-law fit multiplicative coefficients,
 $A$, for all the cases are replotted for
 $| M |$ and
 $| M^*|$, respectively, as described in § 2. The error function fitted to the overall data in (d) (i.e.
 $A=1/2 \times [a+{\rm erf}((M^*-b)/(c\times sqrt(2)))]$ with
 $a=-0.83, b=-1.49$ and
 $c=1.1$) is also duplicated in (c) for comparison. Determined based on the error-function fit together with
 $|M|$ and
 $|M^*|$, the results for P24
 $\rightarrow$ P36 and P36
 $\rightarrow \,$P24 are shown in lilac and cyan respectively (c,d). Note that in (d), only the result for P24
 $\rightarrow$ P36 is shown, as the result for P36
 $\rightarrow \,$P24 is identical.

As can be seen from the distributions of the power-law fit exponents in (b), however, there is no significant trend with the magnitude of the surface change, and  $b_0=0.75$ on average. This average value is very close to those obtained by Li et al. (Reference Li, de Silva, Chung, Pullin, Marusic and Hutchins2021) for a similar P24
 $\rightarrow$ S surface transition case. Their power-law exponents are
 $b_0=0.77$ and
 $0.75$, for similar roughness Reynolds numbers
 $k_s^+={\sim }160$ and Reynolds numbers
 $Re_\tau =\sim 14\,000$, respectively (all are within fully rough flow regime and their IBL definitions are based on the streamwise variation of the turbulence intensity). In the present study, the surface transition cases cover both fully rough and transitionally rough flow regimes, i.e.
 $k_s^+(=16\unicode{x2013}81)$, and they are at much lower Reynolds numbers, i.e.
 $Re_\tau =1536\unicode{x2013}2532$. Despite these wide range of variations, a very similar power-law exponent shows no significant dependency on either
 $Re_\tau$ or
 $k_s^+$ in addition to the magnitude of the surface transition.
However, in the literature, different power-law exponents ranging between  $b_0=0.2$ and
 $0.8$ have been reported (a great number of them either gather around 0.4 or asymptote to 0.8). Even with the same method, especially with the methods of Elliott (Reference Elliott1958) and Antonia & Luxton (Reference Antonia and Luxton1971a,Reference Antonia and Luxtonb), different studies have revealed different power-law exponents. This is mainly because the identification of the IBLs with these methods could be subjective (as it is not very straightforward to determine the location of the inflection points in the profiles). For instance, two recent studies, Li et al. (Reference Li, de Silva, Chung, Pullin, Marusic and Hutchins2021) and Li & Liu (Reference Li and Liu2022) have reported two different exponents, namely
 $b_0=0.78\unicode{x2013}0.81$ (for similar
 $Re_\tau -k_s^+$) and
 $b_0=0.25$, respectively, although both studies employed the same method of Antonia & Luxton (Reference Antonia and Luxton1971a,Reference Antonia and Luxtonb), who reported
 $b_0=0.43$. (These are all for R
 $\rightarrow$ S surface transition cases, where S is either a smooth wall or a smoother surface compared with the upstream surface.) On the other hand, the effect of using different methods on some of the results seem not that significant. In the present study, for instance, although we employed a different method from the methods used in Li et al. (Reference Li, de Silva, Chung, Pullin, Marusic and Hutchins2021) (who used both the method of Antonia & Luxton Reference Antonia and Luxton1971a,Reference Antonia and Luxtonb and the method based on the streamwise variation of turbulence intensity), we observed a similar power-law exponent on average, i.e.
 $b_0=0.75$. Moreover, this constant seems not to change significantly with the chosen threshold (see figure 2b). For instance, for the P24
 $\rightarrow$ S case, instead of a
 $10\,\%$ threshold, using
 $5\,\%$ and
 $15\,\%$ thresholds increased and decreased the exponent by less than
 $1\,\%$ and
 $5\,\%$, respectively.
The multiplication constant of the power-law fit, however, could easily be affected by the chosen threshold that is used to distinguish the edge of the IBLs. As can be seen in figure 2 for the P24  $\rightarrow$ S case, although the power-law exponent is very similar for two different thresholds, the constant of the power-law fit could vary significantly depending on the selected threshold. On the other hand, similar to the power-law exponent, with the lower threshold (
 $5\,\%$) through which we obtained a similar IBL thickness with that in Li et al. (Reference Li, de Silva, Chung, Pullin, Marusic and Hutchins2021) at each streamwise location (see figure 2a), the resulting multiplication constant is found to be quite similar to the value reported by them (
 $A=0.100$ in the present study and
 $A=0.094\,(0.095)$ for the similar
 $k_s^+ (Re_\tau )$ data sets in their study where they used the streamwise variations in the turbulence intensity to detect the IBL). Note, however, that they found quite different values for
 $A$ with the method of Antonia & Luxton (Reference Antonia and Luxton1971a,Reference Antonia and Luxtonb), i.e.
 $A=0.062\,(0.059)$ for the similar
 $k_s^+ (Re_\tau )$ data sets.
When the multiplicative coefficients are compared for different surface transition cases in the present study, i.e. for different magnitudes of the surface change (figure 2c,d), two different behaviours are observed for  $|M|$ and
 $|M^*|$ (see § 2). With
 $|M^*|$ (figure 2d), the coefficients are increasing with the magnitude of the surface transition for the R
 $\rightarrow$ S cases. The coefficients for the S
 $\rightarrow$ R transition cases, on the other hand, are similar to that of P24
 $\rightarrow$ S. Overall, it is seen that all the results for the power-law fit coefficients could be represented by an error function (with
 $\delta _{ibl}=0$ for
 $M^*=0$ because there is no significant physical step change between the surfaces), i.e.
 $A=1/2 \times [a+{\rm erf}((M^*-b)/(c\times sqrt(2)))]$ with
 $a=-0.83$,
 $b=-1.49$ and
 $c=1.1$ (shown by purple solid line). When the same multiplicative coefficients are compared for
 $|M|$ in figure 2(c), the same error function seems to describe the behaviour of these coefficients for the fully rough cases and for the cases where the downstream surface is a smooth wall. For all other transitionally rough cases (all are rough-to-rough surface transitions), the coefficients are significantly higher than the fit. From these figures, it is clearly seen that for similar surface transition strengths, e.g. P36
 $\rightarrow$ P60, P60
 $\rightarrow$ P36 (and P60
 $\rightarrow$ S in
 $c$) or P24
 $\rightarrow$ P60 and P60
 $\rightarrow$ P24, a thicker IBL is formed over the rougher downstream surface. This supports some of the previous models (see table 2 in the Appendix) which represent the growth of an IBL as a function of the roughness length of the downstream surface (rather than the upstream one). As can also be seen from these figures, surface transition strength also plays a role in the growth of IBLs. However, its effect decreases with increasing
 $|M^*|$ or
 $|M|$ (depending on the definition), and could asymptote to a single value as suggested by the present data.
In this section, we have examined the growth rates of IBLs for various R  $\rightarrow$ S and S
 $\rightarrow$ R surface transition cases which cover both transitionally rough and fully rough flow regimes. In the following sections, we mainly discuss the response and the evolution of some of the flow properties (including sweep and ejection events) and coherent flow structures based on two-point spatial correlations which have remained relatively unexplored.
3.2. Velocity defect profiles and diagnostic plots
Mean streamwise velocity defect and diagnostic plots are frequently employed to assess the wall-similarity hypothesis of Townsend (Reference Townsend1956). According to the wall-similarity hypothesis, at sufficiently high Reynolds numbers the outer region does not feel the roughness effects on the wall. As reported recently by Gul & Ganapathisubramani (Reference Gul and Ganapathisubramani2021) for homogeneous surfaces, mean streamwise velocity defect profiles over the P24, P36 and P60 grit sandpapers (the same sandpapers as used in the present study) exhibit outer-layer similarity in the range of the Reynolds number  $Re_\tau =1281\unicode{x2013}6317$ and roughness Reynolds number
 $k_s^+=14\unicode{x2013}195$. The diagnostic plots, on the other hand, hold wall similarity only for
 $k_s^+\geq 75\,(\Delta U^+\geq 7)$, as they showed. Thus, considering these results over these homogeneous surfaces, in this section we examine the behaviour of the mean streamwise velocity defect and diagnostic profiles under various R
 $\rightarrow$ S and S
 $\rightarrow$ R surface transitions (where flow regimes cover both transitionally and fully rough flows). In this section, we also briefly discuss the variance profiles for outer-layer similarity (for certain cases for brevity).
Figures 3 and 4 show the mean streamwise velocity defect profiles for the R  $\rightarrow$ S and S
 $\rightarrow$ R cases, respectively, at various streamwise locations. Here, the wall-friction velocity of the upstream flow, i.e.
 $u_{\tau 1}$, is used for inner normalisation. As can be seen in these figures, velocity defect profiles close to the beginning of the surface change (up to
 $x/\delta _0=1$, considering the P24
 $\rightarrow$ S case which has the strongest surface transition) preserve similarity very close to the wall. This shows that a significant part of the boundary layer is not affected by the surface change closer to the surface transition. However, with increasing streamwise distance from the surface transition, as the effects of the new wall condition propagate towards the interior of the boundary layer, i.e. with the growth of the IBL, the defect profiles deviate further from the upstream condition. The profiles become lower than the upstream case for the R
 $\rightarrow$ S cases, whereas they become higher for the S
 $\rightarrow$ R cases. This is consistent with the expected behaviour of the skin friction (and accordingly the wall-friction velocity) downstream of the surface change (which undershoots and overshoots their upstream counterparts over the downstream surface after the surface transition for the R
 $\rightarrow$ S and S
 $\rightarrow$ R cases, respectively).
Streamwise velocity defect profiles,  $(U_\infty -U)^+$, for the R
 $\rightarrow$ S cases at various streamwise locations: (a) P24
 $\rightarrow$ S, (b) P36
 $\rightarrow$ S, (c) P60
 $\rightarrow$ S, (d) P24
 $\rightarrow$ P60, (e) P36
 $\rightarrow$ P60 and ( f) P24
 $\rightarrow$ P36. Here, for each streamwise location, the profiles are averaged over
 ${\sim }0.2\delta _0$, and for the inner normalisation wall-friction velocity of the upstream flow, i.e.
 $u_{\tau 1}$ is used. Dashed blue lines are mean profiles over the upstream part before the transition, i.e. between
 $x/\delta _0=-2$ and
 $x/\delta _0=-0.05$.

Streamwise velocity defect profiles,  $(U_\infty -U)^+$, for the S
 $\rightarrow$ R cases at various streamwise locations: (a) P60
 $\rightarrow$ P24, (b) P60
 $\rightarrow$ P36 and (c) P36
 $\rightarrow$ P24. Here, for each streamwise location, the profiles are averaged over
 ${\sim }0.2\delta _0$, and for the inner normalisation wall-friction velocity of the upstream flow, i.e.
 $u_{\tau 1}$ is used. Dashed blue lines are mean profiles over the upstream part before the transition, i.e. between
 $x/\delta _0=-2$ and
 $x/\delta _0=-0.05$.

To collapse these defect profiles, the scaling friction velocity at each streamwise location should also vary in the wall-normal direction between  $u_{\tau 2}(x)$, which is the local condition, to
 $u_{\tau 1}$, which is the upstream condition. Here, we would like to note that although the defect profiles deviate more from the upstream profiles with streamwise distance for the cases that have stronger surface transition, there is no clear observable trend on the effect of the magnitude of the surface transitions on these deviations.
Similar behaviour was also observed in the variance of the streamwise and wall-normal velocities (when normalised by  $u^2_{\tau 1}$), as presented in figure 5. This clearly shows that above the IBL, these second-order flow properties remain self-similar with those of the upstream flow, as the effects of the new surface conditions have not yet reached that part of the flow.
Variance of the streamwise ( $\overline {u^2}/u^2_{\tau 1}$, dotted lines) and wall-normal (
 $\overline {v^2}/u^2_{\tau 1}$, solid lines) velocities, normalised by the upstream wall-friction velocity,
 $u_{\tau 1}$: (a) P24
 $\rightarrow$ S, (b) P36
 $\rightarrow$ S, (c) P36
 $\rightarrow$ P60 and (c) P60
 $\rightarrow$ P24. For each streamwise location, the profiles are averaged over
 ${\sim }0.2\delta _0$, and same colour code is applied here as in figures 3 and 4.

The effect of the surface transition is also visible in the diagnostic plots, where the turbulence intensity (e.g.  $\sqrt {\overline {u^2}}/U$) profiles are plotted against
 $U/U_\infty$ (see figures 6 and 7 for the R
 $\rightarrow$ S and S
 $\rightarrow$ R cases, respectively). Similar to the above defect profiles, for the R
 $\rightarrow$ S cases (except P24
 $\rightarrow$ P36), the deviations from the upstream profile occur first close to the wall after the surface change, and these deviations cover a larger wall-normal distance with the growth of the IBL over the downstream surface. This gradual change in the diagnostic profiles is not observed in the S
 $\rightarrow$ R cases. In addition, different from its R
 $\rightarrow$ S counterpart, the diagnostic profile at
 $x/\delta _0=1$ for the P60
 $\rightarrow$ P24 transition case seems to undershoot the upstream equilibrium profile (except the region very close to the wall), and the affected wall-normal distance is greater than the corresponding IBL thickness at this streamwise location. For all the surface transition cases, however, the profiles farthest away from the step change approach to those represented by dotted black lines (for rough downstream surface) or black lines with filled circles (for smooth downstream surface). Here, dotted black lines correspond to the mean profiles over a streamwise fetch of
 $-2\delta _0$ and
 $-0.05\delta _0$ (before the location of the surface change) assuming the whole test section is covered homogeneously by the downstream surface. Data shown by black lines with filled circles, on the other hand, represent the experimental data of Hutchins et al. (Reference Hutchins, Monty, Ganapathisubramani, Ng and Marusic2011). For comparison, here, we also show the smooth-wall asymptote of Alfredsson, Orlu & Segalini (Reference Alfredsson, Orlu and Segalini2012) (black dashed lines). The profiles for the R
 $\rightarrow$ S cases show that even if the upstream flow before the step change is fully rough (which is the case for the transitions where upstream surface is P
 $24$), the diagnostic profiles within the IBL could have a transitionally rough or hydraulically smooth flow behaviour depending on the roughness properties of the downstream surface. For the S
 $\rightarrow$ R cases, on the other hand, the diagnostic profiles (within the IBLs) become more close to fully rough behaviour (except very close to the surface transition for the P60
 $\rightarrow$ P24 case), and the equilibrium profile is reached much quicker compared with their R
 $\rightarrow$ S counterparts.
Streamwise turbulence intensities,  $\sqrt {\overline {u^2}}/U$, plotted against the mean velocity normalised by the free stream velocity,
 $U/U_\infty$, for the R
 $\rightarrow$ S cases at various streamwise locations: (a) P24
 $\rightarrow$ S, (b) P36
 $\rightarrow$ S, (c) P60
 $\rightarrow$ S, (d) P24
 $\rightarrow$ P60, (e) P36
 $\rightarrow$ P60 and ( f) P24
 $\rightarrow$ P36. Here, each profile is averaged over
 ${\sim }0.2\delta _0$. Dashed blue lines are mean profiles over the upstream part before the transition, i.e. between
 $x/\delta _0=-2$ and
 $x/\delta _0=-0.05$. These profiles are also denoted by dotted black lines for the corresponding downstream surfaces; for instance, the dotted black line in (d) corresponds to the dashed blue line in (c). Dashed black lines, on the other hand, correspond to the smooth wall asymptote of Alfredsson et al. (Reference Alfredsson, Orlu and Segalini2012), whereas black lines with circles correspond to the experimental data of Hutchins et al. (Reference Hutchins, Monty, Ganapathisubramani, Ng and Marusic2011).

Streamwise turbulence intensities  $\sqrt {\overline {u^2}}/U$ plotted against the mean velocity normalised by the free stream velocity,
 $U/U_\infty$, for the S
 $\rightarrow$ R cases at various streamwise location: (a) P60
 $\rightarrow$ P24, (b) P60
 $\rightarrow$ P36 and (c) P36
 $\rightarrow$ P24. Dashed blue lines are mean profiles over the upstream part before the transition, i.e. between
 $x/\delta _0=-2$ and
 $x/\delta _0=-0.05$. These profiles are also denoted by dotted black lines for the corresponding downstream surfaces; for instance, the dotted black line in (b) corresponds to the dashed blue line in (c).

For the P24  $\rightarrow$ P36 and P36
 $\rightarrow$ P24 cases, however, because the steady-state diagnostic profiles over the homogeneous P36 and P24 surfaces are very close to each other, the effect of the surface transition (independent of the magnitude of the surface transition) is not expected to be visible in these diagnostic plots. We would like to note here that using the above diagnostic profiles for the R
 $\rightarrow$ S transition cases (except P24
 $\rightarrow$ P36), we also identified the IBLs and obtained similar results as in figure 2.
3.3. Sweep and ejection events
In this section, we examine the evolution of the ejection,  $Q_2$, and sweep,
 $Q_4$, events over the R
 $\rightarrow$ S and S
 $\rightarrow$ R cases. Note that previously no significant differences were observed in the contribution of the sweep and ejection events to the overall turbulent shear stress, when the results for different grit sandpapers (i.e. P24, P36 and P60; homogeneous surfaces) are compared for a range of
 $Re_\tau (1281\unicode{x2013}6317)$ and
 $k_s^+ (14\unicode{x2013}195)$ (Gul & Ganapathisubramani Reference Gul and Ganapathisubramani2021). Similar to that study, for the quadrant analysis, we employed the parabolic hole approach of Lu & Willmarth (Reference Lu and Willmarth1973) with hyperbolic hole size
 $H=1$. (Note that similar results were also found with
 $H=0$.) The resulting
 $Q_2$ and
 $Q_4$ profiles (averaged over a streamwise distance of
 ${\sim }2\delta _0$) for various streamwise locations relative to the location of the surface change are presented in figure 8 for selected cases (for brevity).
Contribution of the ejection ( $Q_2$, dashed lines) and sweep (
 $Q_4$, solid lines) events to the overall turbulent shear stress at various streamwise location. Blue, red, yellow, green, magenta and black lines correspond to the data averaged over
 $x\sim (-2\unicode{x2013}0)\delta _0$,
 $(0\unicode{x2013}2)\delta _0$,
 $(2\unicode{x2013}4)\delta _0$,
 $(4\unicode{x2013}6)\delta _0$,
 $(6\unicode{x2013}8)\delta _0$ and
 $(8\unicode{x2013}10)\delta _0$, respectively: (a) P24
 $\rightarrow$ S, (b) P60
 $\rightarrow$ S, (c) P24
 $\rightarrow$ P60, (d) P36
 $\rightarrow$ P60, (e) P60
 $\rightarrow$ P24 and ( f) P36
 $\rightarrow$ P24.

In figure 8(a), it can be seen that for the P24  $\rightarrow$ S transition case, the contribution of the ejection and sweep events are decreasing and increasing, respectively, within the IBL, as the flow accelerates over the smooth surface. Beyond
 $y/\delta =0.5$, however, no clear differences are observed similar to the other flow quantities as discussed in § 3.2. As the magnitude of the surface transition decreases, the changes in
 $Q_2$, and
 $Q_4$ events diminish in strength for the other smooth wall cases (i.e. P36
 $\rightarrow$ S and P60
 $\rightarrow$ S), and the equilibrium state is reached earlier. For the other R
 $\rightarrow$ S cases (i.e. when the downstream surface is also rough), however, it seems that the differences in the
 $Q_2$ and
 $Q_4$ events are not significant, similar to our previous findings over the same sandpapers without any surface change (Gul & Ganapathisubramani Reference Gul and Ganapathisubramani2021). Thus, the differences in the contribution of the
 $Q_2, Q_4$ events for these R
 $\rightarrow$ S cases could be due to the smooth wall where the absence of rough elements mitigate (enhance) the
 $Q_2$ (
 $Q_4$) events.
For the P60  $\rightarrow$ P24 case (figure 8e), on the other hand, the contribution of the
 $Q2$ (
 $Q4$) events first undershoots (overshoots) just after the surface change in the vicinity of the wall, and then overshoots (undershoots) until it reaches the upstream equilibrium profile, as the flow decelerates over the downstream surface. This behaviour becomes less distinguished as the magnitude of the surface transition decreases, and as can be seen in figure 8( f) from the P36
 $\rightarrow$ P24 case, finally, no differences are observed. These results suggest that when flow transitions from a rough surface with a small roughness Reynolds number (i.e.
 $k_s^+$) to a much rougher surface, some changes in the contribution of sweep and ejection events could occur downstream of the step change, but finally initial equilibrium profiles would be reached after some streamwise fetch.
As these profiles suggest, the contribution of the sweep and ejection events could be affected significantly by the sudden surface change, and the nature of the response of these events to the surface change depends on both the magnitude and the nature of the surface transition, i.e. whether it is rough-to-smooth, rough-to-smoother or rough-to-rougher.
3.4. Spatial structures
Different from the §§ 3.2 and 3.3, where we examine the effect of the strength as well as the nature of surface transition on various turbulence quantities, in this section, we investigate the evolution of the spatial structures downstream the surface transition. This is done by comparing the large-scale structures that are present in the flow through two-point spatial correlations over a streamwise fetch of  $2\delta _0$ (ignoring non-homogeneity over each streamwise fetch). The streamwise (
 $l_x$) and wall-normal (
 $l_y$) lengths of the average flow structures were determined based on
 $R_{uu,vv}=0.5$. Here,
 $R_{uu}$ and
 $R_{vv}$ are the correlation coefficients for the streamwise and wall-normal velocity fluctuations, i.e.
 $u$ and
 $v$, respectively (see Gul & Ganapathisubramani (Reference Gul and Ganapathisubramani2021) for the two-point spatial correlation formula as well as for the details of the analysis). The resulting streamwise and wall-normal lengths of the correlation coefficients for four different reference wall locations (i.e.
 $y/\delta$) are shown in figure 9 for P24
 $\rightarrow$ P60 (solid lines with filled symbols) and for the inverse transition case, i.e. P60
 $\rightarrow$ P24 (dashed lines with open symbols). Note that in these figures, we considered four different streamwise fetches relative to the step change, namely
 $(-2\unicode{x2013}0)\delta _0$ (shown in blue),
 $(0\unicode{x2013}2)\delta _0$ (shown in red),
 $(6\unicode{x2013}8)\delta _0$ (shown in magenta) and
 $(8\unicode{x2013}10)\delta _0$ (shown in black).
Wall-normal ( $l_y$) and streamwise (
 $l_x$) lengths of two-point correlation coefficients (
 $R$) of streamwise velocity (
 $u$) and wall-normal velocity (
 $v$) fluctuations (i.e.
 $R_{uu}$ and
 $R_{vv}$, respectively). Solid lines with filled symbols correspond to the results for the surface transition case P24
 $\rightarrow$ P60, whereas dashed lines with open symbols represent the results for P60
 $\rightarrow$ P24. Same colour code as in figure 8 applies here, i.e. blue, red, magenta and black profiles correspond to the results obtained over a streamwise fetch of
 ${\sim} (-2\unicode{x2013}0)\delta _0$,
 $(0\unicode{x2013}2)\delta _0$,
 $(6\unicode{x2013}8)\delta _0$ and
 $(8\unicode{x2013}10)\delta _0$, respectively.

As can be seen in figure 9(a,c) for the P24  $\rightarrow$ P60 case, the wall-normal length of both correlation coefficients, i.e.
 $l_{y,uu}$ and
 $l_{y,vv}$, increases as the flow develops over the downstream surface. That is the average flow structures become thicker in the wall-normal direction, as the flow accelerates downstream of the surface after the transition. For the reverse transition case, i.e. P60
 $\rightarrow$ P24 (figure 9a,e), however, flow deceleration over the second surface causes the average flow structures to become thinner in the wall-normal direction. There is also a clear decrease in the streamwise length of the average flow structures (both
 $l_{x,uu}$ and
 $l_{x,vv}$) for the P60
 $\rightarrow$ P24 case (figure 9b, f). Although the differences are not that significant for the P24
 $\rightarrow$ P60 case for the streamwise length of the correlation coefficients for the streamwise velocity fluctuations, it is seen that both correlation coefficients become more elongated in the streamwise direction for this case, as the flow accelerates over the smoother surface (see figure 9b,d). Note that previously the DNS results of Ismail et al. (Reference Ismail, Zaki and Durbin2018) (where flow transitions from a rib-roughened surface to a smooth wall in a turbulent channel flow) showed that the streamwise integral length scale of streamwise velocity fluctuations near the step change (i.e. within
 $x/\delta \leq 0\unicode{x2013}2.57$) are greater than the streamwise length scales of the upstream flow at various reference wall-normal locations up to
 $y/\delta =0.2$. Between
 $y/\delta =\sim 0.25$ and
 $0.75$, however, these length scales gradually become smaller with the streamwise distance (up to
 $x/\delta =2.57$). Although this near-wall region behaviour is consistent with the present results in figure 9(b) (for the R
 $\rightarrow$ S case), the differences between these two studies away from the wall could be explained by the differences in the flow geometries.
In this section, we also investigated the evolution of the low- and high-speed structures for the same surface transition cases. To do that, we conditioned the two-point correlation analysis on the low- and high-speed events ( $u<0$ and
 $u>0$, respectively). The resulting wall-normal (
 $l_{y,uu}$) and streamwise (
 $l_{x,uu}$) lengths of these events are presented in figure 10. Here, for brevity we only present the results for two different streamwise fetches relative to the location of the surface change, i.e.
 $(-2\unicode{x2013}0)\delta _0$ and
 $(8\unicode{x2013}10)\delta _0$. Results shown by solid lines with filled symbols correspond to the low-speed events, whereas the resulting profiles for the high-speed events are presented by dotted lines with open symbols. As can be seen from these figures, similar to the average flow structures, the peaks of the correlation coefficients conditioned on the low- and high-speed events become thicker and more elongated in the wall-normal and streamwise directions, respectively, as the flow accelerates over the smoother surface (i.e. for the P24
 $\rightarrow$ P60 transition case). For the reverse transition case (i.e. P60
 $\rightarrow$ P24), however, these structures (both low- and high-speed events) become thinner and shorter in the wall-normal and streamwise directions, respectively. The changes in the lengths of these structures seem to be quite similar for both events, when the results for these two different streamwise fetches are compared. These results are consistent with figure 11 of Li & Liu (Reference Li and Liu2022), which shows that the iso-surfaces of both low- and high-speed structures are bigger after the flow transitions over a smoother surface. Note that their study is based on LES over two sinusoidal wavy surfaces with
 $| M |=1.06$.
Wall-normal ( $l_y$) and streamwise (
 $l_x$) lengths of two-point spatial correlation coefficients of streamwise velocity (
 $u$) and wall-normal velocity (
 $v$) fluctuations (i.e.
 $R_{uu}$ and
 $R_{vv}$, respectively). Here, the correlations are conditioned on either low-speed events, i.e.
 $u<0$ (filled symbols with solid lines), or high-speed events, i.e.
 $u>0$ (open symbols with dotted lines). Data shown in blue and black correspond to the results over a streamwise fetch of
 ${\sim} (-2\unicode{x2013}0)\delta _0$ and
 $(8\unicode{x2013}10)\delta _0$, respectively, relative to the location of the surface change. In (a,b) results for the P24
 $\rightarrow$ P60 transition case are presented, whereas in (c,d) results for the inverse transition case, i.e. P60
 $\rightarrow$ P24, are shown.

3.5. Skin friction development model
In transportation industry, skin friction constitutes a significant portion of the overall drag, e.g. up to  $90\,\%$ in shipping (Schultz et al. Reference Schultz, Bendick, Holm and Hertel2011) and
 $50\,\%$ in aviation (Spalart & McLean Reference Spalart and McLean2011). Hence, accurate prediction of overall skin friction is of significant interest. However, the existing predictive models mainly assume homogeneous surface topography, which is not the case in many of the engineering applications and therefore incorrectly estimates the overall drag. As can be seen in various literature (e.g. Antonia & Luxton Reference Antonia and Luxton1971a,Reference Antonia and Luxtonb; Efros & Krogstad Reference Efros and Krogstad2011; Hanson & Ganapathisubramani Reference Hanson and Ganapathisubramani2016; Li et al. Reference Li, de Silva, Rouhi, Baidya, Chung, Marusic and Hutchins2019), skin friction undergoes a sudden change when exposed to surface inhomogeneity, which even undershoots (overshoots) the value of the equilibrium state of the downstream surface after rough-to-smooth (smooth-to-rough) streamwise surface transitions. Moreover, skin friction is crucial to determine wall-friction velocity which is one of the fundamental scaling parameters in wall turbulence. Hence, it is very important to accurately predict the development of skin friction over inhomogeneous surfaces. In this section, we explore the utility of a given model based on the large dataset obtained in this study.
A number of methods have been proposed so far, and among them Elliott's (Reference Elliott1958) model seems one of the simplest and reasonably accurate. For instance, the oil-film measurements of Li (Reference Li2020) for the P24  $\rightarrow$ S surface transition shows that Elliott's (Reference Elliott1958) model (which models the flow within and outside the IBL with two logarithmic profiles) predicts the behaviour of the flow quite well (within
 $3\,\%$ accuracy for all the cases investigated where
 $Re_\tau =7100\unicode{x2013}21\,000$ and
 $k_s^+=111\unicode{x2013}228$). Similarly, when Elliott's (Reference Elliott1958) model is applied to the rough (grit surface)-to-smooth surface transition data of Hanson & Ganapathisubramani (Reference Hanson and Ganapathisubramani2016) (where
 $M=-3.4$), it is seen that the model underestimates the experimental data (obtained with Preston tube) within
 $5\,\%$ (see figure 11a). However, as can be seen from the same figure, the prediction (relative to the Preston tube measurements) becomes worse for their mesh surface-to-smooth wall transition case where
 $M=-5.1$. Considering these comparisons, Elliott's model seems to provide accurate results within
 $5\,\%$ for
 $|M| \leqslant 3.4$ (for rough-to-smooth transition cases). Hence, for our surface transition cases, where
 $| M |<3$, also considering the similarity of our strongest surface transition case with that in Li (Reference Li, de Silva, Rouhi, Baidya, Chung, Marusic and Hutchins2019) (i.e. P24
 $\rightarrow$ S), Elliott's (Reference Elliott1958) model is expected to yield results for the wall-friction velocity within
 $3\,\%$. However, we would like to note here that some of the present surface transition cases are in the transitionally rough flow regime, also include S
 $\rightarrow$ R transition cases, both of which have been subject of limited number of investigations. Thus, further studies are needed to verify the results for these cases.
(a) Wall-friction velocity over the downstream surface relative to the upstream value of it, i.e.  $u_{\tau,2}/u_{\tau,1}$, for all the R
 $\rightarrow$ S transitions. Here, the inverse of this ratio, i.e.
 $u_{\tau,1}/u_{\tau,2}$, is presented for the S
 $\rightarrow$ R cases to compare the results with their R
 $\rightarrow$ S counterparts. All the data were obtained using the model proposed by Elliott (Reference Elliott1958) based on the experimental data sets of Gul & Ganapathisubramani (Reference Gul and Ganapathisubramani2021), together with a (modified) logarithmic fit. The magnitude of the surface change is
 $M[=\ln (y_{02}/y_{01})]$, where
 $y_{02}$ corresponds to the roughness length determined at the farthest location beyond the surface change. For further comparison, the experimental data of Hanson & Ganapathisubramani (Reference Hanson and Ganapathisubramani2016) for grit-to-smooth (
 $M=-3.4$, shown by filled square symbols) and mesh-to-smooth (
 $M=-5.1$, shown by open square symbols) are presented together with the results obtained with Elliott's (Reference Elliott1958) model for these two cases (solid and dotted lines, respectively). Inset shows the milder surface transition cases for comparison. (b) Resulting
 $u_{\tau,2}/u_{\tau,1}$ data at a streamwise distance of
 $x/\delta _0=9.5$ beyond the surface transition. In (a,b) the data shown in black, red, yellow, blue, green, lilac, cyan, magenta and brown correspond to the P24
 $\rightarrow$ S, P36
 $\rightarrow$ S, P24
 $\rightarrow$ P60, P36
 $\rightarrow$ P60, P60
 $\rightarrow$ S, P24
 $\rightarrow$ P36, P36
 $\rightarrow$ P24, P60
 $\rightarrow$ P36 and P60
 $\rightarrow$ P24, respectively. All the R
 $\rightarrow$ S data (including some of the literature) together with inverse values of their S
 $\rightarrow$ R counterparts are shown in the inset.

Elliott's (Reference Elliott1958) model (originally developed for atmospheric boundary layers) basically represents the mean velocity profile,  $U$, within the IBL, i.e.
 $y<\delta _{ibl}$, and the unaffected flow above it, i.e.
 $y>\delta _{ibl}$, with two logarithmic profiles
 \begin{equation} U(y) =
\begin{cases}
\dfrac{u_{\tau1}}{\kappa}\ln(y/y_{01}), &
y>\delta_{ibl},\\
\dfrac{u_{\tau2}}{\kappa}\ln(y/y_{02}), &
y<\delta_{ibl}. \end{cases}
\end{equation}
Here,  $\delta _{ibl}$ is the local IBL thickness, as determined in § 3.1 for all the surface transition cases. Note that for the weak surface transition cases, i.e. P24
 $\rightarrow$ P36 and P36
 $\rightarrow$ P24, the error-function fit in figure 2(d) is used to determine the local IBL (as all the data seem to be represented by an error-function fit). Roughness length of the homogeneous upstream surfaces, i.e.
 $y_{01}$, was determined based on the experimental data of Gul & Ganapathisubramani (Reference Gul and Ganapathisubramani2021) for all the sandpapers. The roughness length of the downstream surfaces, i.e.
 $y_{02}$, on the other hand, were determined from
 $y_{02}=({\nu }/{u_{\tau 2}}){\rm e}^{-A \kappa }$ and
 $y_{02}=({\nu }/{u_{\tau 2}}){\rm e}^{-\kappa (A-\Delta U^+)}$ for the smooth and rough walls, respectively (except P24
 $\rightarrow$ P60 and P24
 $\rightarrow$ P36 cases, for which a fully rough relation, i.e.
 $y_{02}=k_s\exp (-\kappa A'_{FR})$, was used). As discussed in § 2, the values of
 $u_{\tau 2}$ and
 $\Delta U^+$ were obtained at the farthest location from the surface change through logarithmic and modified logarithmic fits for the smooth and rough walls, respectively. Hence, in this section
 $| M|$ is used to quantify the magnitude of the surface transition (see § 2) and accordingly to compare the results with the existing literature. The resulting profiles for the wall-friction velocity over the downstream surface, i.e.
 $u_{\tau,2}$, with respect to the upstream value, i.e.
 $u_{\tau,1}$ are presented in figure 11(a). Note that for the S
 $\rightarrow$ R cases, the inverse of
 $u_{\tau,2}/u_{\tau,1}$ is plotted for comparison. Also here in this figure, the experimental results (Preston tube measurements) of Hanson & Ganapathisubramani (Reference Hanson and Ganapathisubramani2016) for grit-to-smooth and mesh-to-smooth surface transition cases are shown together with the results produced using Elliott's (Reference Elliott1958) model (solid and dotted lines, respectively) for the surface transition cases. From these profiles, it is seen that the behaviour of wall-friction velocity is highly dependent on the magnitude of the surface transition. When the ratios of the wall-friction velocities at a streamwise distance of
 $x/\delta _0=9.5$ are compared with those in the literature, it is seen that the predictions obtained with Elliott's (Reference Elliott1958) model for the present surface transition cases, where
 $| M | <3$, seem to be consistent with the available experimental and some of the computational data. Although we expect the fully rough surface transition cases (P24
 $\rightarrow$ S, P24
 $\rightarrow$ P60 and P24
 $\rightarrow$ P36) to be accurate within
 $3\,\%$, transitionally rough cases (including three S
 $\rightarrow$ R cases) need further investigation.
4. Conclusions
This study has examined turbulent boundary layers that are subjected to a step change in surface roughness in the streamwise direction. Experimental data sets (including both fully rough and transitionally rough flow regimes) were acquired with PIV where multiple cameras were placed side by side and also traversed downstream to obtain an extended field of view (up to  $14\delta _0$). With combinations of three rough surfaces (i.e. P24, P36 and P60 grit sandpapers) and a smooth wall, a number of rough-to-smooth(er), R
 $\rightarrow$ S, and smoother-to-rough, S
 $\rightarrow$ R, surface transition cases were created.
The detected IBLs for the present surface transition cases reveal an average value of  $b_0=0.75$ for the power-law fit exponent, and this exponent varies between
 $b_0=0.71\unicode{x2013}0.8$ among different cases with no clear trend relative to the magnitude of the surface transition. In addition, no dependency on the roughness Reynolds number or Reynolds number was found, although the present flow conditions include both transitionally and fully rough flow regimes (i.e.
 $k_s^+=16\unicode{x2013}81$) and low Reynolds numbers (i.e. 1536–2532). These findings support the recent study of Li et al. (Reference Li, de Silva, Chung, Pullin, Marusic and Hutchins2021), who examined various flow transitions from a P24 grit sandpaper to a smooth wall at much higher
 $k_s^+\,(\geq 111)$ and
 $Re_\tau \,(\geq 7100)$. The multiplication constant of the power-law fit, however, was observed to increase with the strength of the surface transition in the present study, at least for the fully rough and rough-to-smooth wall surface transition cases, which could be represented by an error function. For similar surface transition strengths, on the other hand, higher multiplicative constants was observed over the rougher downstream surfaces.
For some surface transition cases, some significant differences were observed in the contribution of the ejection and sweep events near the wall. For instance, for the P24  $\rightarrow$ S, the contribution of the
 $Q_2$ and
 $Q_4$ events were observed to decrease and increase, respectively, within the IBL, as the flow accelerates over the downstream smooth surface. Although this is also the case for other two rough-to-smooth wall transition cases, the magnitudes of the changes are smaller and the equilibrium profile is reached earlier compared with the P24
 $\rightarrow$ S case. For other R
 $\rightarrow$ S transition cases, i.e. where the downstream surface is also a rough surface, no significant differences in the profiles of the
 $Q_2$ and
 $Q_4$ events were observed. For the P60
 $\rightarrow$ P24 transition case, on the other hand, the ejection (sweep) events were observed to first undershoot (overshoot) the upstream profile, and then they were seen to overshoot (undershoot), until they reach the upstream equilibrium profiles. This behaviour becomes less distinguished, as the magnitude of the surface transition decreases.
In this study, we also examined the evolution of coherent structures based on two-point spatial correlations, which has remained relatively unexplored in the literature. The results for the P24  $\rightarrow$ P60 case showed that the wall-normal and streamwise length of the correlation peaks become thicker and more longer, respectively, as the flow accelerates over the smooth or smoother surface. For the inverse transition case, i.e. P60
 $\rightarrow$ P24 (where flow decelerate over the downstream rougher surface), however, the correlation peaks were observed to shrink in size, both in the wall-normal and streamwise directions. Same behaviour was also observed, when correlations were conditioned on the low- and high-speed events separately, that is both low- and high-speed structures were observed to become larger (smaller) in size as the flow accelerates (decelerates) over the downstream surface.
Finally, in this study, we revisited the model of Elliott (Reference Elliott1958) to predict the evolution of the wall-friction velocity for all the cases which include both transitionally and fully rough flows. Results showed that the recovery of the wall-friction velocity over the downstream surface could be represented as a function of the surface transition strength. The overall results at  $x=\sim 10\delta _0$ also seemed to be quite consistent with the most of the existing literature. Although the results are expected to be accurate within
 $3\,\%$ for the fully rough cases (i.e. P24
 $\rightarrow$ S, P24
 $\rightarrow$ P60 and P24
 $\rightarrow$ P36 cases) considering the available experimental literature, further research is required for the transitionally rough cases and for S
 $\rightarrow$ R cases (independent of being transitionally rough or fully rough).
Funding
We gratefully acknowledge the financial support from Engineering and Physical Sciences Research Council through their grants (reference number: EP/P009638/1 and EP/R034370/1). All data presented in this study will be openly available from the University of Southampton repository.
Declaration of interests
The authors report no conflict of interest.
Appendix. IBL height formulae in the literature
Table 2 lists some formulae that were developed for the prediction of the growth of IBLs. Here, we only considered the ones that either have a similar power-law constant (i.e.  $b_0=0.8$) or yield similar IBL heights. However, as can be seen in figure 12, although some of these formulae work for some surface transition cases, none of them work well for all the cases in the present study. This is mainly because most of these models ignore the effect of surface transition strength, and hence describe the growth of an IBL only based on one of the roughness lengths (i.e. roughness length of either upstream or upstream surface). However, the resulting IBLs for the present surface transition cases show that surface transition strengths (
 $M$) also play a role in particular for lower values of
 $|M|$. Otherwise, P24
 $\rightarrow$ P36 and P36
 $\rightarrow$ P24 surface transitions would also cause distinguished IBLs. On the other hand, as we discussed in § 3.2, the effect of
 $M$ on the multiplication constant (
 $A$) is decreasing with increasing
 $|M|$. Hence, if
 $A$ asymptotes to a single value with increasing
 $|M|$, then the growth of an IBL could be represented by the roughness length of the downstream surface as the present data suggest.
(a) Prediction of IBL growths for (a) P24  $\rightarrow$ S, (b) P60
 $\rightarrow$ S, (c) P36
 $\rightarrow$ S and (d) P60
 $\rightarrow$ P24 using the formulae in table 2 and parameters specific to each of these present surface transition cases. Symbols (corresponding to each formulae) are listed in table 2. Brown, red, green and black (with or without squares, where the data with squares represent the IBL with a
 $5\,\%$ threshold as in § 3.1) lines correspond to the present data sets, i.e. P60
 $\rightarrow$ P24, P36
 $\rightarrow$ S, P60
 $\rightarrow$ S and P24
 $\rightarrow$ S, respectively.

Some of the IBL height formulae in the literature (those that have either a power-law constant  $b_0=0.8$ or similar IBL height). Here,
 $M=\ln (y_{02}/y_{01})$,
 $y_{0r}=\max (y_{01},y_{02})$ and
 $\kappa$ is the Kármán constant.



