The history of schools in the United States is, in many respects, a tale of struggle over equality and opportunity in American life. Schools play a critical role in regulating social mobility and the transmission of status across generations. Footnote 1 In a society defined by stark social inequalities, schools are expected to “level the playing field,” supply individuals with opportunities to flourish, and promote positive socialization and social cohesion. Footnote 2
Yet in America, public education has long been seen as more than just a tool of socio-economic intervention. Reformers and public officials have prized schools equally as tools of civic incorporation, stressing their potential to produce, empower, and integrate citizens. Footnote 3 Against a backdrop of democratic ideals, schools are called upon to produce a more competent, engaged citizenry, underwrite a more egalitarian political order, and function as local sites of democratic public engagement in their own right. Footnote 4 With the right kinds of experiences in the schoolhouse, reformers have argued, even the most socially disadvantaged youth could develop the skills and dispositions needed to become part of an inclusive, enlightened citizenry. Social rights to education could serve as the seedbeds of democracy, ensuring citizens’ abilities to exercise their civil and political rights. Footnote 5
Thus, for reformers such as Horace Mann in the common school movement, education represented the “great equalizer” in political life, an unparalleled bulwark against tireless pressures toward plutocratic “tyranny.” Footnote 6 The U.S. Supreme Court, in Brown v. Board (1954), framed its unanimous rejection of racist school segregation in terms of public education’s unique significance as “the very foundation of good citizenship.” A quarter-century later, in Ambach v. Norwick (1979), the Court affirmed this commitment, citing the special “importance of public schools in the preparation of individuals for participation as citizens, and in the preservation of the values on which our society rests.”
Democratic theorists have been no less keen than reformers to emphasize the civic importance of public education. No society can hope to be truly democratic, John Dewey wrote, unless it provides a “type of education which gives individuals a personal interest in social relationships and control, and the habits of mind which secure social changes without introducing disorder.” Footnote 7 T.H. Marshall stressed the role of public education as a universal social right that expresses and secures the full and equal civic status needed for a democratic polity. Footnote 8 If our educational institutions fail in their democratic mission, Marshall and other liberal theorists suggest, it is because some citizens receive too little of the good things they have to offer. Schools fail to fulfill their democratic mission if they distribute the positive foundations of civic and political engagement unequally and in a manner that tracks prevailing social inequalities. Footnote 9
In broad outline, this view has defined the center of gravity for a vibrant subfield of research on political behavior and public opinion. Conventional wisdom identifies formal education as “almost without exception the strongest factor influencing what citizens do in politics and how they think about politics.” Footnote 10 The civic goods that schools distribute—things like knowledge and cognitive and practical skills—make it easier for more educated citizens to comprehend political conflicts, see connections among public issues, and get involved as participants. Footnote 11 Thus, formal education is not only the best predictor of political engagement; Footnote 12 it is close to a “universal solvent” in political life, possessed by some far more than others. Footnote 13
In what follows, we revisit the political consequences of formal education, seeking to clarify how school experiences relate to social and political inequalities. Several developments form the intellectual backdrop for our investigation. First, as economic inequalities have risen to create what some have called America’s “New Gilded Age,” scholars have returned in force to age-old questions about how social and economic hierarchies may threaten democracy. Footnote 14 Second, over the past 25 years, scholars have produced a vibrant new literature on the ways public policies structure political life and construct patterns of status, belief, and action in the citizenry. Footnote 15 Third, we build on a specific branch of this “policy feedback” research that focuses on how policy-based experiences of authority relations serve as occasions for political learning that shape political consciousness and behavior. Footnote 16 Fourth, we connect the study of political behavior to a growing body of educational research on the criminalization of school environments and the expansive and socially-biased uses of punitive tools such as suspension and expulsion. Footnote 17
Shifting attention from the political skills and resources schools distribute, we focus instead on how schools function as sites for direct experiences of civic authority relations. It is at the schoolhouse that most individuals have their first, formative experiences of how public institutions and authorities govern putatively equal peer groups. Schools, from this perspective, do more than allocate goods that citizens acquire, possess, and convert to political advantage. They organize authority relations and position students differently within them; they demonstrate how public institutions work and how authorities can be expected to behave. In so doing, they define potentially critical formative experiences during what many see as citizens’ most “impressionable years.” Footnote 18
To develop this argument, we draw the study of school authority and discipline together with themes from a number of intellectual traditions: John Dewey’s writings on the experiential bases of citizenship, Footnote 19 scholarship on schools as mechanisms of social reproduction, Footnote 20 studies of school authority relations Footnote 21 and their potential to supply students with a “hidden curriculum,” Footnote 22 and feedback research on how policy experiences influence citizens’ political dispositions. Footnote 23
Our focus on school authority relations is motivated, in part, by well-documented shifts in prevailing approaches to school discipline. Footnote 24 To varying degrees, American schools have moved in recent decades toward a “crime control paradigm” that emphasizes stricter regimes of behavioral regulation, stronger security and surveillance procedures, zero-tolerance approaches to smaller violations, and increased reliance on punitive sanctions. Footnote 25 Research suggests that students disadvantaged by race and class are disproportionately targeted for these sorts of disciplinary actions, which tend to have significant negative effects on educational and social outcomes. Footnote 26 In 2012, for example, black K–12 students were suspended at a rate almost four times that of white students, and while black children made up only 19% of the preschool student population, they accounted for 47% of preschool suspensions. Footnote 27
Such patterns raise important questions for students of US politics who have become increasingly concerned about the potential for social inequalities to undermine American democracy. Footnote 28 Reformers and scholars have long championed schooling as a powerful civic force capable of incorporating the disadvantaged and defending democracy against the corrosive effects of societal inequalities. In what follows, we ask whether authority relations in America’s schools today turn this hope on its head, working to tighten the bonds between social and political hierarchies by cultivating political withdrawal and mistrust of government among the most socially disadvantaged. In so doing, we join many others in the field, who ask: How do the policy designs and practices we choose matter for the vitality of democracy in America?
Our empirical analysis draws on a nationally representative panel dataset (Add Health) to investigate how adolescent experiences of school authority matter for citizens’ later political attitudes and behaviors. We begin with an intersectional analysis of how three axes of social differentiation and inequality—race, class, and gender—combine to shape student experiences of school authority relations. Despite the profound influence of intersectional thought across the social sciences and humanities, Footnote 29 in the history of political activism, Footnote 30 and in some landmark works of political science, Footnote 31 intersectional analysis continues to play a marginal role in the political behavior subfield. Seeking to bridge this divide, we examine how various axes of social differentiation and power work in conjunctural (rather than additive) ways to shape political experiences of school discipline and authority.
With this analysis in hand, we deploy the panel structure of the Add Health data to estimate how such experiences of school authority matter for later political attitudes and behaviors. We find strong evidence that negative school authority experiences are powerfully associated with later patterns of political engagement and trust in government. We conclude that educational explanations for political inequalities remain significantly incomplete so long as they focus only on the acquisition of beneficial skills, resources, and forms of knowledge. Schools also contribute to civic inequalities by supplying socially disadvantaged students with formative experiences of authority that cultivate distrust in government and political disengagement.
Education as Civic Possession
“It is reasonably clear that good citizens are made, not born,” William Galston observes, “the question is how, by whom, to what end?” Footnote 32 Not surprisingly, the qualities that make citizens “good” are a matter of some dispute. Footnote 33 Yet few today would contest the idea that formal education is central to their development. Civic learning is not limited to the schoolhouse, of course. It emerges through experiences with families and peers, neighborhoods and broader social networks, Footnote 34 through direct participation in a range of organized and informal settings, Footnote 35 through interactions with mass and social media, Footnote 36 and through pedagogical “empowerment” projects pursued in a wide array of societal institutions. Footnote 37 When scholars seek to explain citizens’ political thought and behavior, however, few factors loom as large as formal educational attainment. Verba, Schlozman, and Brady conclude that “education is the prime factor in most analyses of political activity . . . . It affects the acquisition of skills; it channels opportunities for higher levels of income and occupation; it places individuals in institutional settings where they can be recruited to political activity; and it fosters psychological and cognitive engagement with politics.” Footnote 38
Today, there is little doubt that formal schooling advantages some over others in American political life. Footnote 39 The question is how. Conventional answers tend to begin by conceptualizing formal education as a bundle of advantageous civic possessions. More schooling is better, in this view, because it arms citizens with greater stores of political knowledge, superior political skills, and stronger understandings of democratic values; it allocates academic credentials that help citizens acquire politically useful resources and access occupations where recruitment into politics is more likely.
The role played by schools in this account is largely pre-political and distributive. Scholars of political behavior rarely inquire into the school as a site of political experience and action in its own right. Rather, they associate politics with adults and ask what civic possessions such individuals acquired earlier in their lives through schooling. In this sense, the school is treated much like the family, as a “pre-political” site where youth take on traits and skills that will eventually have political significance down the line, when they become adult members of the polity in full standing. Footnote 40
Despite important disagreements, then, prevailing answers to the “how” question generally focus on uneven distributions of politically relevant human capital, created, for example, through school curricula or activities conceptualized as training exercises for future citizens (e.g., judicial panels, extracurricular clubs, and student governments). Footnote 41 In recent decades, particular attention has focused on civics education and venues for direct student participation. Footnote 42 Schools, in this view, function as distributive mechanisms that provide socially disadvantaged students with lesser access to the positive goods of educational attainment, quality instruction, and opportunities to develop civic skills for the future. Footnote 43
In principle, schools might promote democratic citizenship by distributing educational goods against the grain of social inequalities. In practice, however, researchers find that schools typically supply advantaged groups with superior opportunities for skill development, knowledge accumulation, credentialing, and socialization. Footnote 44 The “great equalizer” of public education fails to achieve its egalitarian goals because it distributes students into schools and educational tracks of unequal quality and distributes educational goods disproportionately to dominant groups.
Schooling as a Formative Political Experience
Working within this framework, scholars of political behavior generally have been less interested in schools per se than in the things they allocate. An alternative approach is suggested by studies of policy feedback, a concept that has organized growing attention to citizens’ direct experiences with policy and governance over the past two decades. Footnote 45 “Policy feedback” refers broadly to the potential for government policies to transform political structures and relations, positions and dispositions, capacities, identities, and interests. Working under this umbrella, a growing number of scholars have sought to understand how policy designs structure political relations in nominally administrative settings Footnote 46 and how citizens learn and develop through personal experiences of policy practices in street-level bureaucracies. Footnote 47
In this manner, feedback research has helped to expand the political analysis of citizenship to sites that, in common sense understandings, tend not to be deemed “political.” The welfare agency and the police station, for example, have long been ignored in the study of political behavior, set aside as sites of administration. Studies of policy feedback have recast such locales as sites where policies structure political relations and where policies themselves are remade through political choices and practices. At the welfare agency, the police station, and other sites of policy implementation, ordinary people participate directly in political relations: They exercise political agency and advance claims on government; they have personal experiences with state institutions and officials; they negotiate authority relations and navigate decision processes; and in the process, they bring concrete meanings to the formal rights and obligations that define political membership. Footnote 48 Encounters with policies and public authorities in such settings are, in and of themselves, central to what Evelyn Nakano Glenn calls the lived realities of “substantive citizenship.” Footnote 49
As Moynihan and Soss note, however, feedback scholars have long emphasized a two-sided approach to the analysis of policy implementation. Footnote 50 On one side, scholars treat policies as formally endorsed goals and techniques, and analyze how they structure and frame political relations in administrative settings. On the other side, scholars also acknowledge that a “policy” can be more than the static letter of the law: Policies evolve and take concrete form through transformative practices of translation, specification, and application in administrative settings. Thus, drawing on Latour and Feldman and Pentland, Footnote 51 one might say that a policy has both ostensive aspects (declared and understood ideals and norms) and performative aspects (improvisational practices of enactment). From this perspective, street-level bureaucratic practices are very much a part of what a policy is—and thus, a part of the policy’s effects on politics—even though street-level practices may deviate from ostensive policy commitments.
We build on this perspective here by showing how school authority policy regimes (consisting of both ostensive and performative aspects) can operate in ways that teach consequential political lessons. As individuals observe how authorities treat them, they learn lessons about their own worth and standing in public life. In this manner, street-level bureaucratic experiences can operate to “define and create certain kinds of subjects and identities” in the polity. Footnote 52 In the long hours that clients spend waiting at the welfare agency, for example, Javier Auyero observes “the everyday manufacturing of subjects who know, and act accordingly, that when dealing with state bureaucracies they have to patiently comply with the seemingly arbitrary, ambiguous, and always changing state requirements.” Footnote 53 Through the aggressive policing of communities subjugated by race and class, citizens receive a course of instruction in what race and class mean in America, how state power operates, and what citizenship entails for Americans who occupy the lower reaches of the social order. Footnote 54 Such experience can shape long-term expectations regarding procedural justice in public institutions Footnote 55 and beliefs about whether government officials should be seen as trustworthy and responsive or as authoritarian threats to be feared and avoided. Footnote 56
From this perspective, scholars misconstrue schools when they analyze them solely as preparatory, distributive operations located “prior to” politics. Schools also may be studied as venues of policy practice in which citizens experience political relations. At the schoolhouse, youth have their first formative experiences of public authority. As students, they are immersed in rules and prohibitions, and are visibly governed as members of a community of putative equals. On matters small and large, they seek actions from teachers and administrators and observe how they respond. They are rewarded or punished for their behaviors, and subjected to modes of authority that may be fairly and legitimately deployed or used in an arbitrary and unjust manner. Such experiences are far from trivial in the lives of students, and it seems unwise to assume they leave no imprint when people move on to the business of adult citizenship. Indeed, because schooling begins so early in life and extends into adolescents’ “impressionable years,” Footnote 57 one might expect experiences of authority relations in schools to have particularly far-reaching effects.
By complementing the subfield’s focus on distributed educational goods with greater attention to the political relations that schools organize, it is possible to recover multiple themes in the study of education that have been needlessly pushed to the margins of political behavior research. John Dewey, for example, is surely among the most influential modern theorists of education, democracy, and citizen development. Footnote 58 Yet in political behavior scholarship today, few researchers heed his powerful critique of democracy-minded school reforms that focus too narrowly on the skills and lessons distributed by educational curricula. In Experience and Education, Dewey focused particular attention on whether relations at the schoolhouse are organized in more authoritarian versus democratic ways. Footnote 59 “Traditional education” that aims to promote democracy through curricular content can easily be trumped, he argued, by students’ immersion in undemocratic peer relations and experiences of teachers and school officials as authoritarian powers.
Decades of scholarship outside political science reinforce the view that authority relations are salient, consequential features of school environments. Footnote 60 Building on classic social theories of authority, Footnote 61 empirical studies in the 1970s suggested that school authority relations are structured to justify and serve particular moral and political orders Footnote 62 and can undermine learning goals if they are structured in ways that students perceive as arbitrary and authoritarian. Footnote 63 More recent studies suggest that daily school experiences can teach respect or disrespect for public authorities, and validate or invalidate claims for the importance of abiding by rules. Footnote 64 Legal scholar Betsy Levin concludes that “the way in which school administrators operate schools may have a more powerful influence on students than the lessons in their civics textbooks.” Footnote 65
Critical scholarship has elaborated these themes in close dialogue with theories of social and civic domination. Some suggest, for example that alongside the formal curriculum, students learn a “hidden curriculum” of power and position through their daily experiences of the school and classroom. Footnote 66 The hidden curriculum is conveyed implicitly through schoolhouse practices, in ways that reflect prevailing institutional needs and priorities as well as the cultural biases of communities and school authorities. In an important summary statement that speaks directly to the concerns of our own study, Justice and Meares argue that
alongside what schools say they teach is another curriculum [of daily experience] that includes lessons about who matters, or does not, and whether the overt school curriculum, and the republic for which it stands, is legitimate or arbitrary, liberating or oppressive. … [Regardless of] a school’s overt civics curriculum . . . [this] hidden curriculum of schooling can offer daily counterproductive lessons in how not to be a citizen, especially for those groups who have been historically marginalized. At its worst, the hidden curriculum of a public school may offer lessons in who is deserving of arbitrary or harsh punishments; whose gender or color or social class is a liability; whose history does not count; and whose language, customs, and values are of no consequence. Footnote 67
Beyond hidden curriculum studies, critical scholars have produced an extensive literature on how schools function as mechanisms for the social reproduction of dominant-subordinate relations. Footnote 68 The most basic functions of schools, in this view, include replicating status and resource advantages, producing individuals who are suited to their eventual roles in hierarchical social relations, facilitating opportunity hoarding, advancing dominant interests, and legitimating social inequalities by converting advantages of birth into legitimate achievements.
These diverse intellectual streams converge to offer scholars of political behavior what may be fairly described as a “fresh standpoint” for analyzing the interplay of social inequalities, formal education, and democratic citizenship. The preceding discussion provides a strong basis for the expectation that experiences with school authority regimes influence the development of citizens’ dispositions toward government and political engagement. Footnote 69
Research Expectations
For empirical analysis, we specify students’ experiences of school authority relations along three dimensions: their school’s policy regime of disciplinary rules and practices, personal experiences of punitive sanctioning, and perceptions of whether school authorities treat students fairly. In each case, we take up two main research questions: How do students’ positions along axes of social differentiation and inequality matter for their experiences of school authority relations? How do such school experiences matter for political dispositions observed later, in young adulthood?
Schoolwide disciplinary regimes encompass the formal (ostensive) “rules of the game” for relations between students and school authorities as well as the (performative) ways school officials put these rules into practice. Previous research suggests that more stringent regimes emerge disproportionately in schools with more black and poorer students, in the South, and in urban areas. Footnote 70 These patterns of differential exposure to more stringent regimes map onto long-standing patterns of racial segregation in schools which have limited racial minorities' access to equal schooling opportunities and contributed to racial disparities in educational outcomes. Footnote 71 Such patterns have been pronounced enough that the U.S. Departments of Education and Justice jointly released guidelines for how schools can meet their federal obligations to administer student discipline without discriminating on the basis of race, color, or national origin, and urged schools to “rethink” their approaches to discipline. Footnote 72
Combining these observations with the political learning arguments reviewed earlier, Footnote 73 we expect experiences with more authoritarian regimes to be more common among socially subordinate groups and associated with the development of more negative political dispositions.
Turning to more personalized experiences, we focus on whether individual students have been singled out for punishments such as suspensions or expulsions. Studies of punishment in welfare and criminal justice settings often reveal significant biases related to race and other axes of social inequality Footnote 74 and suggest that punitive experiences with authorities tend to diminish political trust, efficacy, and engagement. Footnote 75 Weaver and Lerman conclude that “punitive encounters with the state foster mistrust of political institutions and a weakened attachment to the political process.” Footnote 76 Punitive sanctions in schools appear to exhibit similar social biases, Footnote 77 and some have suggested they may have similarly negative civic effects. Footnote 78 Accordingly, we expect students singled out for punishments to come disproportionately from subordinate social groups and to develop more negative dispositions toward government and politics.
At a more subjective level, we consider students’ perceptions of how school authority relations work. As Cohen and Garcia point out, “even when in the apparently same objective environment, the perceptions and beliefs that shape students’ experience and outcomes can differ markedly.” Footnote 79 In this regard, Arum argues for special attention to judgments of the legitimacy of authority as rooted in perceptions of fairness. Footnote 80 Several studies, including Arum’s, have provided strong empirical evidence that schools where students perceive rules and treatment as fair produce lower rates of delinquent behavior and victimization and higher rates of achievement. Footnote 81 Previous work also suggests that perceptions of unfairness are less prevalent among white students than black students, and in some cases Latinos. Footnote 82 Moreover, studies in non-school settings suggest that subjective assessments of fair treatment can have substantial effects on orientations toward government. Footnote 83 Gimpel and colleagues argue such dynamics may extend to schools, so that “students who do not develop trust in school authorities are slow to develop trust in and respect for other governing authorities.” Footnote 84 Accordingly, we expect students who perceive school authority relations as unfair to come disproportionately from socially subordinate groups and to have higher odds of civic and political marginalization later in life.
Data, Empirical Measures, and Analytic Approach
Data for our study are drawn from the National Longitudinal Study of Adolescent to Adult Health (Add Health), a nationally representative study of adolescents who were in grades 7 through 12 during Wave 1, the 1994–1995 school year. Footnote 85 Our analytic sample is drawn from the core longitudinal sample observed in Wave 1 and again in Wave 3 administered six years later (N = 14,320 students from 132 schools). By applying the appropriate core longitudinal weights, we obtain a representative sample of adolescents enrolled in grades 7–12 in US schools during 1994–1995. Footnote 86 To ensure that measures of school environments accurately reflect the schools that respondents experienced, this sample is restricted to students who did not switch schools. Footnote 87 Multiple imputation was used to estimate missing values for all variables except the dependent variables and school experiences. Footnote 88 The final analytic sample includes 11,875 students drawn from 125 schools.
Our first empirical analyses explore how students’ racial identities influence their school authority experiences and, through an intersectional analysis, how race, gender, and class positions work together to shape student experiences. Rates of exposure to the three key experiences are estimated first through mean differences and then after adjusting for student demographics (race, age and, where appropriate, gender and parent education); student behaviors and attitudes (delinquent behavior, grades, vocabulary test score, engagement in school, report of trying hard in school, and belief in hard work); and school characteristics (large, urban, private, south, average parent education, average achievement, and racial diversity).
Turning to the political effects of school experiences, we examine two key outcomes: electoral participation and trust in government. Because each school experience is separate (but potentially related to the others), we estimate their influence simultaneously and assess both their relative and cumulative effects. In all multivariate analyses, we estimate models with a consistent and substantial set of control variables for student demographic differences, other student characteristics, and school characteristics (as defined earlier). In a final model for each citizenship outcome, we also control for young adult statuses (such as educational attainment, marital status, employment, and political party identification).
To account for non-independence of observations and estimate correct standard errors, we use design-based specifications that take into account the unequal probability of respondent selection (by specifying individual-level weights) and the multi-stage clustering of the Add Health design (by specifying measures of stratification and primary sampling unit). Weights provided with the Add Health data allow for correction of biases related to unequal probabilities of selection into the sample and attrition within the sample over time.
Experiences of School Authority Relations
To measure students’ experiences with school disciplinary regimes, we draw on four indicators: punitive severity, the frequency of penalty usage, the scope of rules regulating student behavior, and the extent of surveillance and monitoring. To capture punitive severity, we draw on items from the School Administrator Survey that identify penalties for students committing twelve different types of first-time infractions (e.g., cheating, smoking, injuring another student, carrying a weapon, etc.). Administrators specified whether they had each policy and, if so, its severity (e.g. verbal warning, minor action, in-school suspension, out-of-school suspension, expulsion). We create an index by averaging the severity of penalty at first offense for each of the twelve infractions. Footnote 89 Higher values indicate greater severity. To capture the frequency of punitive sanctioning, we rely on rates of suspension or expulsion, calculated at the school level by aggregating all student reports of personal experiences with either.
Rule-based regulation and surveillance and monitoring are measured by items in the School Administrator Survey. Rule-based regulation includes whether a school had rules limiting student dress or attire, the use of hall passes, student freedom to exit the school building, and smoking on school grounds. Administrators reported which rules they had and for which grades. An indicator for each rule applied to 7–12 graders was created, and then added to calculate the final measure. Surveillance and monitoring includes whether a school uses a security guard, a metal detector at entryways, or other special safety procedures (e.g., random metal-detector checks, campus monitors, student identity cards, or video surveillance). The range for this measure is 0–2, where a value of 0 indicates that the school has none of the itemized security procedures and a value of 2 indicates that it deploys two or more. These four measures are standardized (mean of 0, standard deviation of 1) and added to create a composite index of school disciplinary environment. We dichotomize this scale at the mean and use above-the-mean values to indicate “tougher than average” disciplinary regimes.
To capture the objective experience of punishment we use a measure of “punitive sanctioning” drawn from items in Waves 1 and 3 of the In-Home Surveys that asked respondents if they had ever been suspended or expelled and, if so, in what grade this last occurred. Our dichotomous indicator takes on a value of 1 for respondents who reported being suspended or expelled at any time during grades 7–12. To measure subjective perceptions of authorities’ fairness, we use an item from the In-School Survey that asks whether respondents agree or disagree with the following statement: “The teachers at your school treat students fairly.” Based on the Likert response categories, we create an indicator variable (0/1) that reflects disagreement, and thus a perception that teachers treat students unfairly.
Political Citizenship Outcomes
Outcome measures are drawn from the Wave 3 In-Home Survey, administered when respondents were young adults, aged 18–26. The first indicates (0/1) whether respondents reported voting in the most recent presidential election. Footnote 90 The second captures self-reported trust in government. Respondents were asked how much they agreed or disagreed with three statements: “I trust the federal [my state, my local] government.” Each item used five-choice Likert response categories (strongly agree to strongly disagree), and responses are highly correlated across the three questions (α = .93). Thus, we categorized responses as “agree” or “disagree,” assigned respondents to their modal category across questions and created an indicator variable for modal “agreement” that the respondent has trust in government. Footnote 91
Individual and School Characteristics
Racial self-identification is based on two survey items: Hispanic/Latino ethnicity (yes/no), and racial self-identification (African American, White, Asian or Pacific Islander, American Indian, Other Race). Respondents identifying as Hispanic/Latino are categorized as Latino. Respondents choosing more than one racial category are categorized as Multiracial. Footnote 92 Self-reported “sex” (male or female) is taken from Wave 1. Respondent age is taken from Wave 3, measured in years. Parental education is measured by a Wave 1 item asking respondents to report the highest level of education attained by her or his residential parents. The measure is coded 1 if the respondent reported having at least one resident parent who attained at least a four-year college degree and 0 otherwise. Footnote 93
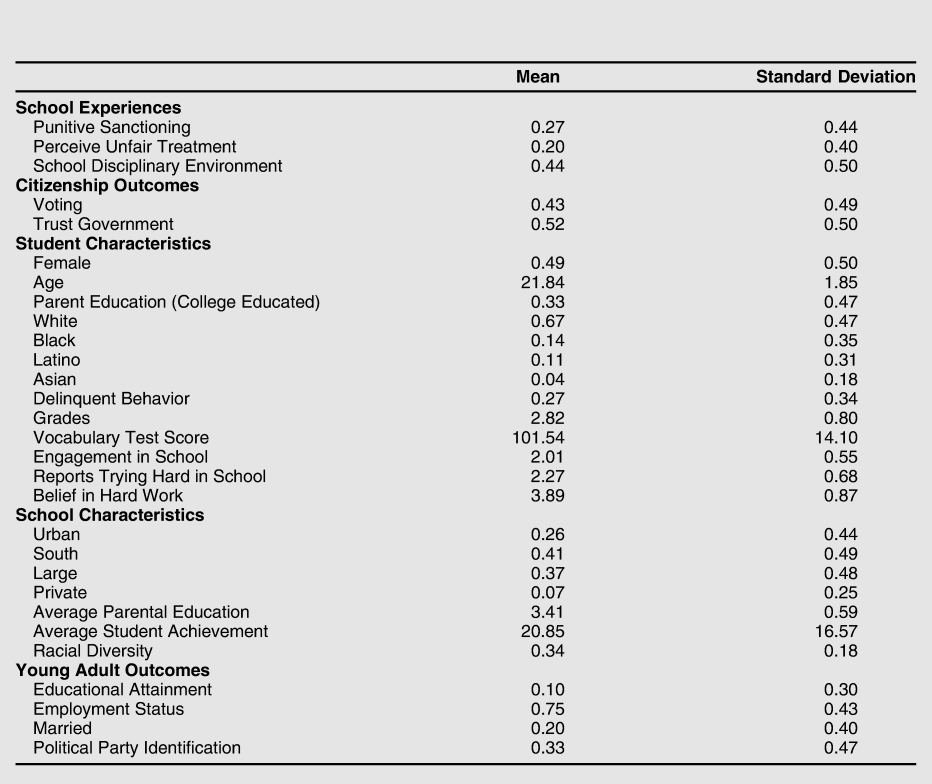
In addition, we include measures of several potentially confounding behaviors and attitudes in our models: behavior deemed delinquent or deviant, experience of a suspension or expulsion prior to middle school, grades, verbal ability, engagement in school, trying hard in school, and belief that hard work is rewarded. Because of their potential to be correlated with school experiences and outcomes of interest, we also include several school characteristics in our models: academic achievement, average parental education, racial diversity, and indicators for region, school type, urbanicity, and size. Finally, to capture young adult status, we employ indicators for identification with a political party, whether the respondent has been married, employment status, and level of educational attainment. Table 1 presents descriptive statistics for all measures, and detailed descriptions of all measures can be found in the Measurement Appendix.
Student and school characteristics

N = 11,875
Empirical Analysis and Results
How Do Social Positions Matter for Experiences of School Authority Relations?
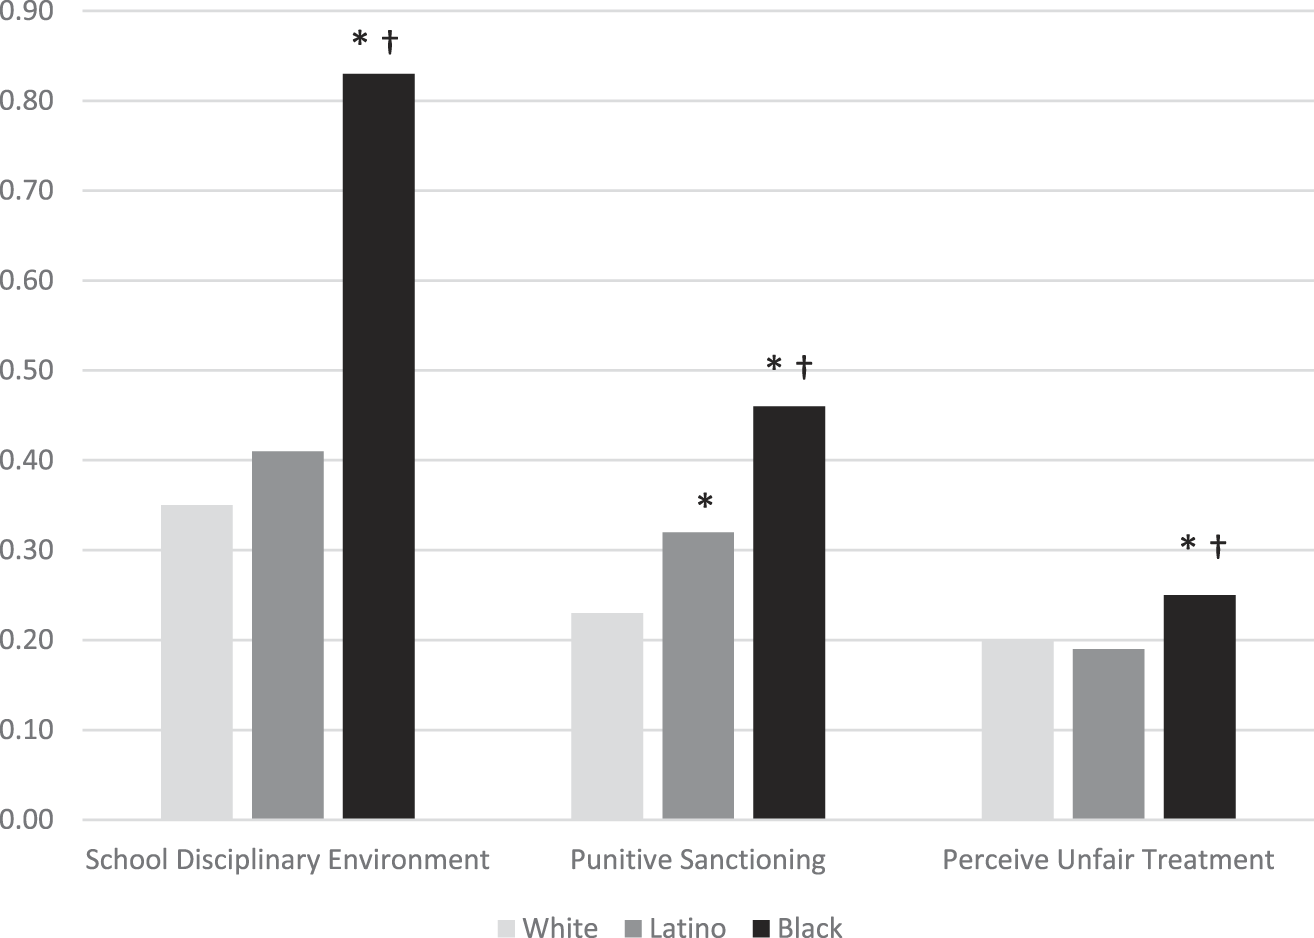
We begin by asking how school experiences vary across student racial identification. Figure 1 shows mean differences for whites, blacks, and Latinos. Across all three measures, black or Latino students are more likely than their white peers to have negative experiences of school authority, in most cases even after accounting for all student and school controls. Footnote 94 The most dramatic disparity arises at the institutional level, where black students overwhelmingly experience more controlling and punitive school environments. While rates for white and Latino students are statistically indistinguishable (35 and 41%, respectively), fully 83% of black students spend their adolescent years in schools with “tougher than average” disciplinary regimes. Footnote 95
Mean racial differences in exposure to authority relations in school
Note: Bars represent the weighted mean value for the group.
* indicates statistically significant difference compared to white (bivariate model)
† indicates statistically significant difference in model adjusting for student demographics (race, gender, parent education, age); student behavior and attitudes (delinquent behavior, grades, vocabulary test score, engagement in school, report of trying hard in school, and belief in hard work); and school characteristics (large, urban, private, south, average parent education, average achievement, and racial diversity).

By unpacking the four components of this measure, one can also see how black students’ experiences vary across disciplinary dimensions. The results are striking, and largely consistent with a nationally representative study by Welch and Payne. Footnote 96 Black students are significantly more likely to attend schools that pursue surveillance and monitoring more aggressively and make more extensive use of suspensions and expulsions. Footnote 97 By contrast, black students are no more likely than others to attend schools with stricter rules for student behavior, and although they tend to go to schools that use harsher penalties, this difference disappears in multivariate analysis (suggesting that it is tied to other student and school factors that vary in racialized ways). Footnote 98
These results suggest the importance of distinguishing formal and practical elements of disciplinary regimes. Racial differences are weaker for formal rules that publicly specify which behaviors are prohibited and how infractions will be punished. They are stronger at the level of disciplinary practice, with black youth tending to go to schools that pursue surveillance and monitoring more aggressively and suspend and expel students at higher rates.
At the individual level, black students are also substantially more likely to be targeted for these sanctions. White students are suspended or expelled least often (23%), with Latino students targeted at a somewhat higher rate (32%). By contrast, 46% of black students personally experience suspensions or expulsions, a rate that is double their white counterparts. Footnote 99 These disproportionate rates of punitive sanctioning for African Americans, and in particular, for black males, remain in analyses that control for misbehavior and teacher-rated behavior problems. Footnote 100
Subjective perceptions of fairness exhibit a less pronounced but still racialized distribution. Consistent with Arum’s research, black students emerge here as significantly more likely than Latino and White students to believe that teachers treat students unfairly in general (25, 19, and 20%, respectively). Footnote 101
To consider race alone in this manner, however, is to obscure how various axes of social differentiation and power may work together in intersectional ways to identify social actors and position them in organized relations. Footnote 102 Thus, rather than examine gender and socioeconomic status (SES) separately—in order to compare or aggregate disparities—we analyze how student experiences vary across intersectionally specific social positions in school relations.
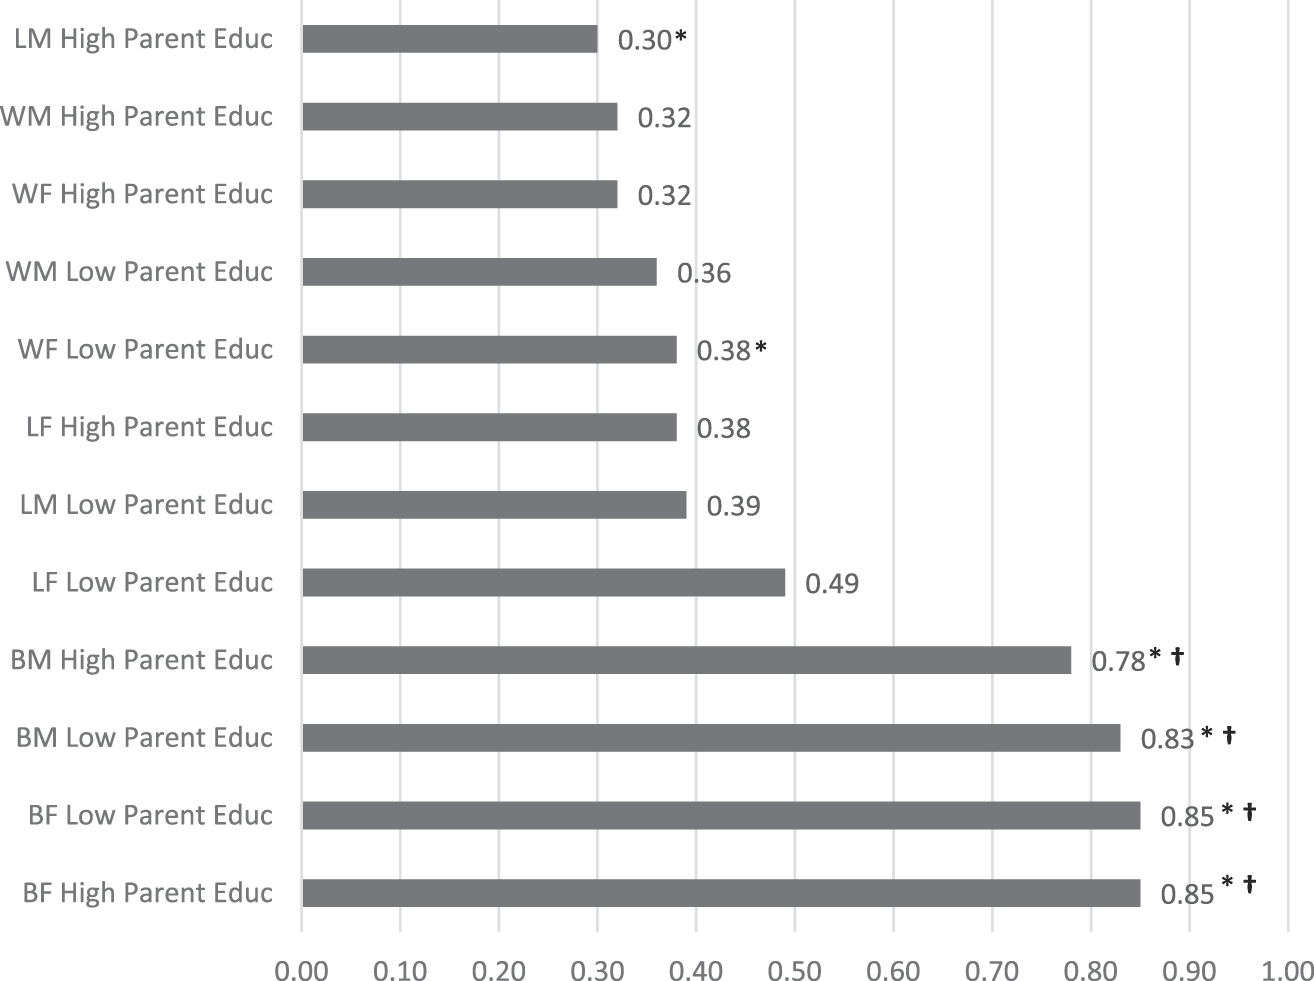
Figure 2 shows how student experiences vary across configurations of race/ethnicity, gender, and family SES. Reinforcing our results, we find a strong racial pattern in exposure to “tough” school disciplinary regimes. Black youth (female and male, low- and high-SES) have the highest rates, ranging from 78 to 85%, while at the other end of the spectrum, white youth exhibit four of the five lowest rates. Latino students are distributed across the mid-range.
Mean intersectional differences in exposure to harsh school disciplinary environment
Note: Bars represent the weighted mean value for the group.
* indicates statistically significant difference compared to white males with high parental education (bivariate model with only intersectional indicator variables)
† indicates statistically significant difference in model adjusting for student demographics (race, gender, parent education, age); student behavior and attitudes (delinquent behavior, grades, vocabulary test score, engagement in school, report of trying hard in school, and belief in hard work); and school characteristics (large, urban, private, south, average parent education, average achievement, and racial diversity).
Full results are available from the authors upon request (or in the online appendix).
WF=white female; WM=white male; LF=Latino female; LM=Latino male; BF=black female; BM=black male

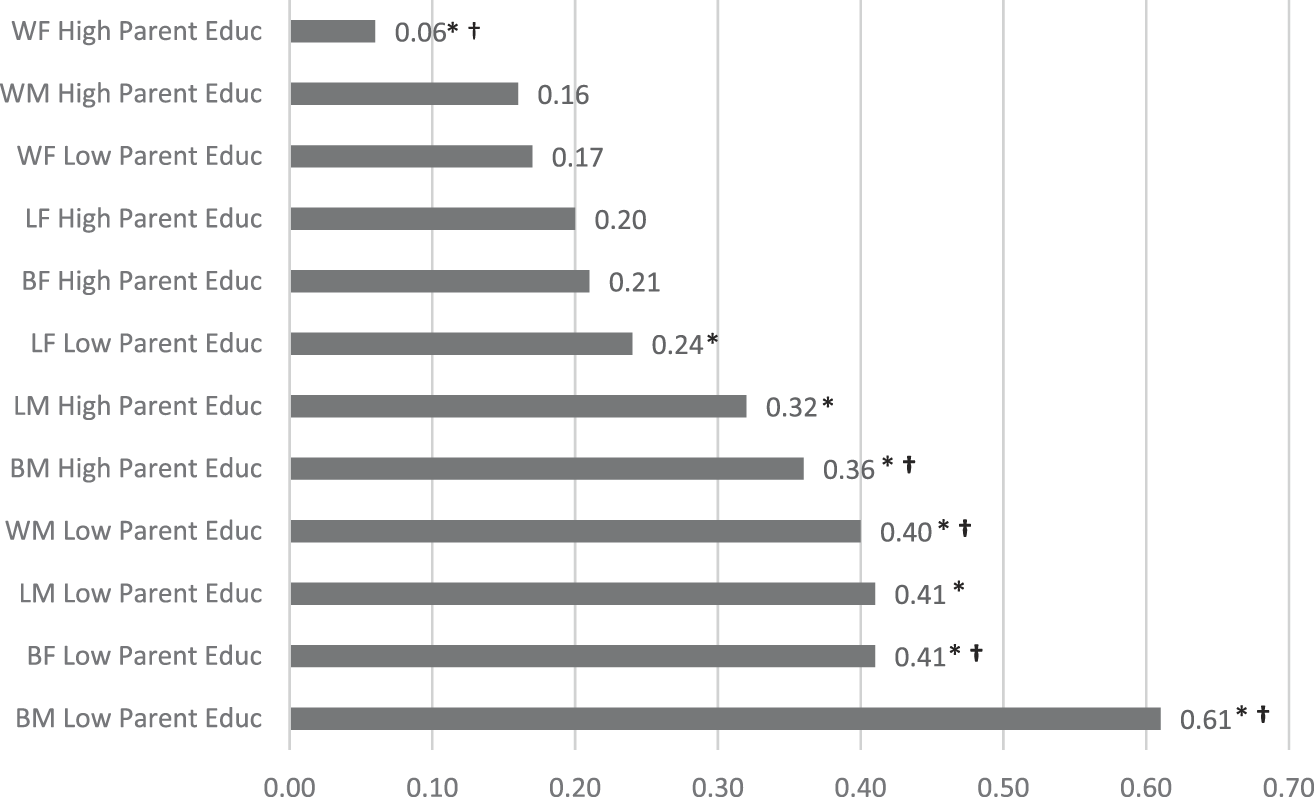
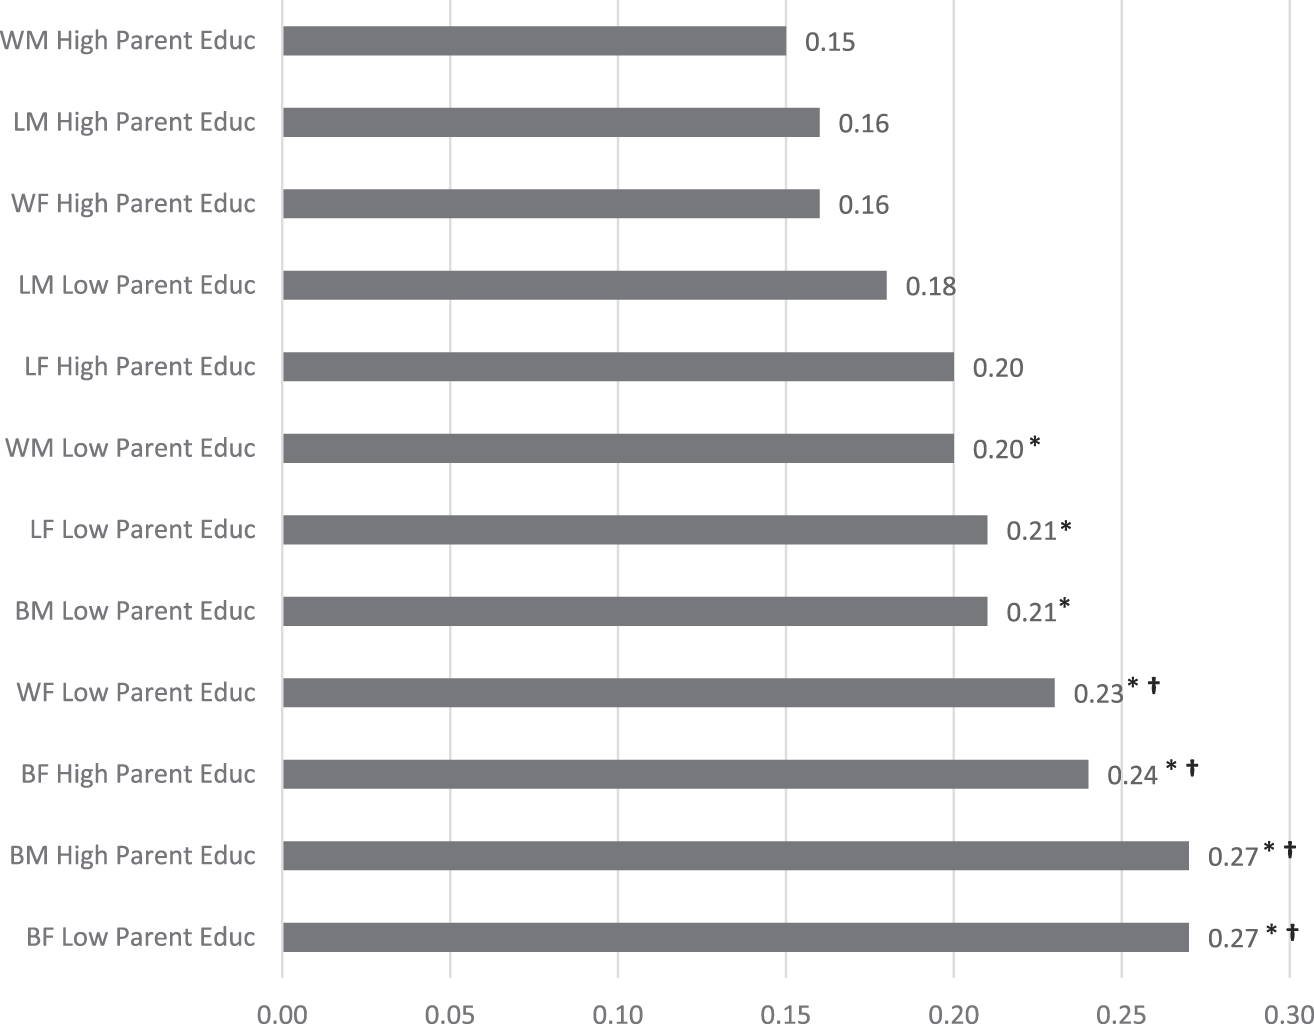
Extending previous evidence that gender moderates the penalization of black students, Footnote 103 figure 3 shows school suspension/expulsion rates for our full set of intersectional social positions. Here, we observe how each social dimension shapes punishment as well as how the three axes work together in conjunctural rather than additive ways.
Mean intersectional differences in exposure to punitive sanctioning
Note: Bars represent weighted mean value for group.
WF=white female; WM=white male; LF=Latino female; LM=Latino male; BF=black female; BM=black male
* indicates statistically significant difference compared to white males with high parental education (bivariate model with only intersectional indicator variables)
† indicates statistically significant difference in model adjusting for student demographics (race, gender, parent education, age), student behavior and attitudes (delinquent behavior, grades, vocabulary test score, engagement in school, report of trying hard in school, and belief in hard work), and school characteristics (large, urban, private, south, average parent education, average achievement, and racial diversity).
Full results are available from the authors upon request (or in the online appendix).

Mean intersectional differences in exposure to perceptions of unfair treatment
Note: Bars represent the weighted mean value for the group.
WF=white female; WM=white male; LF=Latino female; LM=Latino male; BF=black female; BM=black male
* indicates statistically significant difference compared to white males with high parental education (bivariate model with only intersectional indicator variables)
† indicates statistically significant difference in model adjusting for student demographics (race, gender, parent education, age); student behavior and attitudes (delinquent behavior, grades, vocabulary test score, engagement in school, report of trying hard in school, and belief in hard work);and school characteristics (large, urban, private, south, average parent education, average achievement, and racial diversity).
Full results are available from the authors upon request (or in the online appendix).

First, school authorities punish male students far more often than female students. Of the twelve rates shown, five of the lowest six are for females. Yet while males are generally penalized more often, this gender effect evaporates if the males in question are white-identified and come from a higher-SES family. Positioned as a strong, “gender immune” outlier, high-SES white males experience the second lowest rate of punishment for any group, higher only than high-SES white females.
Parental education effects are similarly conditional. Four of the five lowest rates of punishment are observed for high-SES students (ranging from 6 to 21%), while the four highest rates are observed for low-SES students (ranging from 40 to 61%). Yet the punishment-dampening effects of parental education do not provide nearly as much relief for black males: Even when they have highly educated parents, black males get suspended and expelled at a notably high rate of 36% (fifth highest among all groups).
Returning to racial differences, we find that white students (the three lowest rates) and black students (the two highest rates) anchor the poles of the distribution, with Latino students spread across the mid-range. The most striking result, however, can be seen in the outsized targeting of black males from low-SES families. Between grades 7 and 12, 61% of these students are suspended or expelled by school authorities. A number of comparisons underscore this extraordinary targeting. The punishment rate for low-SES black males is 49% higher than even its nearest counterpart (41 percent, for low-SES black females) and 917% higher than the lowest group rate observed (6%, for high-SES white females).
Turning to perceptions of fairness, we see a strongly gendered pattern. Female students make up three of the four groups most likely to believe authority is used unfairly, while male students produce the two lowest rates. In addition, for each race-gender combination, students from low-SES families are more likely to perceive unfair treatment than their high-SES counterparts (with black males as the one exception). For example, 23% of white females from low-SES families perceive unfair treatment in school compared to 16% of white females from high-SES families.
Before moving on, an additional question should be addressed: How are the three experiences related, and to what extent can they be distinguished? Consider the intuition that a school’s disciplinary environment will influence how frequently students get punished and perceive teacher treatment as unfair. We find little evidence that more disciplinary school regimes encourage students to perceive teacher treatment as unfair: Such perceptions are actually quite steady across more and less disciplinary school regimes, with about 80% of students in each saying teachers treat students fairly. More disciplinary school regimes do punish students at significantly higher rates (33 versus 21%, a disparity that falls to 31 versus 23% when aggregate sanction rates are removed from the regime measure). But this gap hardly suggests that individual sanctioning is a straightforward product of disciplinary regime. Indeed, 67% of students in the most-disciplinary school regimes never experience a suspension or expulsion.
Do experiences of school punishment undermine perceptions of teacher fairness? Footnote 104 Students who have been suspended or expelled are, in fact, much more likely to perceive unfair treatment (30% versus 17%). However, the vast majority of students who have been suspended or expelled (70%) do not perceive unfair treatment, and the vast majority of students who perceive unfair treatment (71%) do not report being suspended or expelled. Across the entire sample, just 8% of respondents report both that they experienced a punitive sanction and they perceived unfair treatment by teachers.
These descriptive patterns suggest that while the three aspects of student experience have some degree of interrelation, they can be distinguished quite easily for purposes of analysis. Although they surely fit together in coherent ways for many students, they are separated by enough daylight to draw conclusions about each one’s political consequences.
How Do School Experiences Affect Political Outcomes?
Overall, 43% of respondents report voting in the 2000 presidential election, and 52% report trusting government (refer to table 1). To what extent are these young adult patterns associated with earlier experiences of school authority relations?
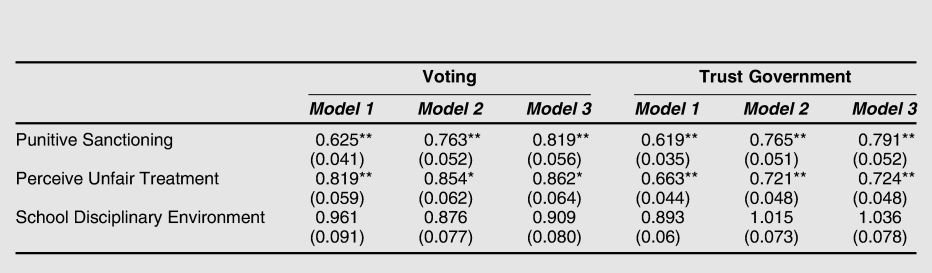
Table 2 reports relevant results from several multivariate models. Given the dichotomous measurement of outcomes, we estimate multivariate logistic regression models. For each outcome, Model 1 includes only school authority experiences; Model 2 adds all student and school characteristics; and Model 3 incorporates young adult experiences acquired since leaving school (i.e., marriage, employment, educational attainment, and partisan identification).
Predicting citizenship outcomes with school experiences

Note: Results are shown as odds ratios with standard errors in parentheses. Model 1 includes the three experiences. Model 2 includes student characteristics: female, race, parent education, age, delinquent behavior, an indicator for previous punitive sanctioning, grades, vocabulary test score, engagement in school, belief in hard work, trying hard in school; and school characteristics: urban, south, average parent education in the school, large school, private school, and racial diversity of the school. Model 3 includes all predictors from Model 2 as well as Wave 3 young adult status: educational attainment, employment, married, and party identification. Full model results are available in the online appendix.
* p < 0.05 ** p < 0.01
All models perform well, demonstrating increased explanatory power with the addition of relevant variables and generating results for school experiences that are robust across specifications. Perhaps the most striking result concerns personalized versus contextual experiences of school authority relations. Schools organize authority relations in ways that may shape all three facets of student experiences. In these analyses, however, we find that experiences of institutional environments (i.e., school disciplinary regimes) generate relatively weak associations compared to the more personal experience of being suspended/expelled or coming to believe that teachers treat students unfairly. The latter two experiences consistently exhibit significant negative associations with both political outcomes, while the measure of school disciplinary environments generates small, statistically insignificant coefficients across all models.
The consistent, independent statistical results underscore the importance of attending to both objective and subjective aspects of personal experiences with school authority relations. The objective experience of being singled out for punishment consistently lowers the odds of voting and trusting government (by 19 and 21%, respectively). Indeed, these associations remain robust even after controlling for later young adult statuses that are powerful predictors of these outcomes (e.g., partisanship and educational attainment). These results, which are consistent with previous studies of punitive experiences in criminal justice and social welfare settings, Footnote 105 provide novel evidence that school disciplinary practices are associated with later political marginalization.
The subjective perception of unfair treatment has an independent association even after controlling for punishment and school disciplinary regime lowering the odds of voting by 14% and the odds of trusting government by 28%. Footnote 106 Extending previous evidence that experience-based perceptions of bureaucratic fairness tend to predict broader assessments of government, Footnote 107 these results suggest that young adults may carry their school-based evaluations of authority with them into young adulthood, and generalize them to government as a whole. Because these results emerge from simultaneous estimation, we interpret them as evidence that subjective and objective experiences of authority relations are each politically formative school experiences in their own right, with analytically separable implications for later political life.
Two features of this analysis diminish our concerns that these associations might be spurious. First, one might worry that the results for school experiences simply reflect underlying propensities for success in school, consistent with studies of political behavior that do not consider school authority relations. Here, we note that our multivariate models include an array of control variables designed to guard against just this possibility—not only demographic and school characteristics but also parental education, student grades, vocabulary test scores, student engagement in school, and students’ beliefs that they try hard in school. In addition, Model 3 generates highly consistent results controlling for overall educational attainment. Indeed, insofar as the addition of young adult status (such as educational attainment, employment, marital status, and party identification) might introduce a degree of post-treatment bias, one would expect this bias to reduce the estimated coefficients for experiences of school-based authority relations. That the associations are so robust to the inclusion of these measures should bolster confidence in the inferred relationships. Although observational data never permit a decisive rejection of spuriousness, these controls are both more comprehensive and more fine-grained than one usually finds in studies of political behavior.
Second, one might worry that the school experience results actually reflect unobserved differences in the broader institutional experiences of the most marginally positioned students. Black males with low parental education, who have the worst school experiences, are also more likely than their peers to have negative authority experiences across a range of institutional and social settings. Is this broader (unmeasured) experience all that is being captured by our school-specific measures? To assess this possibility, we estimated our full multivariate models for race-specific samples, looking for evidence that negative school experiences are restricted to the most subordinate social groups (who are more likely to have negative experiences beyond schools).
As described earlier, racially and intersectionally defined groups vary systematically in their school authority experiences. However, the significant relationships between earlier school experiences and later citizenship outcomes are not limited to the most disadvantaged social groups. Indeed, to the extent that we observe any variation in coefficients across groups, we find the strongest associations among white students—a pattern that runs directly counter to the logic of our concern regarding spuriousness. (Full results are available from the authors upon request.)
Finally, there is the critical question of how the associations found here should be seen in relation to the associations with educational attainment that are the focus of most political behavior research. First, in separate analyses, we find that school authority experiences not only precede but also significantly predict eventual educational attainment (obtaining at least a four-year bachelor’s degree) above and beyond a full slate of controls that includes strong predictors such as parental education, student grades, vocabulary test scores, student engagement in school, and students’ beliefs that they try hard in school (full results are available on request). This finding suggests that educational attainment may serve, in part, as a mediating variable in the relationship between school authority experiences and later political attitudes and behaviors. Thus, positive correlations between educational attainment and political engagement (conventionally interpreted in terms of acquired skills, knowledge, and resources) may actually capture experiences of school authority relations.
Second, even if one sets aside this mediating relationship, a direct comparison of coefficients suggests the political importance of both educational factors. In our fullest specification (Model 3), possessing at least a four-year bachelor’s degree is associated with a 47% increase in the odds of voting and an equally strong association on the odds of trust in government. When combined, the two personal authority experiences produce associations of comparable magnitude: a 32% reduction in the odds of voting and a 49% reduction in the odds of trust in government. Given the “dominant role” of educational attainment as a predictor in political behavior research, Footnote 108 these results suggest that experiences of school authority relations meet a high standard of substantive significance and merit considerably greater attention than they have received in the subfield to date.
Schooling for a More Democratic Polity
“It is inevitable that we live within constructed and formative institutions,” Stephen Macedo and colleagues write; “there is no alternative.” Footnote 109 A perennial task for those who value democracy, then, is to critically interrogate how our institutions operate in politically formative ways, for whom, and to what effect. Nowhere is this task more urgent than in the area of formal education. Few observers today would disagree that schools “make citizens”—and advantage some citizens over others—by distributing political knowledge and politically consequential skills, resources, and opportunities in unequal ways. Accepting this view as well substantiated, we have presented reasons in the preceding pages to believe it is also significantly incomplete. To focus solely on the forms of human capital that citizens acquire as they pass through schools is to significantly understate the politically productive nature of schooling as a formative political experience.
The schoolhouse is far more than a pre-political site for the distribution of things—forms of politically relevant “human capital”—that citizens put to use later in life. Drawing on a variety of scholarly traditions, we have sought to return attention to schools as sites where citizens have their earliest formative experiences of how authorities behave, how civic institutions work, and what it means to participate in a rule-governed community of putative equals. As John Dewey cautioned long ago, even the most vigorously pro-democratic curriculum of formal instruction may be trumped by contrary experiences in the organized daily operations of school communities. Footnote 110 From this perspective, schools may be integrated into the broader study of policy feedback, where scholars traditionally complement analyses of what government institutions distribute (e.g., welfare benefits or arrests) with analyses of the political relations, experiences, and lessons they construct.
Charles Tilly argues that societal policies and institutions may be seen as democratizing, to the extent that they diminish the effects of social inequalities on civic status and political relations. Footnote 111 Judged by this standard, our findings raise troubling questions. Experiences of school authority relations closely track the positions students occupy in broader social hierarchies, operating in intersectional ways that concentrate negative experiences among the most disadvantaged. Indeed, our analysis of school authority experiences underscores how researchers may misconstrue citizen politics if they ignore the insights of intersectional theorizing. Negative experiences of school authority, in turn, have significant marginalizing effects on citizens’ later electoral participation and trust in government. In this respect, schools appear to operate as institutional mechanisms that convert social hierarchies into predictable patterns of political inequality and civic marginalization.
These troubling political dynamics are rendered invisible by political analyses that focus narrowly on educational attainment, just as they remain obscure in educational debates that privilege test scores and other indicators of whether students “get what they should” from school curricula. Footnote 112 They are also quite distant from the concerns that have animated the turn toward more authoritarian and punitive modes of school governance in recent decades. In this sense, they are analogous to the “collateral consequences” of criminal justice punishments, which remained obscure until researchers began to document their systematically corrosive effects. As David Kirk and Robert Sampson argue, “there may be unintended negative repercussions from the use of suspension and expulsion as a tool for promoting school safety . . . Much like the case for adult punishment, the [negative] collateral consequences of policies and practices designed to promote school safety need to be weighed against the potential benefits.” Footnote 113
Like John Dewey before us, and contemporaries such as Benjamin Justice and Tracey Meares, Footnote 114 we find compelling reasons to believe that democratization of the polity will depend, at least in part, on efforts to make schools more just and democratic in their own right. An obvious first step would be to scale back the heavy reliance on punitive sanctions to maintain order in schools and, more generally, to reduce the “criminalization” of school authority relations. Footnote 115 Within this broader effort, reforms should seek to reduce disproportionalities in the terms and targeting of school disciplinary practices, Footnote 116 and do so in ways that explicitly address intersectional dynamics. School roles could be defined in a more explicitly civic manner, with students given more opportunities to solve problems collaboratively (with peers and authority figures) and to participate in consequential decision-making processes. Rather than defining and imposing a “positive school culture,” school authorities might call on students to grapple with (and thus, experience firsthand) the challenges of fostering equal respect in a way that acknowledges social inequalities, building solidarity while valuing social diversity, and so on.
Efforts to shift from punishing violations to repairing harms and promoting school-community incorporation (what are often called “restorative justice” approaches) strike us as particularly promising models for integrating and advancing these agendas. Footnote 117 But ultimately they must be understood as just one area of intervention in a more complex field of political relations. The question of how to build and sustain a democratizing school is no less difficult than the question of how to build and sustain a democratic polity—and perhaps just as subject to disagreement. The critical point for our purposes is that the two questions are inseparable.
Supplementary Materials
-
1. Additional details on the measures
-
2. Full model results