1. Introduction
Food prices go beyond the direct costs, and the true cost of food includes hidden costs or externalities spanning environmental impactsFootnote 1 (e.g., deforestation, land degradation), social harm (e.g., child labour, inadequate workplace safety) and health burdens (e.g., heart disease, pesticide poisoning). This study reveals the true costs of food production in Kenya and Viet Nam, two low- and middle-income countries (LMICs) with a supportive enabling environment to address externalities. By comparing distinct farming, agroecological and market systems, the analysis provides empirical evidence on how contrasting food systems generate and distribute external costs. The research addresses two questions: (a) What are the true costs of food production in Kenya and Viet Nam, including gender-disaggregated impacts? (b) How do cost structures vary by externality type and country context?
Many countries fall short of delivering food security and nutrition without compromising economic, social or environmental goals (United Nations, 2023), because agrifood systems (AFSs) generate substantial, unaccounted-for costs (FAO et al., 2020; UNFSS Scientific Group, 2021). These hidden costs undermine sustainability and distort market signals, making it difficult for policymakers to design effective interventions. A critical step towards reform is quantifying these externalities to inform pricing mechanisms and policy responses (Baker et al., Reference Baker, Castilleja, De Groot Ruiz and Jones2020; von Braun and Hendriks, Reference von Braun and Hendriks2023).
Several analytical frameworks seek to quantify AFS externalities. Ecosystem service valuation and natural capital accounting monetize environmental degradation and changes in wealth (Costanza et al., Reference Costanza, D'arge, De Groot, Farber, Grasso, Hannon, Limburg, Naeem, O'neill, Paruelo, Raskin, Sutton and Van Den Belt1997; Arrow et al., Reference Arrow, Dasgupta, Goulder, Mumford and Oleson2012), while life cycle assessment and global environmental modelling frameworks quantify biophysical impacts across supply chains (Tilman et al., Reference Tilman, Balzer, Hill and Befort2011; Clark and Tilman, Reference Clark and Tilman2017; Poore and Nemecek, Reference Poore and Nemecek2018). Social life cycle assessment has further attempted to capture labour and human rights impacts (Dreyer et al., Reference Dreyer, Hauschild and Schierbeck2005).
Early assessments of pesticide use and agricultural runoff quantify health-related damages using cost-of-illness and willingness-to-pay approaches (Pretty et al., Reference Pretty, Brett, Gee, Hine, Mason, Morison, Raven, Rayment and van der Bijl2000; Tegtmeier and Duffy, Reference Tegtmeier and Duffy2004). Environmentally extended input–output models have also been used to trace environmental impacts and attribute them to final consumption (Tukker et al., Reference Tukker, de Koning, Wood, Hawkins, Lutter, Acosta, Rueda Cantuche, Bouwmeester, Oosterhaven, T and Kuenen2013). While powerful at national and global scales, such approaches often abstract from household-level behavioural drivers and labour conditions within agricultural production. Overall, these approaches are rarely integrated into a unified framework that simultaneously monetizes environmental and social externalities at both national and farm levels in LMICs.
True cost accounting (TCA) offers a framework to address this gap. By integrating environmental, health and social externalities into food system analysis, TCA provides a more holistic estimate of the real cost of food. Rooted in The Economics of Ecosystems and Biodiversity (TEEB) agrifood evaluation framework (TEEB, 2018), it enables structured assessments of the impacts that conventional economic models often overlook (Gundimeda et al., Reference Gundimeda, Markandya and Bassi2018; Müller and Sukhdev, Reference Müller and Sukhdev2018; True Cost Initiative, 2022). Despite growing interest, TCA applications remain constrained by data limitations – especially in LMICs. Indeed, our analysis excludes health costs, being limited to social and environmental indicators due to costs and unavailability of data.
Most existing studies rely on national-level data (e.g., FAO, 2023). Others focus on specific crops or regions, such as coffee in Colombia (Impact Institute and IFPRI, 2024a), Kenya (Impact Institute and IFPRI, 2024b) and Viet Nam (Verkooijen et al., Reference Verkooijen, de Groot Ruiz and Fobelets2016). In Kenya, social costs were found to be relatively higher than environmental costs. In Colombia, while there was less of a gap between social and environmental costs, social costs were relatively higher. By contrast, 95 per cent of the total external costs in Viet Nam were environmental, with 28 per cent of that caused by over-irrigation.
Country-level studies have occurred in high-income countries, e.g., in the United Kingdom (Fitzpatrick et al., Reference Fitzpatrick, Young, Barbour, Perry, Rose and Marshall2019) and United States (Rockefeller Foundation, 2021). In the United Kingdom, hidden costs double every pound spent directly. Most of these externalities stem from intensive production methods causing environmental impacts. Health costs contributed relatively less. In the United States, health and environment were also the main external costs, amounting to three times the current expenditure on food. At the global level, health costs were prominent (especially in high- and middle-income countries), and environmental costs constituted 20 per cent of hidden costs (FAO, 2023).
This study advances the literature by estimating the true cost of food production in two LMICs, Kenya and Viet Nam, using a multi-tiered data approach. We collect microdata through household-level and worker-level surveys. In addition, we use national-level data from the Global Impact Database (GID), providing macro-level results that are fully generalizable. In each country, estimates are computed separately at household and national levels. In Kenya, field-level data were collected in Kajiado, Kisumu and Vihiga Counties. In Viet Nam, data were collected in Lào Cai and Sơn La Provinces.
While the microdata from the household and worker surveys are not generalizable, these results offer a solid contribution to the empirical literature, especially for LMICs, through the analysis of underlying causes and behavioural foundations of the externalities at the farmer- and worker-level.
Our analysis reveals that externalities equal about 35 per cent of Kenya's agrifood output – mainly social – and 15 per cent in Viet Nam, largely environmental. In crop sectors, they represent 27 per cent in Kenya and 11 per cent in Viet Nam, with the same dominance patterns. At project sites, external costs (excluding health) are 30 per cent of production costs in Kenya and 24 per cent in Viet Nam. Kenya's high labour costs and lower yields contrast with Viet Nam's higher yields but greater environmental burdens. Quantifying these hidden costs guides more sustainable and equitable food-system investments.
The remainder of the article is organized as follows. Section 2 outlines the TCA framework. Section 3 describes the data sources, and Sections 4 and 5 present findings at the national and farm level. Section 6 concludes and discusses policy implications, and Section 7 discusses limitations and future research directions.
2. The TCA framework
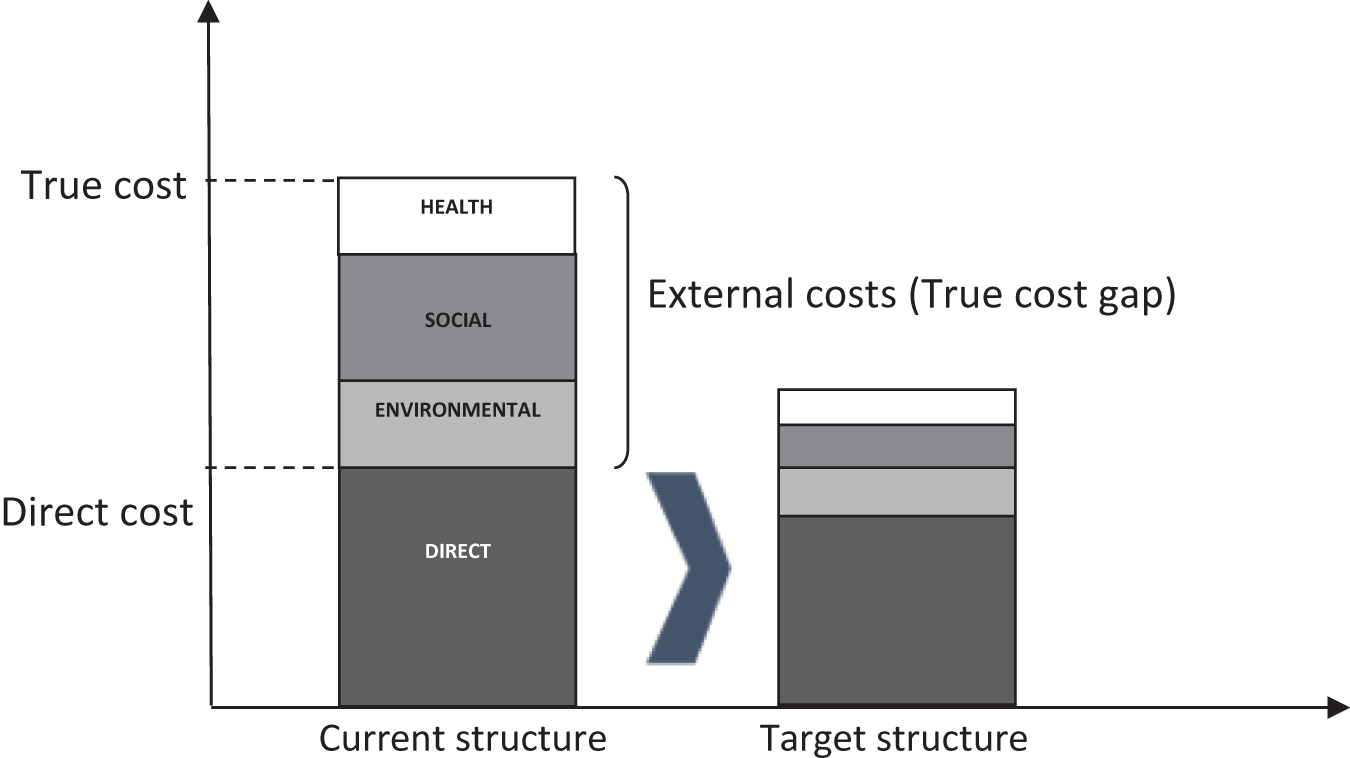
TCA provides a holistic framework for assessing both direct and external costs of food production. It goes beyond market prices to include environmental, social and health costs (Figure 1). Although food systems may generate positive externalities, TCA focuses solely on negative externalities.Footnote 2 The full methodology is detailed in Benfica (Reference Benfica2024).
The true costs of food.
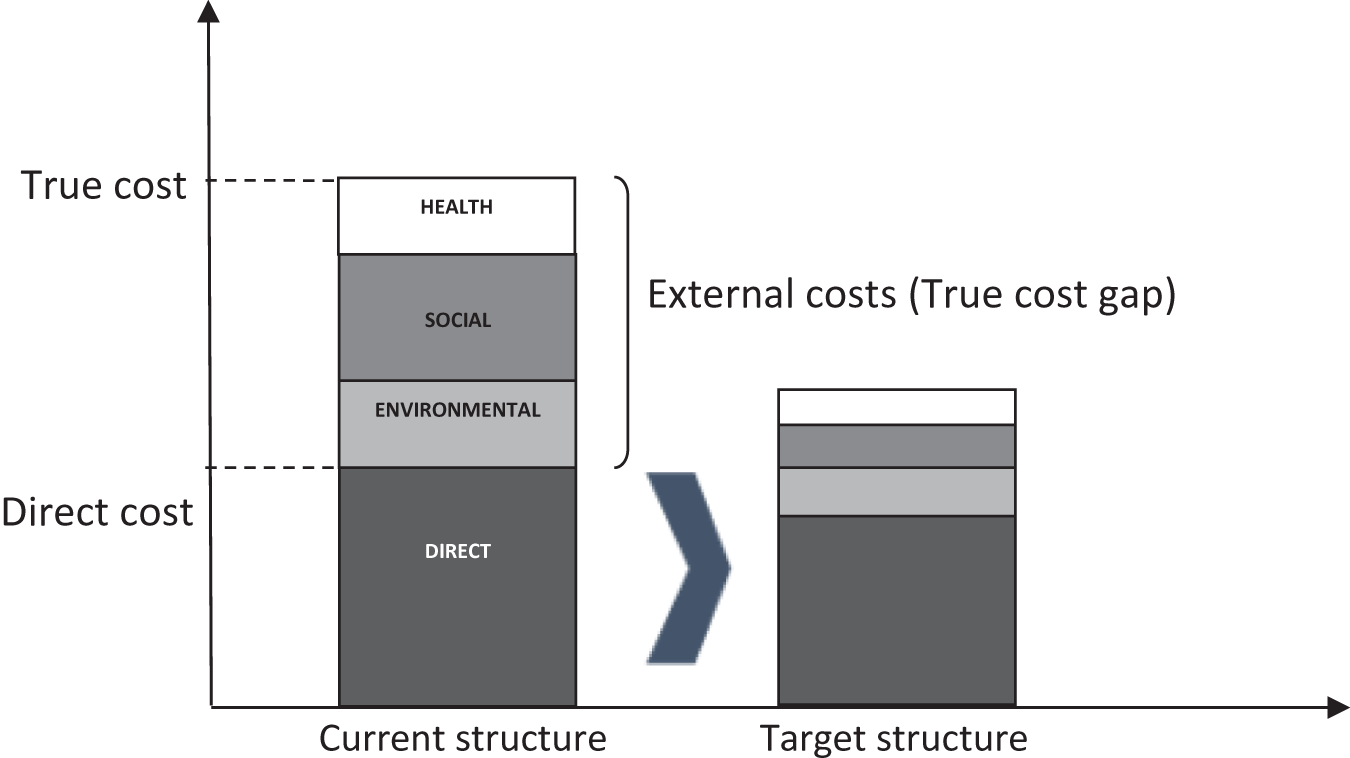
Figure 1 Long description
The figure presents the conceptual framework of true cost accounting, linking natural, human, social and produced capital. It shows how agricultural production generates both direct costs captured in market prices and external costs related to environmental and social impacts.
2.1. TCA methodology
The TCA approach is grounded on True Price methodology (True Price, 2020, 2021c) and the TEEB Agrifood Evaluation Framework (Gundimeda, et al., Reference Gundimeda, Markandya and Bassi2018; True Cost Initiative, 2022). It links four types of capital in AFSs: natural, human, social and produced. The first three form the core of the framework, capturing externalities not reflected in market prices. Produced capital, by contrast, represents direct production costs already accounted for in conventional financial reporting.
This study focuses on external costs tied to natural, human and social capital. Supplementary Appendix Figure A1 illustrates the TCA structure – stocks, flows, outcomes and impacts – based on the TEEB framework (TEEB, 2018; True Cost Initiative, 2022). Natural, human and social capital capture environmental and labour-related externalities, such as pollution, soil degradation, wage gaps and labour rights violations, while produced capital reflects market-based costs already accounted for in prices. Addressing these externalities through mitigation and social interventions can improve sustainability, worker welfare and equity.
Each of the three types of capital critical to our analysis is associated with externality types (environmental and social) that in turn aggregate a set of impact categories and indicators. Table 1 shows the indicator definitions for the different types of capital (stocks) and the associated outcomes – that is, the changes in the condition of their stocks due to value chain activity (True Cost Initiative, 2022). Note that health externalities are excluded from this analysis.
Key findings from the Global Impact Database analysis
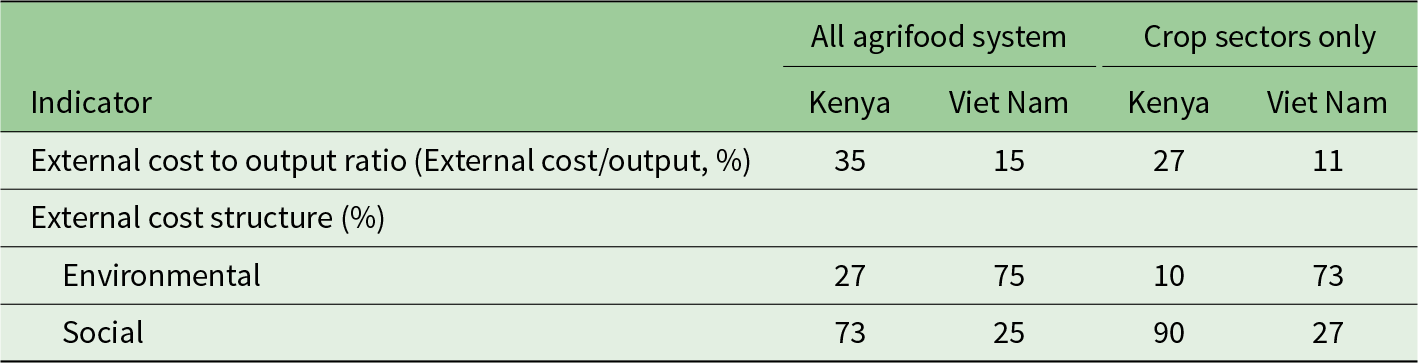
Table 1 Long description
The table compares external costs as a share of output and the split between environmental and social impacts for Kenya and Viet Nam, shown for the full agrifood system and for crop sectors only. For the full agrifood system, external cost to output is 35 per cent in Kenya and 15 per cent in Viet Nam. In crops only, the ratio is 27 per cent in Kenya and 11 per cent in Viet Nam. The composition differs sharply: in the full agrifood system, Kenya’s external costs are mainly social at 73 per cent, while Viet Nam’s are mainly environmental at 75 per cent. In crops only, Kenya is even more social-heavy at 90 per cent, while Viet Nam remains environmental-heavy at 73 per cent. These figures summarize estimated impacts and should be interpreted as model-based calculations rather than direct measurements.
Note: * E = environmental impact; S = social impact; PCI = procurement chain impact.
Source: Authors’ own calculation using the Global Impact Database.
2.2. Analytical steps in TCA
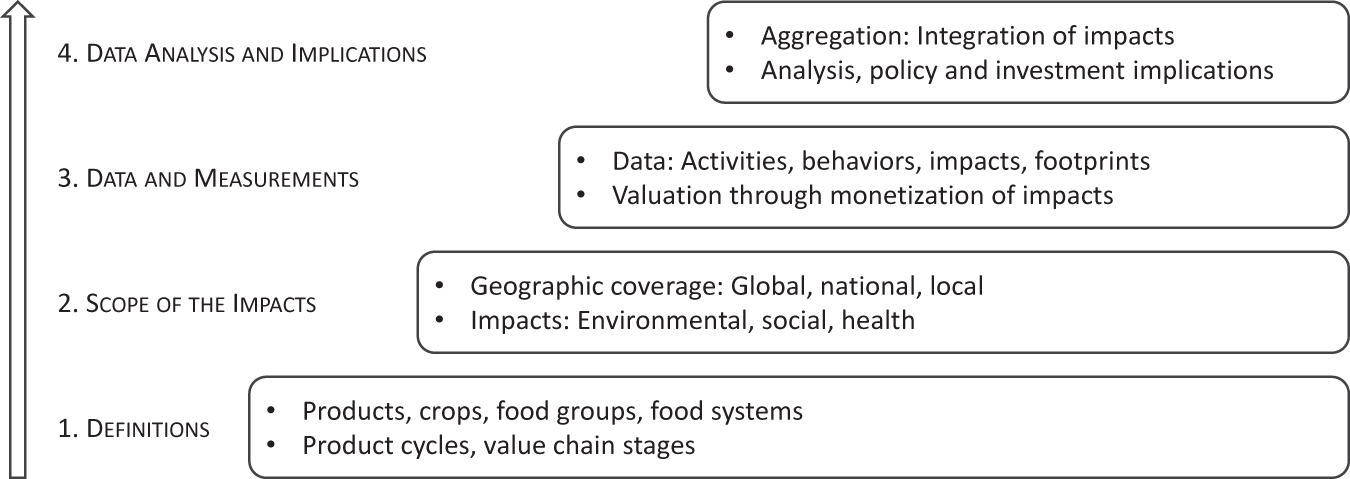
The TCA framework involves several steps (Figure 2). Step 1 defines the scope of the analysis, identifying products, crops or food groups under scrutiny, and mapping the production and value-addition processes. Step 2 defines the geographic and impact boundaries.
Key steps in the true cost accounting assessment.
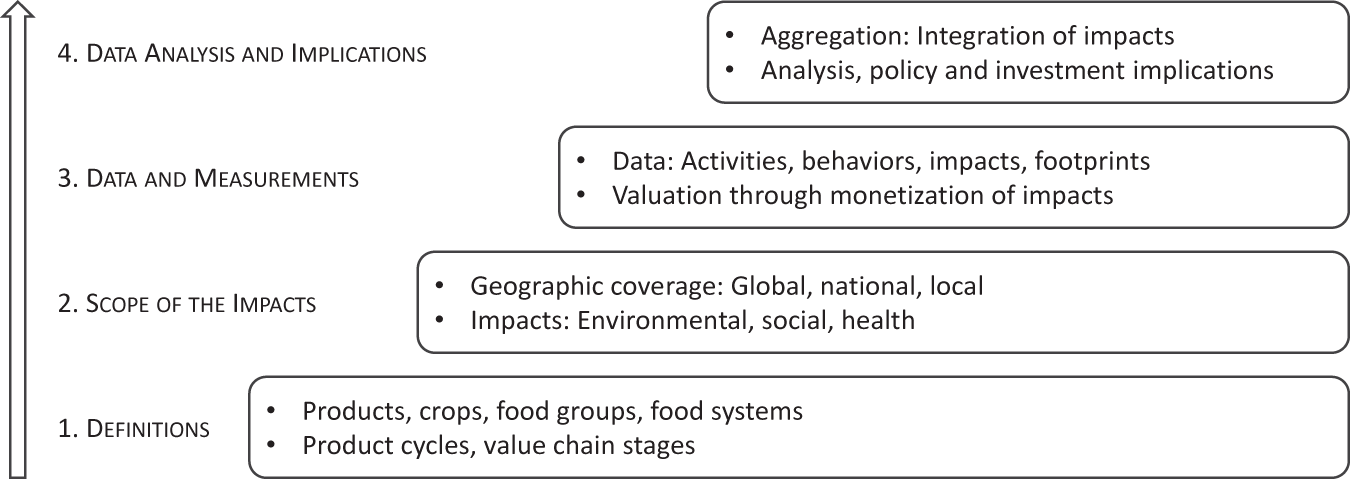
Figure 2 Long description
The figure presents the sequence of analytical steps in TCA, including defining scope, identifying impacts, measuring footprint indicators, applying monetization factors and aggregating results into total external costs.
Step 3 involves identifying, quantifying and monetizing externalities using monetization factors (MFs) (True Price, 2021b). First, impact/footprint indicators (FPIs) are identified by type – environmental or social – as shown in Supplementary Appendix Table A1.
Data are collected through surveys with farmers (environmental domain) and workers (social domain), using indicator-specific units. Once measured, impacts are valued in monetary terms using MFs – unit cost factors that convert footprints into external costs. Valuation accounts for restoration and compensation costs (True Price, 2021a).Footnote 3 Where full restoration is not feasible, especially for social externalities, compensation or penalty values are applied. External cost for each impact category (ECi) is calculated as: ECi = FPIi × MFi, where i represents impact categories as listed in Table 1, ranging from ‘1 = climate change’ to ‘10 = scarce water use’ for environmental externalities and from ‘11 = workplace safety’ to ‘16 = forced labour’ for social externalities.
The final step consists of aggregation and integration of impacts. To get the costs by type of externality – environmental (ECE) and social (ECS) – the external costs are aggregated to that level. Formally, the steps can be represented as:
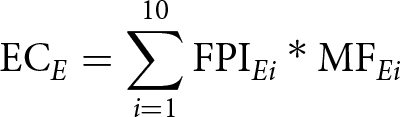 \begin{equation}{\text{ E}}{{\text{C}}_E} = \mathop \sum \limits_{i = 1}^{10} {\text{FP}}{{\text{I}}_{Ei}}*{\text{M}}{{\text{F}}_{Ei}}\end{equation}
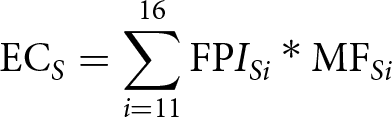 \begin{equation}{\text{ E}}{{\text{C}}_S} = \mathop \sum \limits_{i = 11}^{16} {\text{FP}}{I}_{{Si}}*{\text{M}}{{\text{F}}_{{Si}}}\end{equation}
The total value of the externalities (ECT) is given by ECT = ECE + ECS. At this point, the data can be combined and analysed to establish and compare the structure and distribution of the costs of food, including externalities, and to strategize on what alternative scenarios of policies, programmes and investments would be needed to promote changes towards a more sustainable cost structure in the food system.
3. Data
We use micro- and macrodata to estimate the true costs of crop production in Kenya and Viet Nam. Primary microdata were collected through two surveys for farming households and farm workers. Secondary macro-level data were drawn from the GID (Impact Institute, 2024) and MFs (True Price, 2021b), specific to each country. While the household-level analysis excludes livestock due to missing disaggregated cost data, livestock-related results are incorporated at the national level in the GID estimates.
3.1. Primary data
The farming household-level survey captures production and cost structures, enabling estimation of direct and indirect farming costs. The sample represents small-scale producers in CGIAR's Nature-Positive Solutions (NATURE+) implementation sites, with sample sizes determined through statistical power calculations. NATURE+ supported biodiversity conservation and management, restoration, and recycling and a circular economy. NATURE+ sites were selected for the importance of agriculture, presence of high biodiversity, risk of degradation and loss of biodiversity, enabling policy environment, partner presence and geographic variation.
We chose Kenya and Viet Nam sites for the TCA analysis firstly due to the dearth of TCA data in LMICs. Second, we took advantage of baseline data collection under NATURE+ to include TCA dimensions. Third, both countries had a supportive enabling environment for TCA goals. Finally, we wanted to compare countries in Africa, Asia and South America (a TCA analysis is underway in Colombia), comparing diverse farming, agroecological and market systems.
In Kenya, the survey was conducted in 2023 in Kisumu, Vihiga and Kajiado counties, covering 1,502 randomly selected households. Site selection was guided by NATURE+ partners on the ground. In Viet Nam, the survey covered 1,150 households in 23 villages in Sa Pa (Lào Cai province) and Mai Son (Sơn La province). For sampling details, see Boukaka et al. (Reference Boukaka, Azzarri, Davis and De Falcis2024a, Reference Boukaka, Azzarri, Davis and De Falcis2024b). Supplementary Appendix Figure A2 maps the study locations.
Recognizing limitations of the household survey to capture certain aspects of worker rights and working conditions,Footnote 4 we implemented a separate survey for farm workers who had worked for the household in the past 12 months. This survey captures indirect costs linked to social externalities in agricultural labour. The final sample included 1,056 workers in Kenya and 334 in Viet Nam (49 in Sa Pa and 285 in Mai Son). In Viet Nam, especially Sa Pa, limited hiring and reliance on exchange labour constrained the sample size, reducing statistical reliability for some TCA social indicators. Nonetheless, descriptive statistics offer valuable insights. Supplementary Appendix Table A2 defines the TCA indicators, and Supplementary Appendix Table A3 maps survey content to TEEB capital categories. For sampling details, refer to Boukaka et al. (Reference Boukaka, Azzarri, Davis and De Falcis2024a, Reference Boukaka, Azzarri, Davis and De Falcis2024b).
3.2. Secondary data
This study uses secondary data from the GID, compiled by the Impact Institute (2024). The GID provides monetized estimates of value chain impacts (VCIs) and procurement chain impacts (PCIs) across economic, social and environmental dimensions. Data sources include scientific databases, impact literature, trade statistics and environmental, social and governance datasets.
For Kenya and Viet Nam, the study draws on GID data covering 19 sectors and 12 impact categories (see Supplementary Appendix Table A4). Additionally, MF data from True Price (2021b) are used to convert survey-based FPIs into monetary values, covering 88 indicators across 21 categories.
4. Findings from the national-level analysis
The nationally representative analysis uses the GID to examine the relative importance and magnitude of environmental and social externalities, explore how economic sectors are ranked and externalities structured within each sector and identify the overall ranking of environmental and social impact categories. It also assesses how externalities are distributed along value chains – across upstream, direct and downstream stages – and investigates the ways in which individual impact categories shape value-chain dynamics across these same stages. The analysis assesses the full AFS, then focuses on seven key crop sectors to align with smallholder cost analysis in Section 5. It examines external social and environmental costs across the entire AFS and crop-only sectors (Table 1). Results are presented separately for each country and then contrasted to highlight differences in magnitude, rankings and structure of externalities.
4.1. Environmental and social externalities in the AFS
In this section, we assess both the scale and the relative importance of environmental and social externalities across the AFS. First, we look directly at the PCI that represents the value in US$ purchasing power parity ($PPP)Footnote 5 of the externalities per $ of output (marginal measure). Then, we look at the actual magnitude of the externalities accounting for the value of output of the sectors (size) and compare the relative importance of the sectors by looking at the share of the external costs (in $PPP) in the total output in the AFS (adjusted to $PPP). We thus have three measures: (a) share of total externalities out of total AFS output, (b) relative weight of social vs. environmental externalities and (c) ranking of sectors by total externalities weighted by the externality type.
Considering the entire AFS, in Kenya, social and environmental externalities account for 35 per cent of the AFS output value. A greater share of those costs is social (73 per cent) when compared with environmental (27 per cent). When we isolate the crop sectors, the share of all externalities in output falls to 27 per cent, and the relative importance of the social externalities is even greater, amounting to about 90 per cent of all externalities (Table 1).
In Viet Nam's AFS, in contrast, total externalities represent only 15 per cent of the output value, and environmental externalities (75 per cent) dominate social externalities. Looking at the crop sectors alone, we find that total externalities fall to about 11 per cent of output, without a significant change in the relative importance of the externality types; that is, environmental externalities continue to represent about three-quarters of all externalities (Table 1).
Ranking of sectors by unit footprint, that is, per $ of output, shows that livestock leads in both countries. Adjusting for sector size, results in Figure 3 reveal that in Kenya, cattle, cereals/grains and noncereal crops are major contributors to externalities. In Viet Nam, rice dominates due to its large output share, followed by food products and other crops. Despite livestock's high unit impact, its smaller output share lowers its overall contribution. Social externalities outweigh environmental in Kenya across most sectors, except livestock. This result reflects labour-intensive practices and poor working conditions in food production.
Ranking of sectors and composition of externalities, all sectors [total external costs (total footprint, $ billion)].
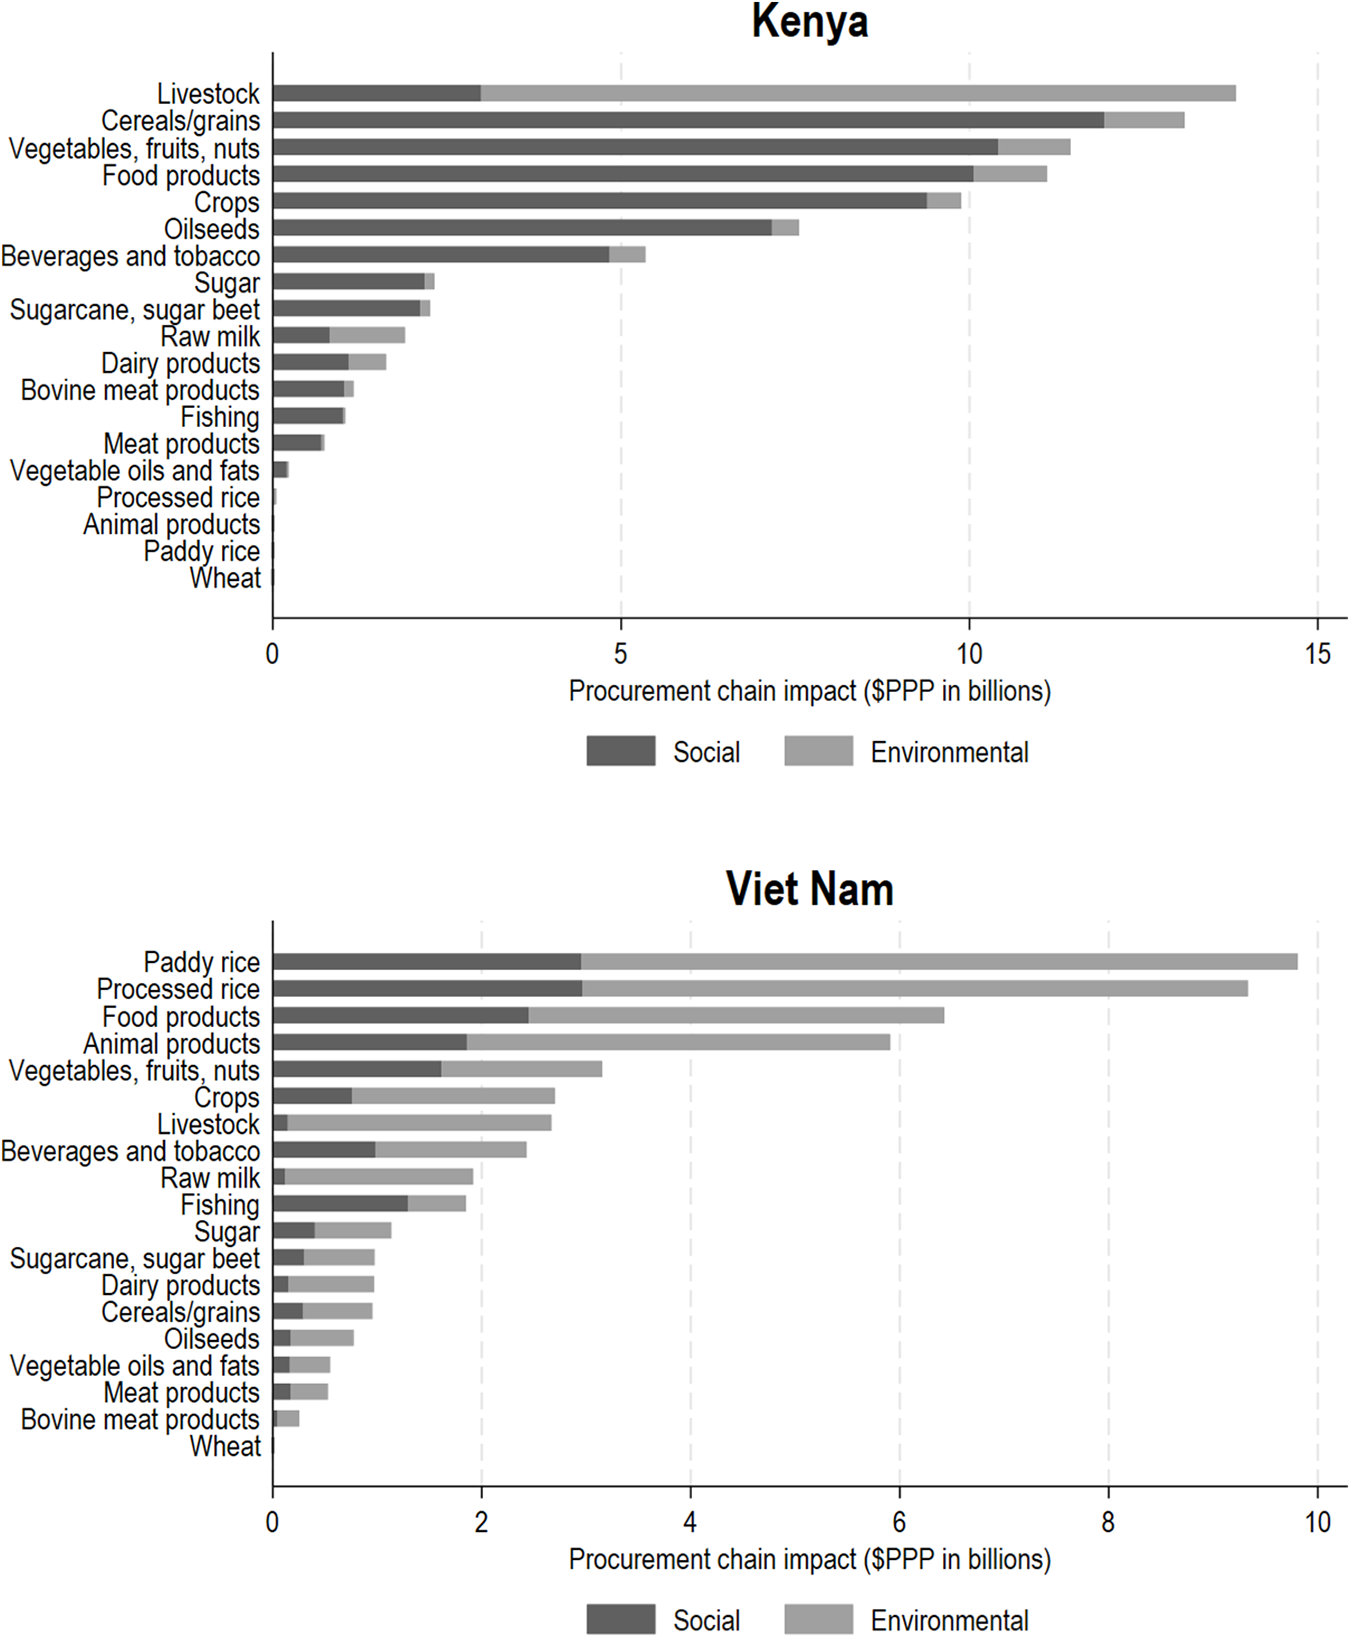
Figure 3 Long description
The x-axis is labeled 'Procurement chain impact (PPP in billions)' with Kenya ranging from 0 to 15 and Viet Nam from 0 to 10. In Kenya, livestock shows the highest impact, approximately 14 billion, with social impacts larger than environmental. Cereals slash grains and vegetables, fruits, nuts follow, each around 12 billion. In Viet Nam, paddy rice dominates with approximately 9 billion, followed by processed rice and food products, each around 8 billion. Social impacts are generally larger in both countries. Notable differences include the prominence of livestock in Kenya versus paddy rice in Viet Nam. Full category lists: Kenya includes livestock, cereals slash grains, vegetables, fruits, nuts, food products, other crops, beverages and tobacco, sugar, sugarcane, sugar beet, dairy products, meat products, bovine meat products, fishing, vegetable and animal oils and fats, processed rice, animal products, paddy rice, wheat. Viet Nam includes paddy rice, processed rice, food products, animal products, vegetables, fruits, nuts, livestock, other crops, beverages and tobacco, raw milk, fishing, sugar beet, sugarcane, sugar beet, dairy products, cereals slash grains, oilseeds, vegetable and animal oils and fats, meat products, bovine meat products, wheat.
In Viet Nam, environmental externalities dominate across most AFS sectors. Rice production is the largest contributor to external costs, mostly linked to environmental impacts ($6.6B vs. $2.9B social), likely due to mechanization and heavy agrochemical use. The findings suggest a need to reduce environmental harm while maintaining low social costs and improving labour conditions in food production.
4.2. The relative importance of external impacts
Social and environmental externalities are associated with specific impacts. Figure 4 ranks the different impacts in each country, highlighting differences between social and environmental.
Ranking of impacts by externalities, crops only [absolute external costs (total impacts) ($ billion)].
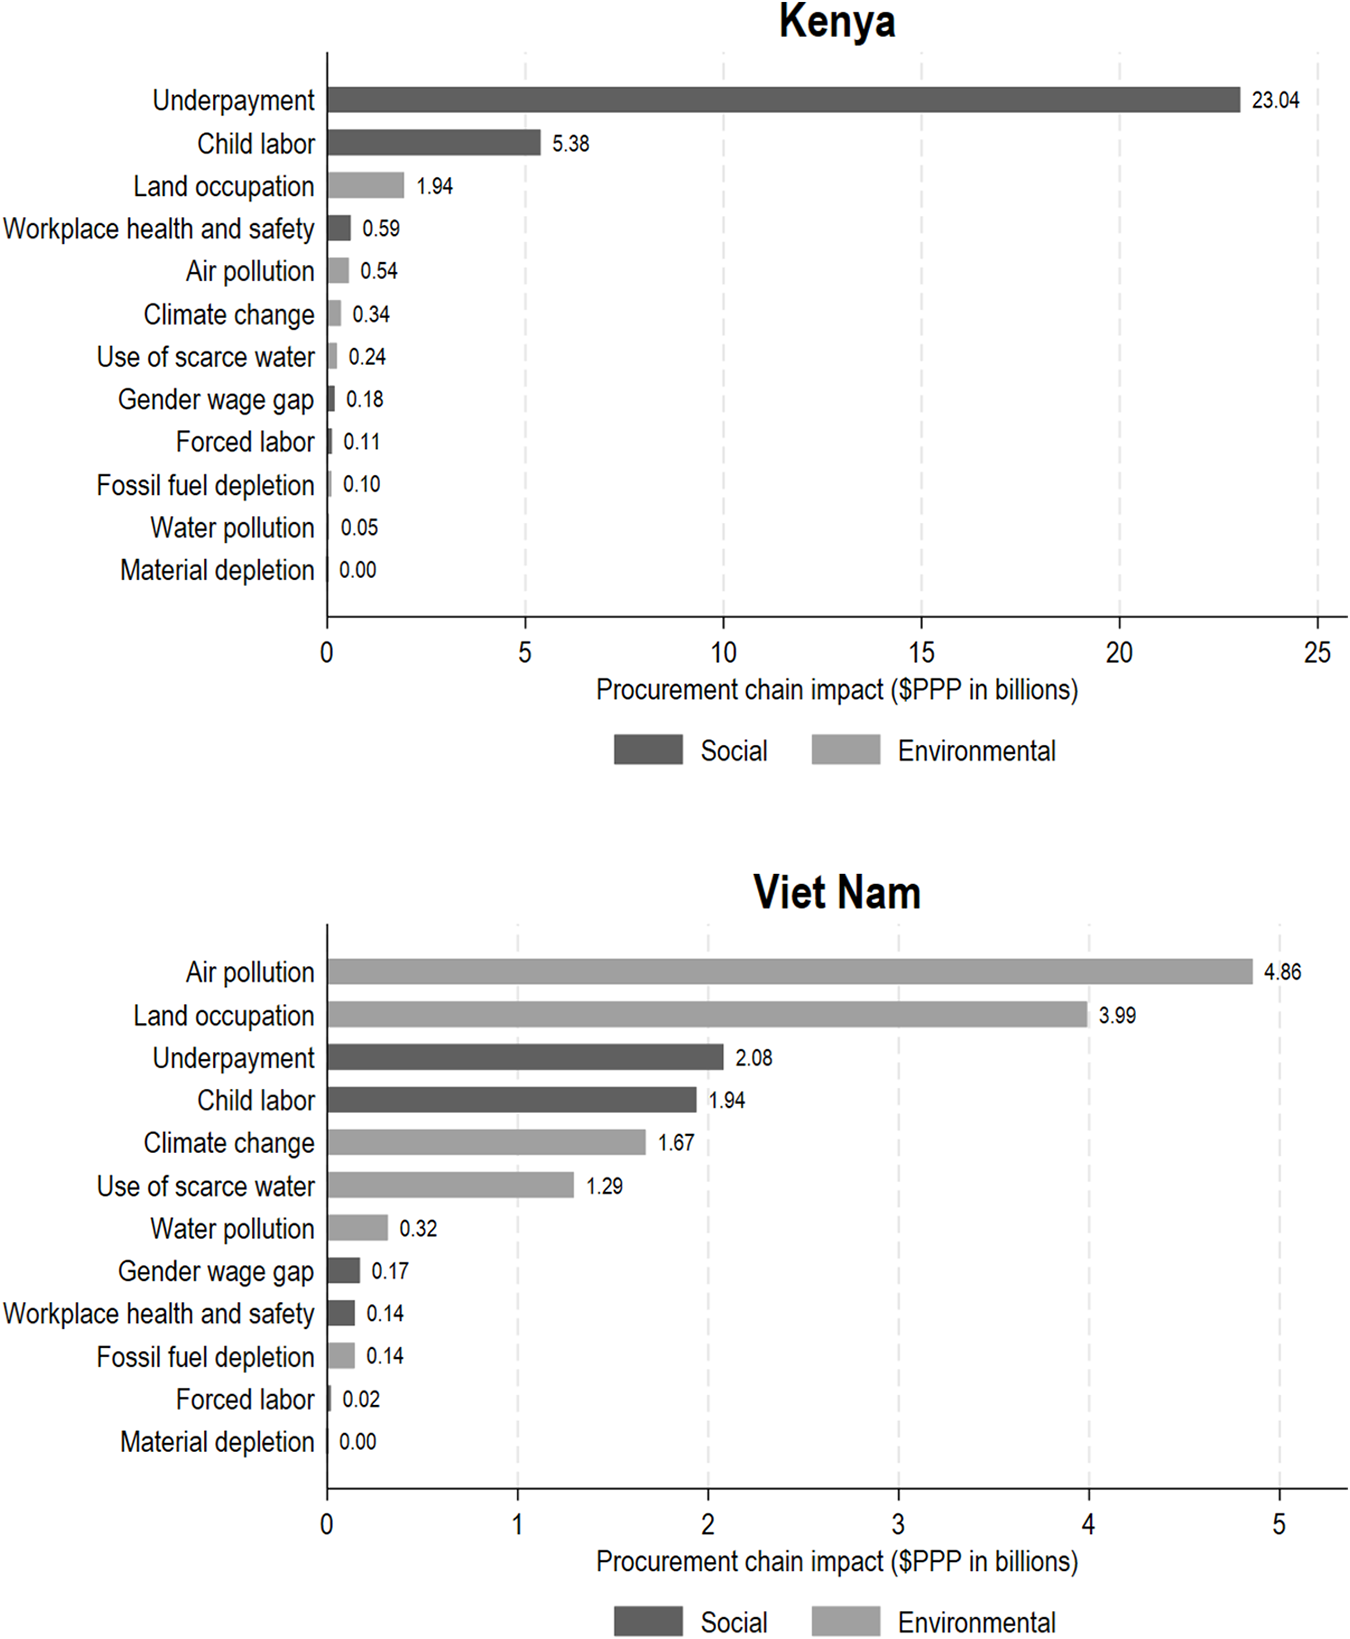
Figure 4 Long description
Kenya The horizontal axis label is Procurement chain impact (dollar purchasing power parity in billions). The horizontal axis ranges from 0 to 25. The vertical axis lists: Underpayment; Child labor; Land occupation; Workplace health and safety; Air pollution; Climate change; Use of scarce water; Gender wage gap; Forced labor; Fossil fuel depletion; Water depletion; Material depletion. Bars and values: Underpayment: Social 23.84. Child labor: Social 5.38. Land occupation: Environmental 1.94; Social 0.91. Workplace health and safety: Social 0.99. Air pollution: Environmental 0.59. Climate change: Environmental 0.34. Use of scarce water: Environmental 0.24. Gender wage gap: Social 0.18. Forced labor: Social 0.11. Fossil fuel depletion: Environmental 0.10. Water depletion: Environmental 0.05. Material depletion: Environmental 0.00. Legend labels: Social; Environmental. Viet Nam The horizontal axis label is Procurement chain impact (dollar purchasing power parity in billions). The horizontal axis ranges from 0 to 5. The vertical axis lists: Air pollution; Land occupation; Underpayment; Child labor; Climate change; Use of scarce water; Water pollution; Gender wage gap; Workplace health and safety; Fossil fuel depletion; Forced labor; Material depletion. Bars and values: Air pollution: Environmental 4.88. Land occupation: Environmental 3.99. Underpayment: Social 2.08. Child labor: Social 1.94. Climate change: Environmental 1.87. Use of scarce water: Environmental 1.29. Water pollution: Environmental 1.22. Gender wage gap: Social 0.17. Workplace health and safety: Social 0.15. Fossil fuel depletion: Environmental 0.14. Forced labor: Social 0.02. Material depletion: Environmental 0.00. Legend labels: Social; Environmental.
In Kenya, social externalities dominate food production impacts, with underpayment ($23B total) and child labour ($5.4B) as major burdens. Environmental costs – mainly land use and climate change – are lower but still notable. In Viet Nam, environmental impacts lead, especially air pollution ($4.9B) and land occupation ($4.0B), correlated with intensive resource use. Social costs like underpayment ($2.1B) and child labour ($1.9B) are present but account for a relatively smaller share of external costs. This pattern contrasts with Kenya's more socially weighted footprint, highlighting differing pressures across food systems.
4.3. External costs across the value chain
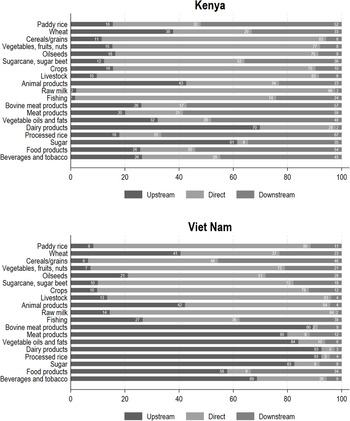
We use VCI data from the GID to estimate the externality cost per additional dollar of output. Because sectors are economically interlinked, increased output in one sector generates external costs both directly and across upstream and downstream sectors. For example, rice production affects seed suppliers (upstream) and processed rice industries (downstream). While the analysis centres on crops – represented by the first seven categories in Figure 5 – we also include livestock, fishing and processing sectors to show their interconnections with crop production.
Indirect cost by crop and value chain stage (% of external cost).
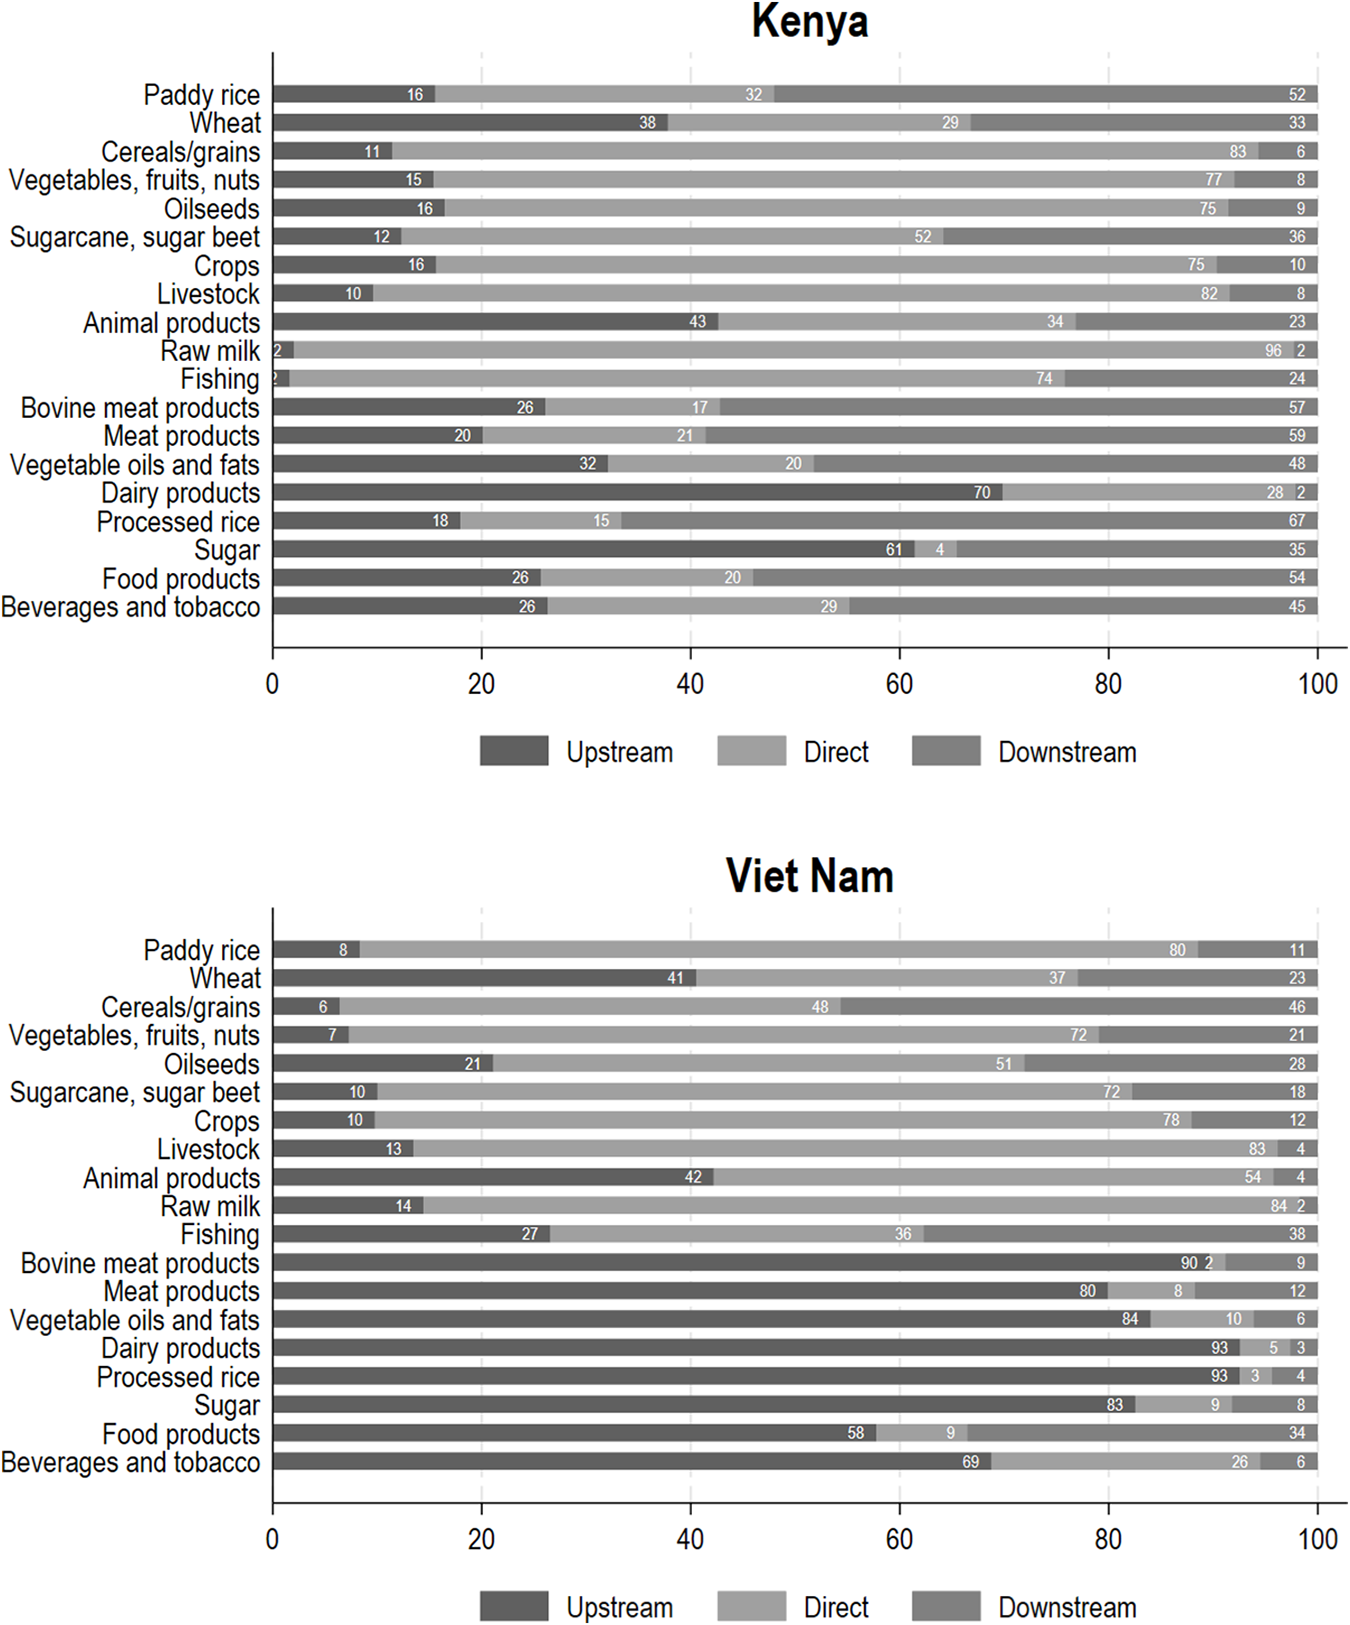
Figure 5 Long description
The stacked bar graph compares indirect costs by crop and value chain stage for Kenya and Viet Nam. The horizontal axis represents per cent, ranging from 0 to 100. Categories include Paddy rice, wheat, cereals, grains, vegetables, fruits, nuts, oilseeds, sugarcane, sugar beet, crops, livestock, animal products, raw milk, fishing, bovine meat products, meat products, vegetable oils and fats, dairy products, processed rice, sugar, food products, beverages and tobacco. Each category has a horizontal stacked bar divided into segments labeled upstream, direct and downstream. In Kenya, upstream costs are significant for paddy rice and wheat, while direct costs dominate in livestock and dairy products. Downstream costs are notable in processed rice. In Viet Nam, upstream costs are high for paddy rice and oilseeds, with direct costs prominent in livestock and dairy products. Downstream costs are substantial in processed rice. The graph highlights that upstream costs are generally higher in Viet Nam compared to Kenya, especially for paddy rice and oilseeds. Direct costs are similar across both countries for livestock and dairy products. The legend identifies the segments and numeric values are printed within each segment, providing detailed insights into the distribution of costs across stages.
VCI data for Kenya highlight the resource intensity of on-site production across key food sectors. Cereals and grains show a dominant direct VCI of 83 per cent, with vegetables, fruits, nuts (77 per cent) and oilseeds (75 per cent) following similar patterns. These findings point to the need for production-focused strategies – such as improved efficiency and sustainable practices – to reduce externalities, particularly social costs within the value chain (Figure 5).
In Viet Nam, paddy rice – the dominant crop – shows a high direct VCI of 80 per cent, indicating that most external costs are related to on-site production. Cereals/grains (48 per cent) and sugarcane/sugar beet (72 per cent) follow similar trends, underscoring the role of in situ agricultural practices in generating externalities. As in Kenya, these patterns suggest that targeting production-stage interventions – especially in crop sectors – could enhance sustainability and reduce external costs. The upstream footprints in value-added sectors (Figure 5) further emphasize the need for advancements in production systems.
Figure 6 illustrates the distribution of indirect costs across value chain stages. In Kenya, workplace health and safety (60 per cent), underpayment (65 per cent) and child labour (70 per cent) show predominantly direct impacts, correlated with on-site production. In contrast, the gender wage gap, water pollution and land occupation exhibit stronger downstream impacts, emerging during processing and distribution. These patterns highlight the need for stage-specific interventions to address social and environmental footprints across the AFS.
Indirect cost by impact type and value chain stage (% of external cost), crop sectors only.
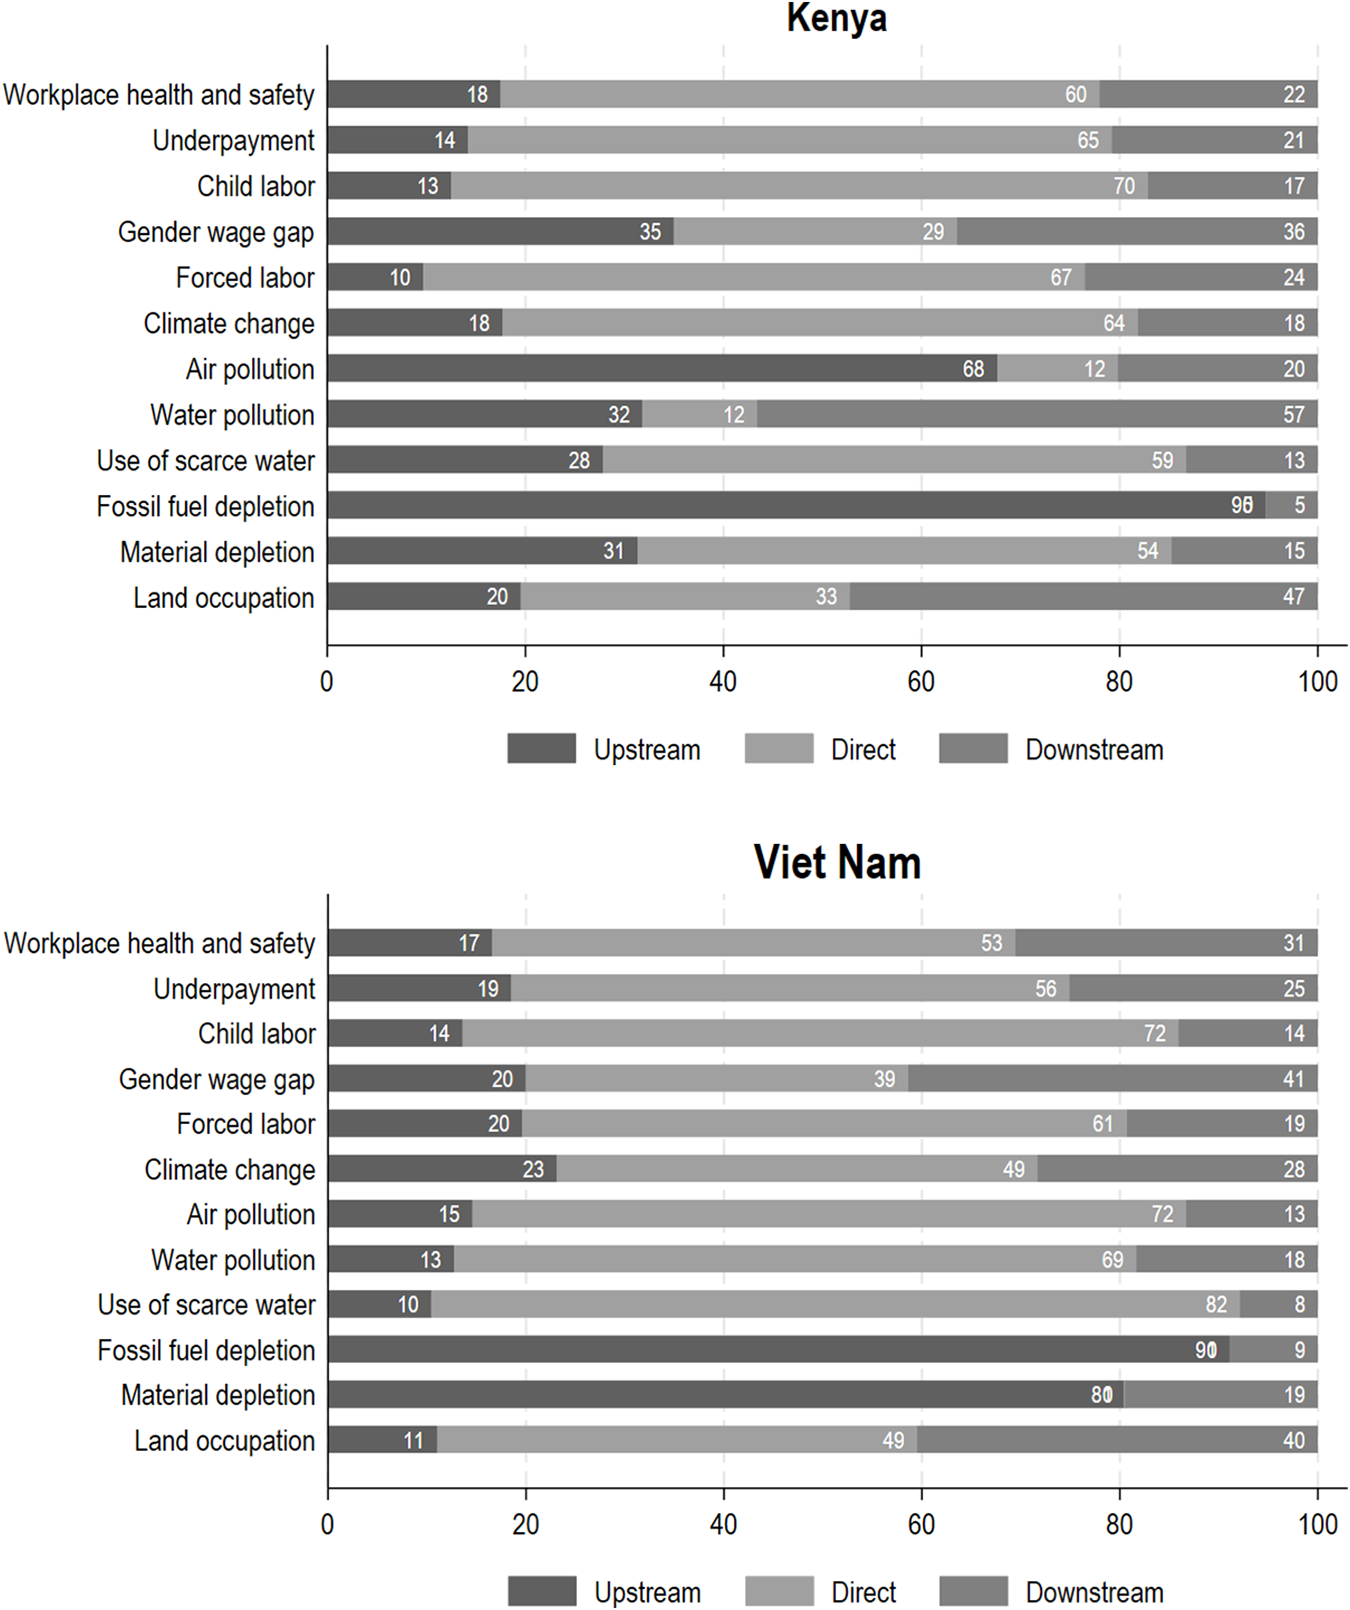
Figure 6 Long description
The image contains two stacked horizontal bar graphs comparing indirect costs by impact type and value chain stage for Kenya and Viet Nam. Each graph has bars representing percentages from 0 to 100, divided into upstream, direct and downstream impacts. For Kenya: - Workplace health and safety: Upstream 3, Direct 60, Downstream 37. - Underpayment: Upstream 4, Direct 65, Downstream 31. - Child labor: Upstream 1, Direct 70, Downstream 29. - Gender wage gap: Upstream 31, Direct 31, Downstream 38. - Forced labor: Upstream 31, Direct 31, Downstream 38. - Climate change: Upstream 61, Direct 21, Downstream 18. - Air pollution: Upstream 61, Direct 21, Downstream 18. - Water pollution: Upstream 31, Direct 31, Downstream 38. - Use of scarce water: Upstream 31, Direct 31, Downstream 38. - Fossil fuel depletion: Upstream 31, Direct 31, Downstream 38. - Material depletion: Upstream 31, Direct 31, Downstream 38. - Land occupation: Upstream 31, Direct 31, Downstream 38. For Viet Nam: - Workplace health and safety: Upstream 3, Direct 60, Downstream 37. - Underpayment: Upstream 4, Direct 65, Downstream 31. - Child labor: Upstream 1, Direct 70, Downstream 29. - Gender wage gap: Upstream 31, Direct 31, Downstream 38. - Forced labor: Upstream 31, Direct 31, Downstream 38. - Climate change: Upstream 61, Direct 21, Downstream 18. - Air pollution: Upstream 61, Direct 21, Downstream 18. - Water pollution: Upstream 31, Direct 31, Downstream 38. - Use of scarce water: Upstream 31, Direct 31, Downstream 38. - Fossil fuel depletion: Upstream 31, Direct 31, Downstream 38. - Material depletion: Upstream 31, Direct 31, Downstream 38. - Land occupation: Upstream 31, Direct 31, Downstream 38. The graphs highlight that workplace health and safety, underpayment and child labor have predominantly direct impacts in both countries, while climate change and air pollution show stronger upstream impacts. The legend indicates the segments: upstream, direct and downstream.
Figure 6 reveals a distinct pattern of direct environmental impacts concentrated in the production phase in Viet Nam, with climate change (49 per cent), air pollution (72 per cent) and water pollution (69 per cent) linked to intensive fertilizer and pesticide use. The gender wage gap shows a balanced distribution across the value chain, with 39 per cent occurring during production, underscoring its systemic nature. The exception is for the fossil fuel depletion impacts that are overwhelmingly upstream. These findings suggest that targeted interventions in upstream practices, particularly around input use and water management, could be associated with external costs reduction.
5. Findings from the farm-level analysis
The farm-level analysis draws on data from the household farming survey and the farm workers survey. The sample is limited to crop-farming households within NATURE+ sites, reflecting the eligible population and sampling design.
As a result, household characteristics in this dataset in some cases diverge from national-level statistics, and findings are not statistically representative at the national scale. While this limits external validity and comparability with broader datasets such as the GID, the micro-level analysis remains complementary, offering granular, context-specific insights that are especially valuable for localized policy and programme design. The demographic profiles of farmers and workers are detailed in Supplementary Appendix Table A5. Farmers’ production characteristics are in Supplementary Appendix Table A6, and structure of income sources is in Supplementary Appendix Figure A3.
5.1. True costs of crop production
5.1.1. Total direct costs of production
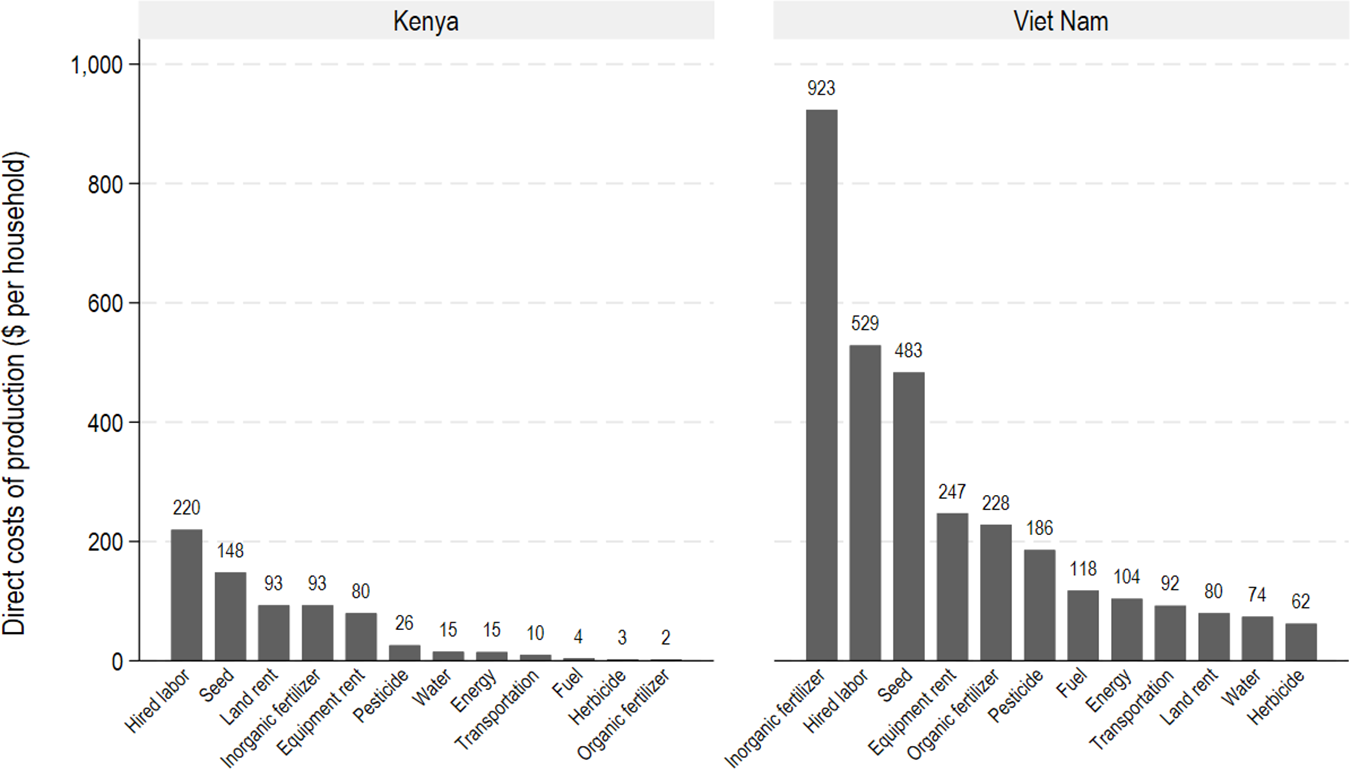
Figure 7 presents household-level crop production costs in Kenya and Viet Nam. In Kenya, annual direct costs average $715 per household per year, with hired labour as the largest expense.Footnote 6 Family and unpaid labour are excluded, which may understate total labour costs. Seeds are the second-highest cost, followed by inorganic fertilizer, land rental and equipment rental – highlighting reliance on external inputs. Energy, pesticide and water costs are relatively low.
Direct costs of production ($ per household).
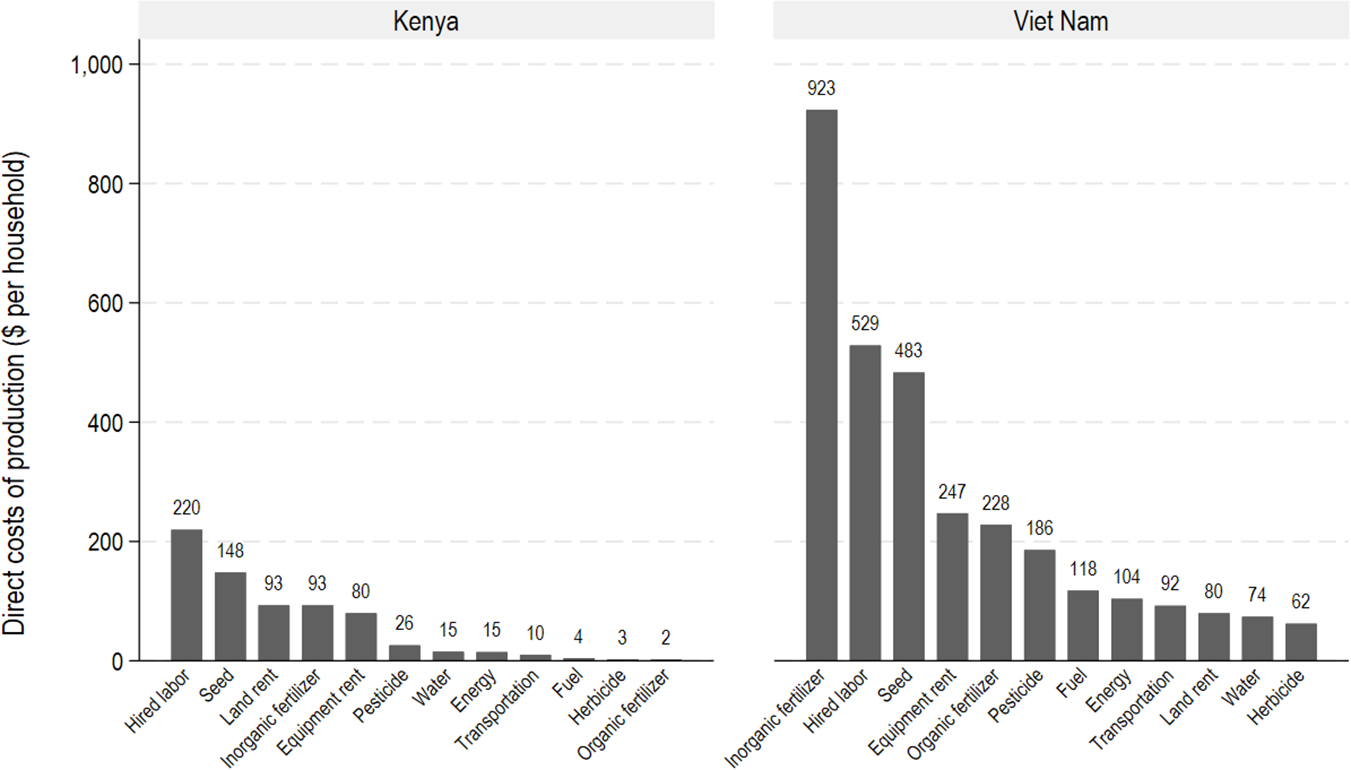
Figure 7 Long description
The bar graph is split into two sections titled Kenya and Viet Nam. Vertical axis label: Direct costs of production per household. Vertical axis range: 0 to 1,000. Kenya section bars, left to right, with values shown above the bars: Hired labor 223. Seeds 145. Inorganic fertilizer 93. Land rental 80. Equipment rental 30. Energy 15. Pesticide 15. Water 10. Other 4. Viet Nam section bars, left to right, with values shown above the bars: Hired labor 923. Seeds 529. Inorganic fertilizer 480. Land rental 247. Equipment rental 226. Energy 118. Pesticide 94. Water 92. Other 80.
In Viet Nam, total costs are significantly higher at $3,148. Inorganic fertilizer is the top expense, reflecting investment in soil nutrients. Hired labour ranks second, followed by seed and equipment rental. Pesticide, organic fertilizer and energy costs are moderate, while water, herbicide and land rent are minimal.
Overall, the crop cost as a share of gross income shows notable disparities between Kenya and Viet Nam. The total gross income from crop farming activities in Kenya amounts to $1,153, with corresponding total costs totalling $715. Direct costs represent 62 per cent of gross crop income. In stark contrast, Viet Nam's gross crop income and costs are substantially higher, at $8,980 and $3,148, respectively, which means that direct costs represent only 35 per cent of gross income.
5.1.2. Total external costs of production
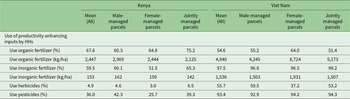
The analysis assesses the extent of use of productivity-enhancing technologies, namely chemical inputs (fertilizers, herbicides and pesticides) and water resources as factors associated with environmental externalities. While these inputs are used to boost yields, they also pose risks such as soil degradation, water contamination and biodiversity loss (Boukaka et al., Reference Boukaka, Azzarri, Davis and De Falcis2024a, Reference Boukaka, Azzarri, Davis and De Falcis2024b). Results of the analysis (by country and parcel management – male, female, joint) are presented in Table 2.
Use of productivity-enhancing inputs in agricultural production
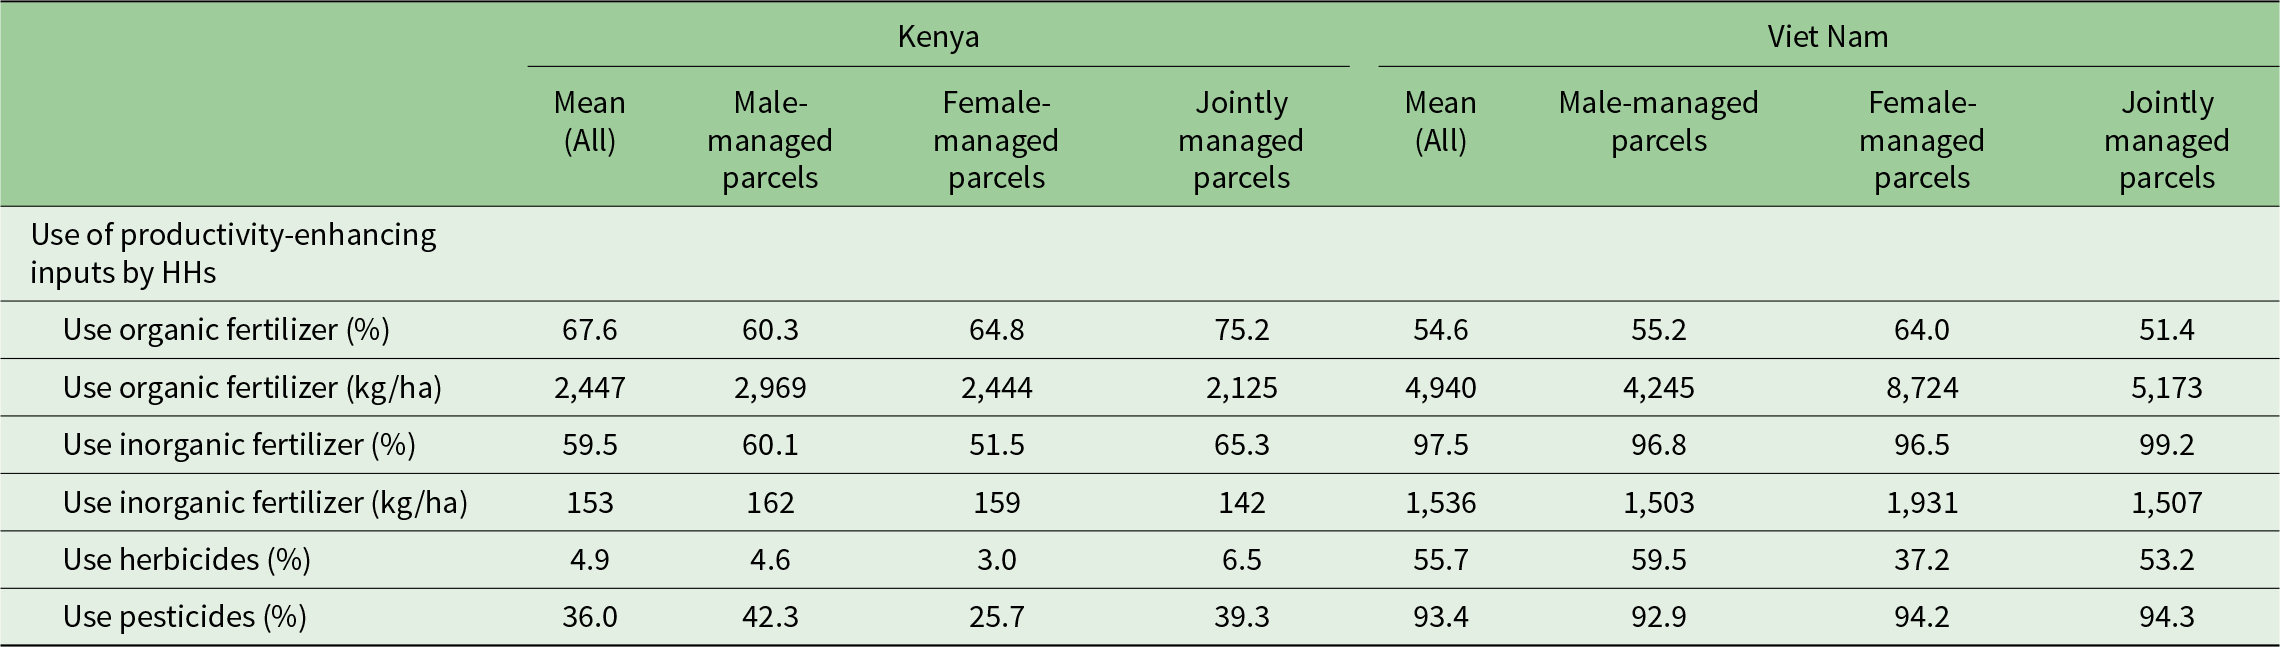
Table 2 Long description
The table reports household use of organic fertilizer, inorganic fertilizer, herbicides, and pesticides in Kenya and Viet Nam, shown as both the share of households using each input and the application rate per hectare, split by male-, female-, and jointly managed parcels plus an overall mean. In Viet Nam, inorganic fertilizer use is nearly universal at 97.5 per cent overall, with high application rates around 1,536 kilograms per hectare overall and highest on female-managed parcels at 1,931. Kenya shows lower inorganic fertilizer use at 59.5 per cent overall and much lower application rates around 153 kilograms per hectare. Organic fertilizer use is more common in Kenya at 67.6 per cent overall than in Viet Nam at 54.6 per cent, but Viet Nam applies more organic fertilizer per hectare overall at 4,940 kilograms per hectare versus 2,447 in Kenya, driven by very high rates on female-managed parcels at 8,724. Herbicide use is rare in Kenya at 4.9 per cent overall but common in Viet Nam at 55.7 per cent, with male-managed parcels highest in Viet Nam at 59.5 per cent. Pesticide use is also much higher in Viet Nam at 93.4 per cent overall than in Kenya at 36.0 per cent, with Kenya’s highest pesticide use on male-managed parcels at 42.3 per cent. Differences by parcel manager vary by input and country, so comparisons should be read as descriptive patterns rather than causal effects.
Notes: N = 1,502 in Kenya and 1,153 in Viet Nam. HH = household.
Source: Authors, using NATURE+ Kenya and Viet Nam household surveys.
In Kenya, farmers show a stronger preference for organic (68 per cent) fertilizers, with limited use of pesticides (36 per cent) and herbicides (under 5 per cent). Inorganic inputs are more common on male- and jointly managed parcels, while organic fertilizers are more frequently used on female- and jointly managed plots. In Viet Nam, inorganic fertilizers dominate (98 per cent), though over half of farmers also use organic options (55 per cent). Pesticide use is widespread (93 per cent), and herbicides are used by roughly half of smallholders. While fertilizer use is consistent across parcel management types, jointly managed parcels in Viet Nam apply notably higher quantities per hectare.
As summarized in Table 3, water sourcing for farms in Kenya and Viet Nam shows notable contrasts. In Kenya, 97 per cent of smallholders rely on rainwater without reservoirs, a reflection of the country's predominantly arid and semi-arid landscape. Surface water and groundwater are used by 16 per cent and 7 per cent of farmers, respectively, with considerable regional variation in sustainable water management practices (Boukaka et al., Reference Boukaka, Azzarri, Davis and De Falcis2024b). In Viet Nam, water sources are more diverse: 69 per cent of smallholders use rainwater, 66 per cent surface water, 21 per cent groundwater and 13 per cent rainwater with reservoirs. This diversity highlights broader access to irrigation infrastructure and greater resilience in water use strategies.
Sources of water used in farms, and expenses in energy, water and transportation
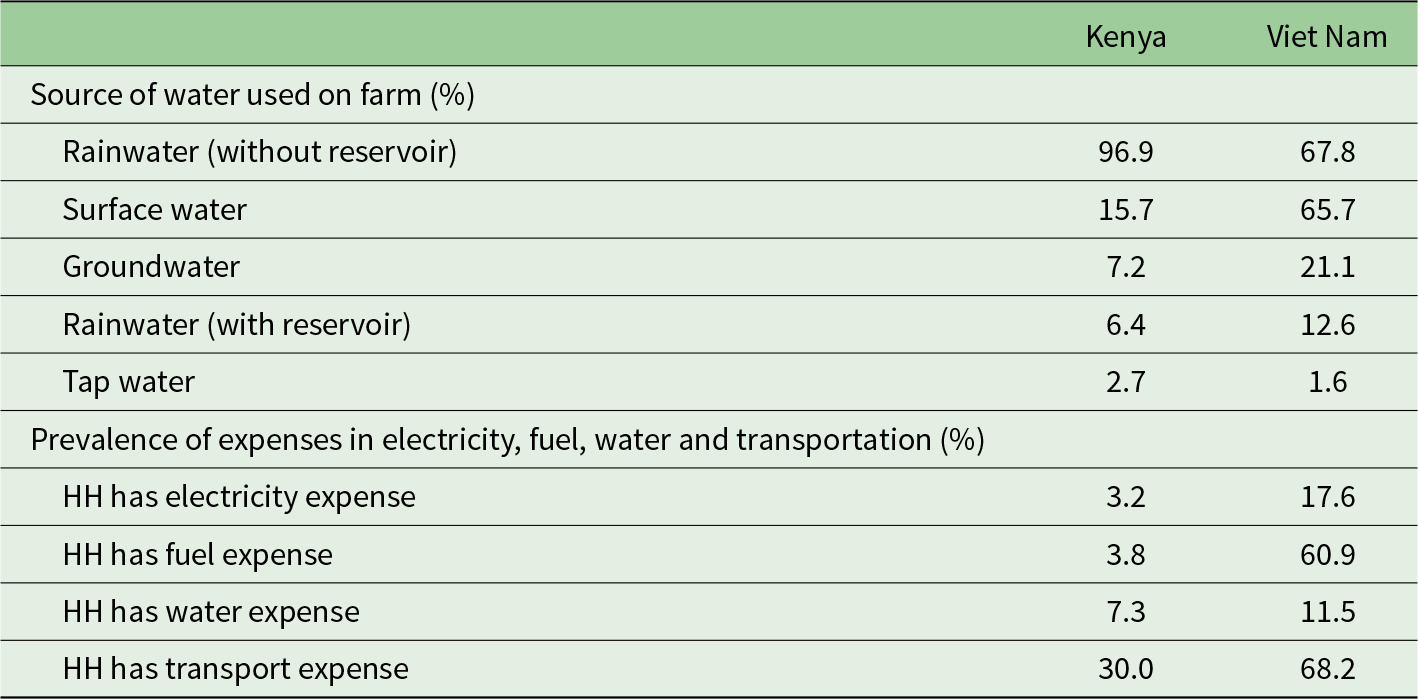
Table 3 Long description
The table compares Kenya and Viet Nam on two topics: sources of water used on farms and how common household spending is on electricity, fuel, water, and transportation. In Kenya, rainwater without a reservoir is the dominant farm water source at 96.9 per cent, while surface water is 15.7 per cent and groundwater is 7.2 per cent. In Viet Nam, rainwater without a reservoir is lower at 67.8 per cent, and surface water is much higher at 65.7 per cent; groundwater is 21.1 per cent. Rainwater with a reservoir is reported by 6.4 per cent of farms in Kenya and 12.6 per cent in Viet Nam, and tap water use is low in both countries at 2.7 per cent and 1.6 per cent. For expenses, Viet Nam shows higher prevalence across all categories: electricity 17.6 per cent versus 3.2 per cent in Kenya, fuel 60.9 per cent versus 3.8 per cent, water 11.5 per cent versus 7.3 per cent, and transportation 68.2 per cent versus 30.0 per cent. Percentages can exceed 100 within a section because farms or households may use multiple water sources or have multiple types of expenses.
Notes: N = 1,502 in Kenya and 1,153 in Viet Nam. HH = household.
Source: Authors, using NATURE+ household surveys.
The environmental footprint is also correlated with the use intensity of electricity, fuel, water and transportation. Table 3 shows the proportion of smallholders who had energy, water and transportation expenses. Viet Nam witnesses a higher prevalence of smallholders incurring expenditures in electricity (18 vs. 3 per cent in Kenya), fuel (61 vs. 4 per cent), water (12 vs. 7 per cent) and transportation (68 vs. 30 per cent).
Table 4 provides an overview of factors associated with social externalities, namely (a) gender wage gap, (b) children in economic activities, (c) workplace conditions and safety, (d) incidence of harassment and (e) forced labour. Overall, about 61 per cent of smallholders in Kenya and 34 per cent in Viet Nam used some hired labour.
Descriptive statistics on factors associated with social externalities
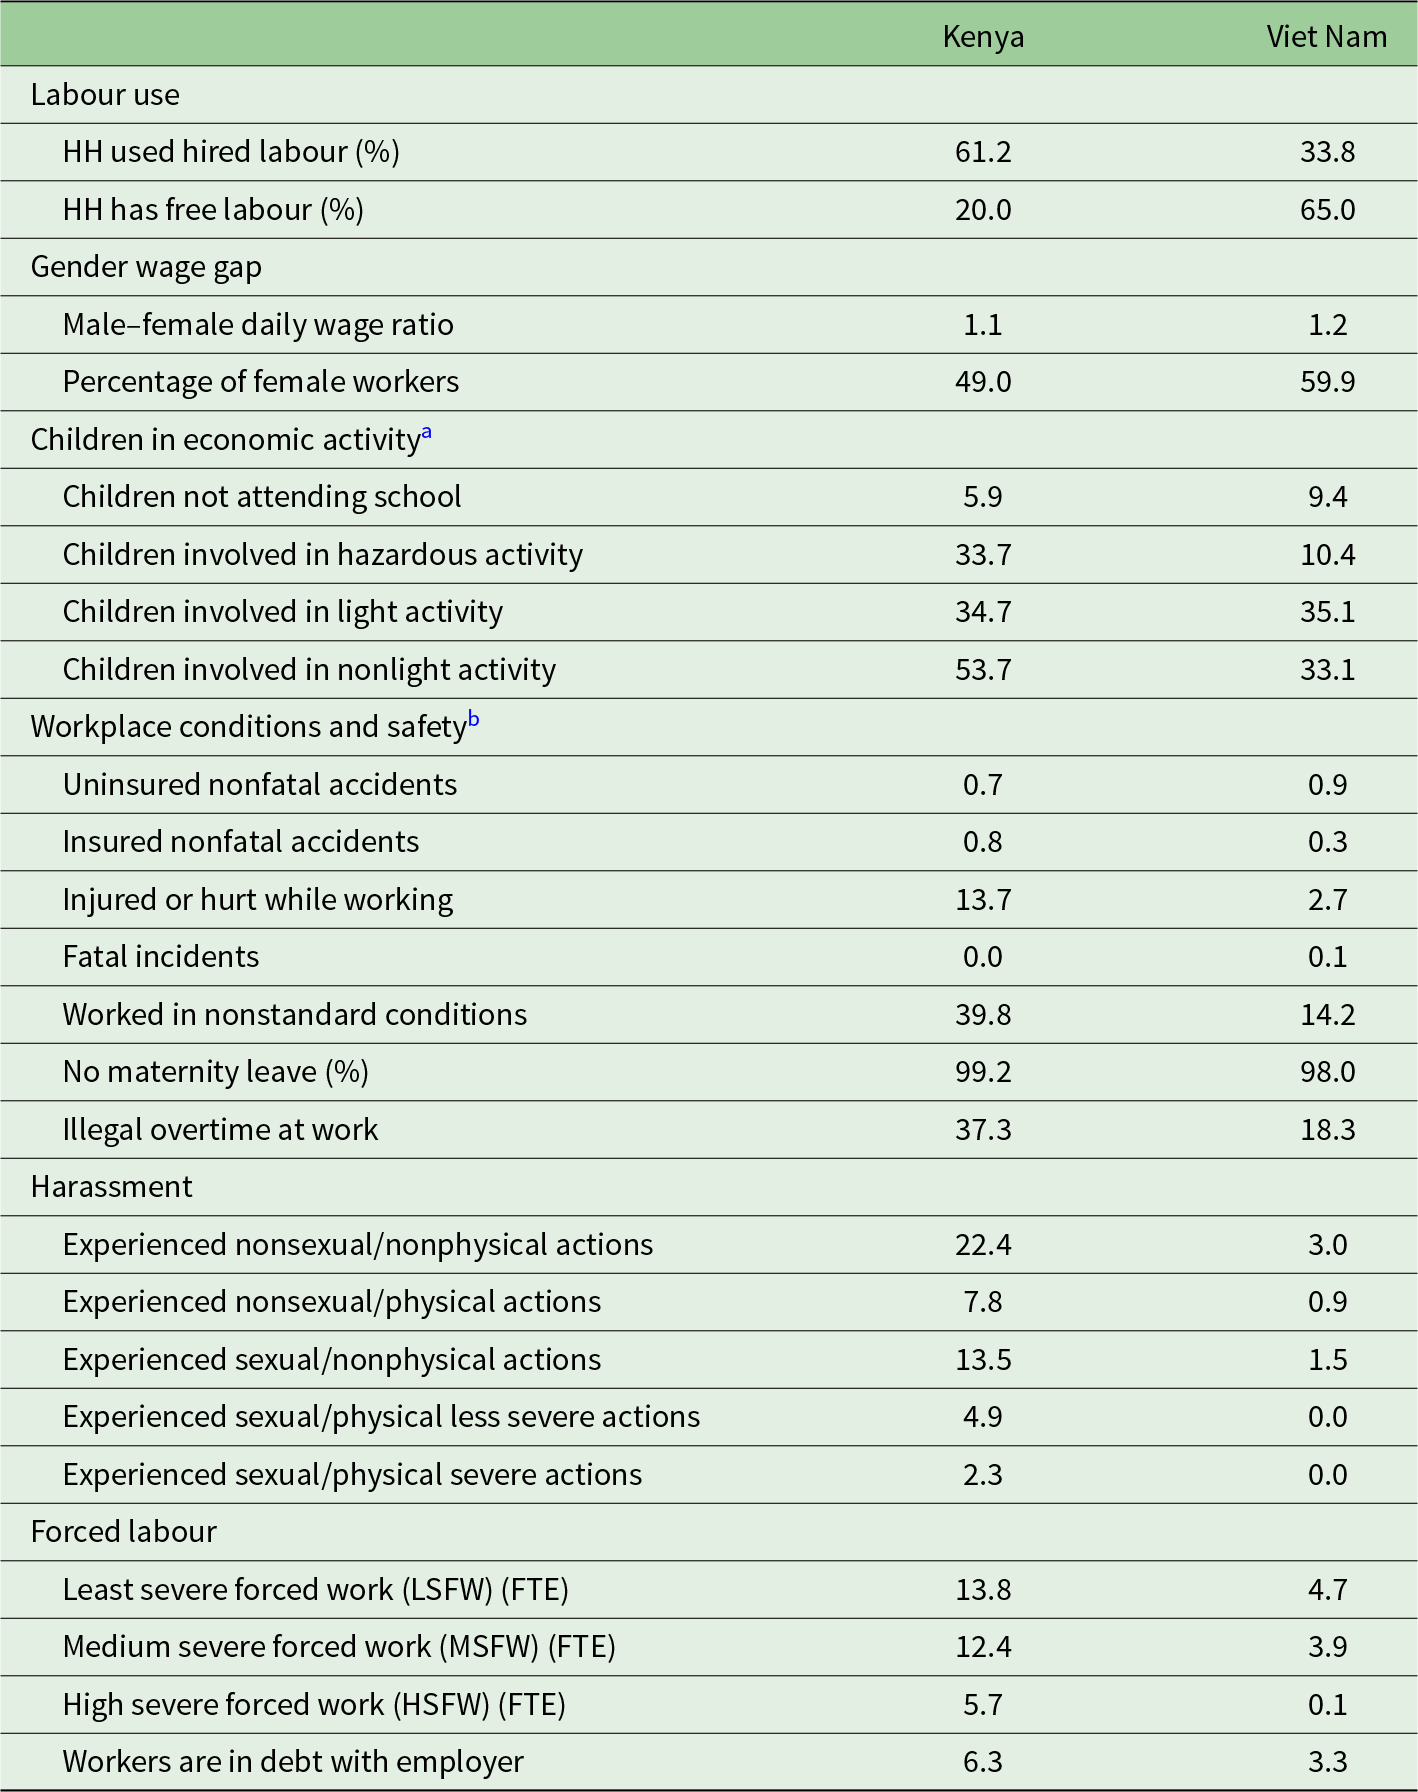
Table 4 Long description
The table compares Kenya and Viet Nam on labor use, gender wage indicators, children’s economic activity, workplace safety, harassment, and forced labor. Kenya has more households using hired labor, while Viet Nam has many more households with free labor. Male daily wages are higher than female daily wages in both countries, and the share of female workers is higher in Viet Nam. Child risk indicators are generally worse in Kenya, especially hazardous work and nonlight work, while school nonattendance is higher in Viet Nam. Workplace safety concerns are more common in Kenya, including being injured or hurt while working and working in nonstandard conditions; fatal incidents are near zero in both. Harassment measures are consistently higher in Kenya across nonsexual and sexual categories, with several sexual physical categories reported as zero in Viet Nam. Forced labor measures and employer debt are higher in Kenya than in Viet Nam. Percentages and other values come from household and worker surveys and apply to households with at least one child, so results may not generalize beyond the surveyed samples.
Note: FTE = full-time equivalent; HH = household.
a Each indicator shows whether a household has a child with an experience on the respective indicator. Data include households with at least one child. N = 1,152 in Kenya and 789 in Viet Nam.
b The worker-level survey covered 1,056 workers in Kenya and 334 workers in Viet Nam.
Source: Authors’ own calculation using NATURE+ Kenya and Viet Nam household and workers surveys.
About half of the workers interviewed in Kenya were females. In Viet Nam, that figure was approximately 60 per cent. The gender wage gap is present in both countries. In Kenya, male workers earn daily wages that are about 10 per cent higher than those of their female counterparts. In Viet Nam, the male–female wage differential is 20 per cent.
Children's involvement in economic activities varies significantly in Kenya. According to survey data, 6 per cent of households with children aged 6–17 reported school non-attendance in the past year. Additionally, 35 per cent noted children's participation in light tasks like livestock herding and hose irrigation. More concerning, 54 per cent of households indicated children were engaged in physically demanding work such as weeding, harvesting and lifting heavy loads. Alarmingly, 34 per cent of children were exposed to hazardous activities, such as spraying chemicals or risking injury from agricultural equipment. In Viet Nam, 9 per cent of children aged 6–16 did not attend school. While 35 per cent engaged in light economic activities, the share involved in nonlight (33 per cent) and hazardous tasks (10 per cent) was significantly lower. This highlights a more pronounced child labour concern in Kenya, especially regarding physically demanding and dangerous work.
The workers’ survey asked about working conditions and safety. The surveys reveal relatively low rates of nonfatal injuries in both countries – 14 per cent in Kenya and under 3 per cent in Viet Nam – with no fatal incidents reported. However, 40 per cent of Kenyan workers reported substandard working conditions, compared to 14 per cent in Viet Nam. Unpaid overtime affected 37 per cent of workers in Kenya and 18 per cent in Viet Nam. Maternity leave is virtually non-existent in both contexts.
Several types of workplace harassment were reported. In Kenya, 22 per cent experienced nonsexual verbal intimidation – comments, threats or actions that felt humiliating or discriminatory. Another 8 per cent faced nonsexual physical aggression, such as threatening contact. Sexual harassment was also reported: 14 per cent experienced nonphysical threats or comments, 5 per cent encountered less severe physical actions like touching, kissing or hugging and 2 per cent faced severe sexual coercion involving violence or demands for favours. In Viet Nam, reported harassment was notably lower: 3 per cent experienced nonsexual verbal actions, and 1 per cent each reported nonsexual physical and sexual verbal harassment.
The workers’ survey examined forced labour, defined as work performed under threat and without voluntary consent (ILO, 2019). It assessed how often workers (a) performed tasks they disagreed with, (b) faced hostile communication and (c) experienced threats or violence from employers. Based on these, a severity scale was created: least severe forced work (LSFW), medium severe forced work (MSFW) and high severe forced work (HSFW). In Kenya, 14 per cent reported LSFW, 12 per cent MSFW and 2 per cent HSFW. In Viet Nam, rates were lower at 5, 4 and 0.1 per cent, respectively. Additionally, 6.3 per cent of Kenyan workers and 3.3 per cent in Viet Nam were in debt to their employer.
5.2. Levels and structure of external costs of crop production
The estimation follows the methodology outlined in Section 2 to calculate indirect crop production costs – specifically, those tied to environmental and social externalities. Using survey data, the study estimates impact footprints and converts them into monetary values via country-specific MFs.
5.2.1. Total external costs of food production in Kenya
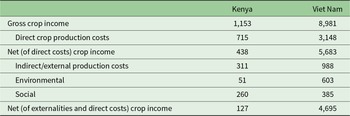
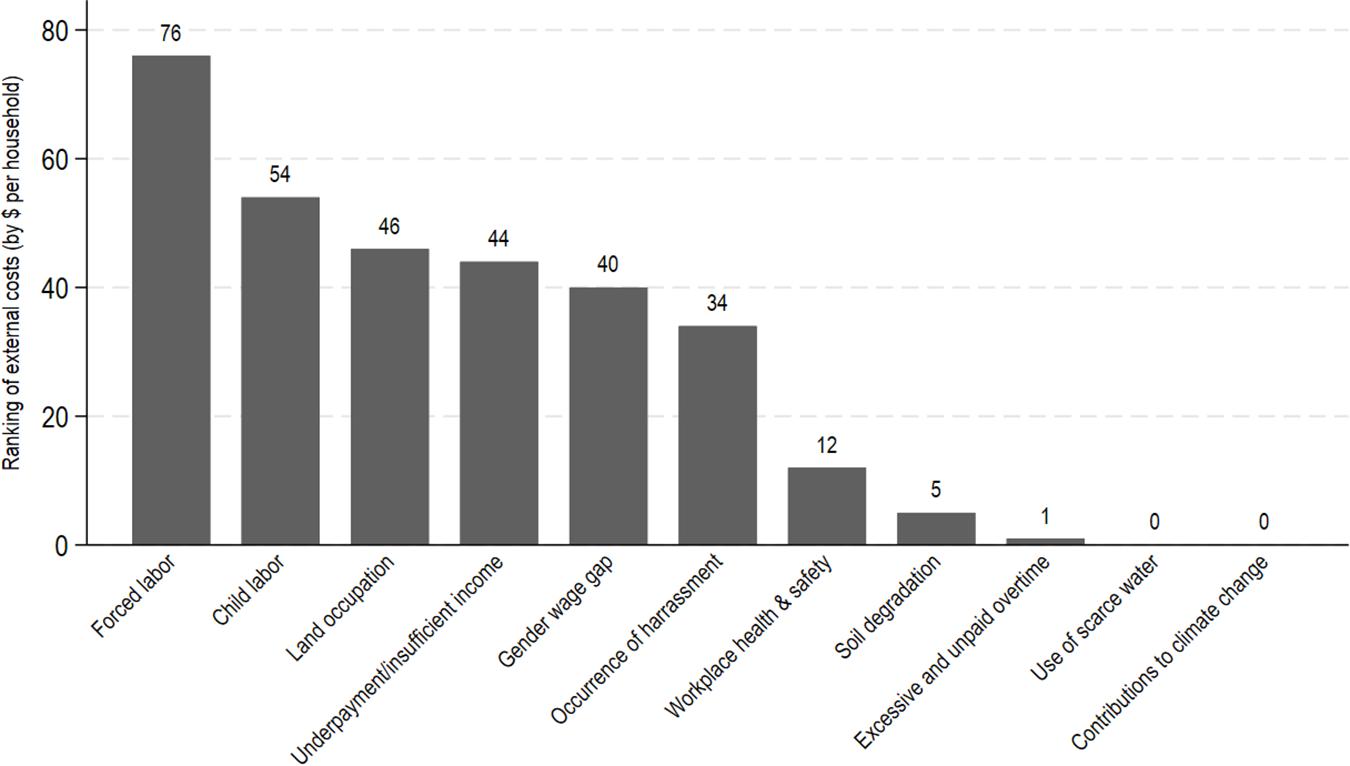
In Kenya, total external costs are estimated at $311 per farming household, with approximately $250 attributed to social externalities and $51 to environmental impacts (Table 5). Figure 8 shows the ranking of external impacts in Kenya.
Crop income and direct and external production costs ($)
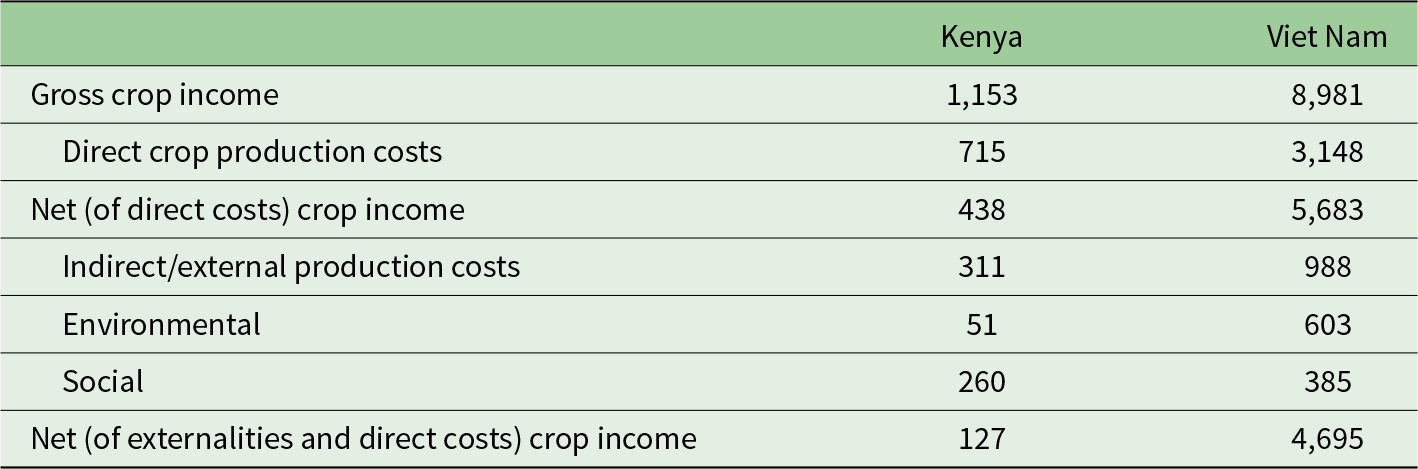
Table 5 Long description
The table reports annual household crop income and production costs in dollars for Kenya and Viet Nam. Gross crop income is 1,153 dollars in Kenya and 8,981 dollars in Viet Nam. Direct crop production costs are 715 dollars in Kenya and 3,148 dollars in Viet Nam, leaving net income after direct costs of 438 dollars and 5,683 dollars, respectively. Indirect or external production costs are 311 dollars in Kenya and 988 dollars in Viet Nam. In Kenya, external costs are mostly social at 260 dollars, with environmental costs at 51 dollars; in Viet Nam, environmental costs dominate at 603 dollars, with social costs at 385 dollars. After subtracting both direct and external costs, net crop income is 127 dollars in Kenya and 4,695 dollars in Viet Nam. Values are household-level and annualized, so differences may reflect both cost structures and overall scale of production across countries.
Notes: N = 1,502 in Kenya and 1,153 in Viet Nam. All indicators are measured at the household level and annualized.
Source: Authors, using NATURE+ Kenya and Viet Nam household surveys.
Structure and ranking of external costs, Kenya [ranking (by $ per household)].
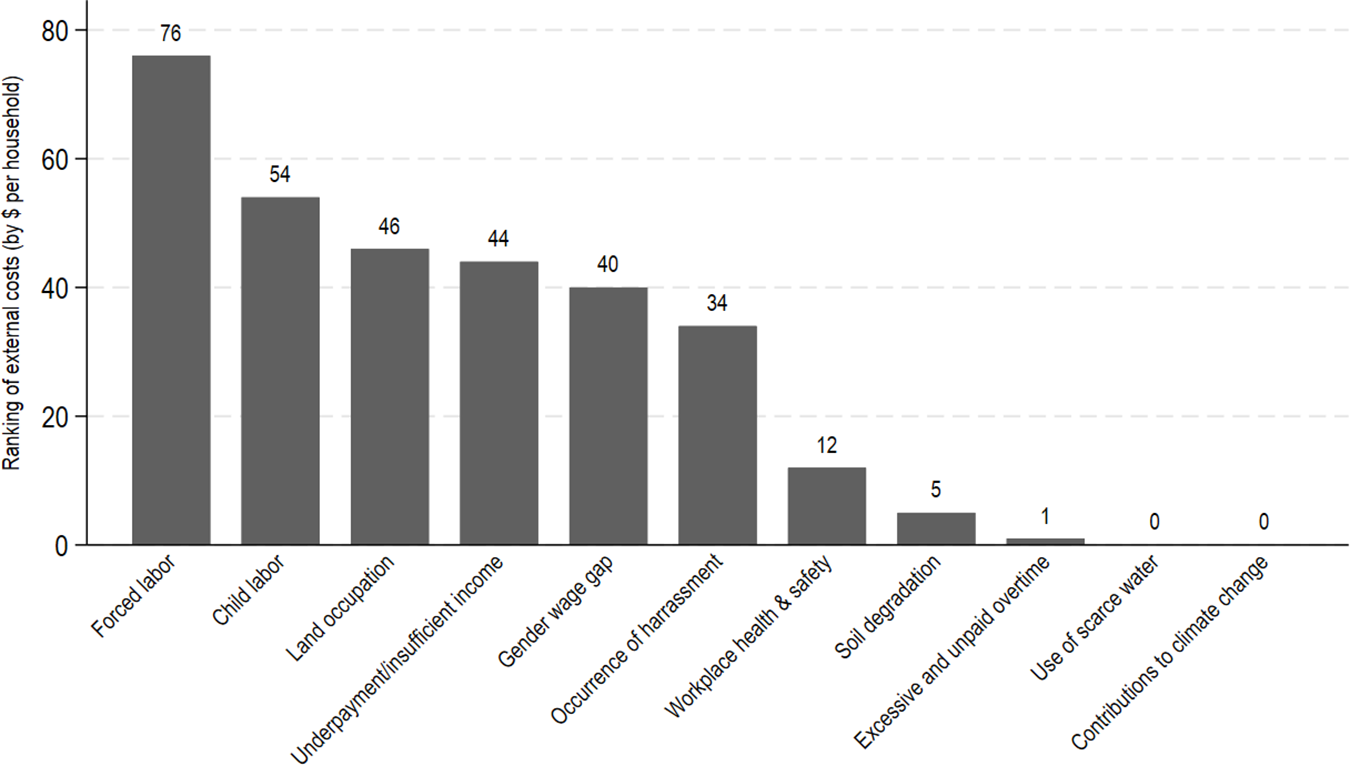
Figure 8 Long description
The bar graph title reads Structure and ranking of external costs, Kenya. The x-axis label reads Ranking left parenthesis by dollar per household right parenthesis. The y-axis label reads Number of dollars per household. The y-axis ranges from 0 to 80. Bar categories and values, left to right: Food safety, 78. Child labor, 54. Underpayment of labor, 46. Underpayment of women, 44. Soil erosion, 40. Occupational health, 34. Biodiversity loss, 12. Water pollution, 5. Excessive water use, 1. Greenhouse gases, 0. Contribution to climate change, 0.
Forced labour (24.3 per cent) and child labour (17.2 per cent) are the main external costs, followed by land occupation (14.6 per cent), underpayment (14.3 per cent), gender wage gap (12.8 per cent), occurrence of harassment (10.8 per cent) and workplace health and safety incidents (3.9 per cent). Besides land occupation, the only other environmental impact among the highest 10 is soil degradation.
5.2.1.1. Social costs in Kenya
Forced labour is the most significant external impact in Kenya, estimated at $76 per household annually – accounting for 24 per cent of total external costs and 30 per cent of social costs. While severe physical coercion is rarely reported, 14 per cent of workers experience financial coercion, and 12 per cent face psychological coercion through restricted mobility. The Impact Institute and IFPRI (2024b) also flagged forced labour as a major issue in Kenya's coffee sector. A key factor of forced labour is the widespread use of seasonal, temporary workers without formal contracts, making them vulnerable to coercion through withheld wages or personal documents (Verité, 2022).
Child labour represents 17 per cent of total external costs and 21 per cent of social externalities in Kenya. The high child labour costs are a function of the significant number of children performing hazardous activity (about 34 per cent) and involved in other light and nonlight activities. Earlier studies in Kenya highlight that the highest risks of child labour are in cash cropping (such as coffee) or market-oriented sectors (Bureau of International Labor Affairs, 2018, 2022), where a strong correlation is found between low prices and increased child labour use.
Underpayment/insufficient income is an important social impact, accounting for 14 per cent of total external costs and 17 per cent of social externalities in Kenya. With 61 per cent of smallholders hiring labour, and labour being the highest direct cost, farmers often reduce wages to cut costs – leading to widespread sub-minimum wage earnings, especially among female workers. Female-headed farms also report lower profits, reflecting persistent gender income disparities. Broader challenges like high input costs, low productivity and small land sizes further contribute to insufficient incomes for farmers, exacerbated by low producer prices (Solidaridad, 2022).
Harassment is a major social cost in Kenya, comprising 11 per cent of total external costs and 13 per cent of social externalities. Overall, 22 per cent of workers reported nonsexual, nonphysical threats (e.g., humiliation, intimidation), while 8 per cent faced physical but nonsexual aggression. Sexual harassment was also prevalent: 14 per cent experienced verbal or nonphysical threats, 5 per cent reported unwanted physical contact and 2 per cent endured severe sexual and physical abuse. These patterns align with broader research across Kenya's agricultural value chains (International Labor Rights Fund, 2002; Ministry of Agriculture, 2022; Rainforest Alliance, 2023; Impact Institute and IFPRI, 2024b).
5.2.1.2. Environmental costs in Kenya
Land occupation/land use is the single most important environmental impact in Kenya. While it represents only 15 per cent of all externalities, it represents over 90 per cent of environmental costs. Land occupation is related to the decreased availability of land for purposes other than its current use. It represents a cost because the use of land for agricultural purposes displaces habitats and ecosystems, leading to the loss in biodiversity and ecosystem services (De Groot et al., Reference de Groot, Brander, van der Ploeg, Costanza, Bernard, Braat, Christie, Crossman, Ghermandi, Hein, Hussain, Kumar, McVittie, Portela, Rodriguez, ten Brink and van Beukering2012).
Soil degradation is the only other major environmental impact, costing $5 per household – 2 per cent of total externalities and 10 per cent of environmental costs. Despite low input intensity (60 per cent use fertilizer at just 0.1 kg/ha; 36 per cent use pesticides; <5 per cent use herbicides), 73 per cent of smallholders report soil erosion. This signals growing risks to soil health and long-term crop productivity.
5.2.2. Total external costs of food production in Viet Nam
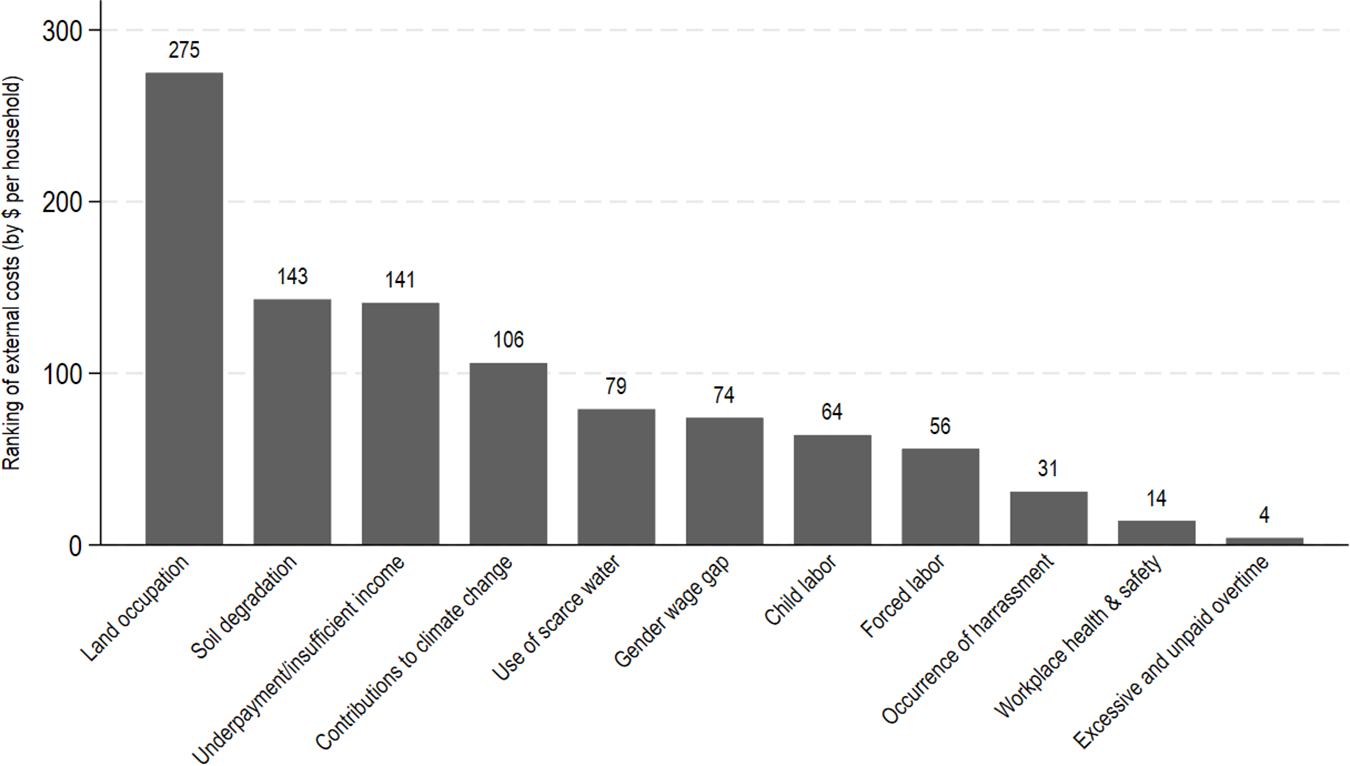
In Viet Nam, total external costs are estimated at $988 per household, with $603 attributed to environmental impacts (Table 5). Environmental costs dominate, with land occupation as the leading impact (27.8 per cent), followed by soil degradation (14.5 per cent) and underearning (14.3 per cent). Other notable environmental impacts include climate change (11 per cent) and scarce water use (8 per cent). Social impacts are comparatively smaller: child labour (6.5 per cent), forced labour (5.7 per cent), harassment (3.1 per cent), workplace safety (1.4 per cent) and underpaid overtime (0.4 per cent). Figure 9 shows the ranking of external impacts in Viet Nam.
Structure and ranking of external costs, Viet Nam [ranking (by $ per household)].
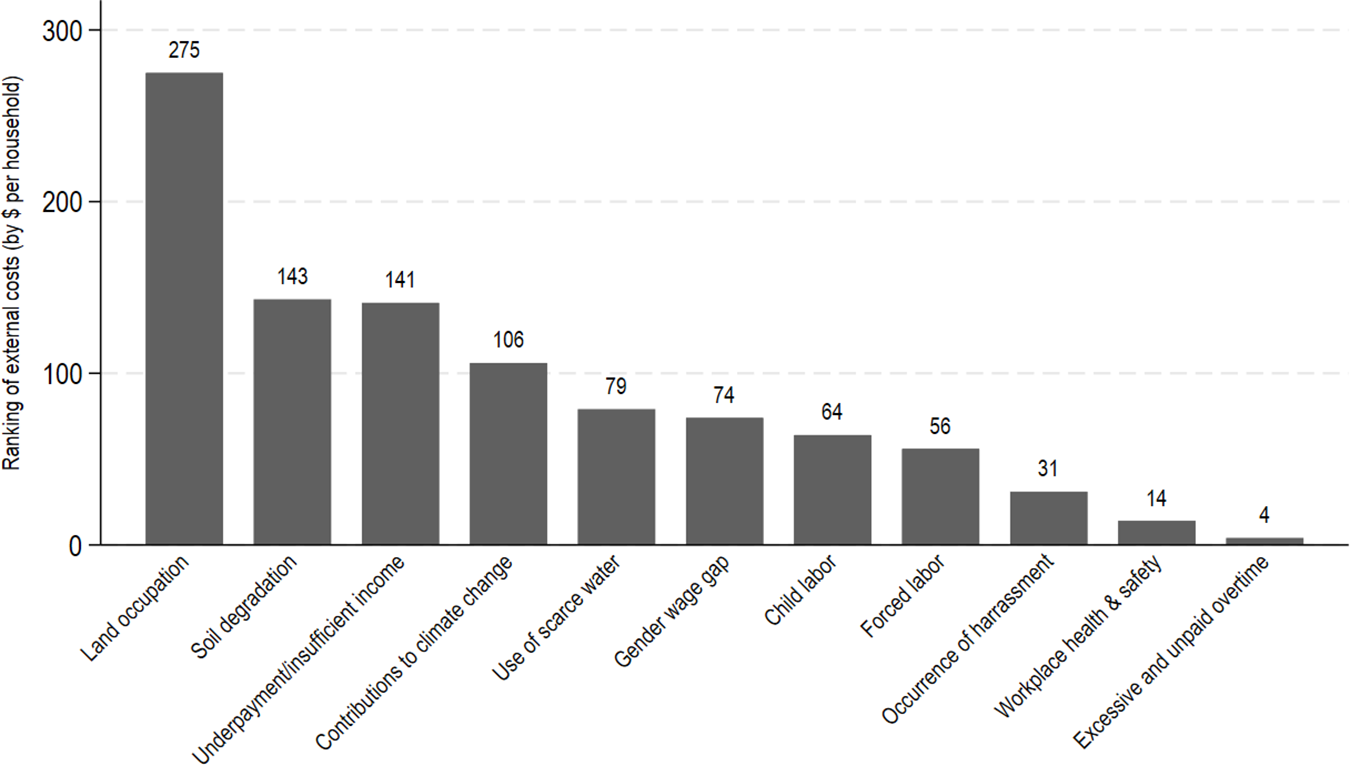
Figure 9 Long description
The bar graph ranks external costs in Viet Nam, measured in dollars per household. The vertical axis represents the ranking of external costs, ranging from 0 to 300 dollars. The horizontal axis lists categories: land occupation (275 dollars), soil degradation (143 dollars), undercompensated income (141 dollars), contribution to climate change (100 dollars), use of scarce water (79 dollars), gender wage gap (74 dollars), child labor (64 dollars), forced labor (56 dollars), discrimination at workplace (31 dollars), workplace health and safety (16 dollars) and excessive and unpaid overtime (4 dollars). Land occupation ranks highest, while excessive and unpaid overtime ranks lowest. The bars are vertical and the graph highlights the significant impact of environmental costs compared to social costs.
5.2.2.1. Environmental costs in Viet Nam
To understand the dominance of environmental impacts in Viet Nam, it is essential to consider the country's input-intensive farming practices. Heavy chemical use – particularly pesticides in rice and maize cultivation – has harmful effects on environmental health and biodiversity (Loc, Reference Loc2022). Additionally, floods intensify soil erosion and trigger landslides, further worsening environmental degradation (Boukaka et al., Reference Boukaka, Azzarri, Davis and De Falcis2024a).
Land occupation is the top environmental externality, costing $275 per household – 28 per cent of total and 46 per cent of environmental costs. It reflects biodiversity loss from converting ecosystems into farmland. Although smallholders farm smaller areas (0.7 ha vs. 1.1 ha in Kenya), they manage more fragmented parcels (2.9 ha vs. 1.7 ha), intensifying land pressure. Slowing expansion is critical to safeguarding biodiversity and the value of ecosystem services. Soil degradation ranks second among Viet Nam's environmental externalities, costing $143 per household – 14 per cent of total and 24 per cent of environmental costs. It stems from intensive input use: 98 per cent of farms apply inorganic fertilizers and 93 per cent use pesticides. In terraced zones, steep slopes reduce productivity (Tarolli and Straffelini, Reference Tarolli and Straffelini2020), triggering heavier input reliance and accelerating degradation (Boukaka et al., Reference Boukaka, Azzarri, Davis and De Falcis2024a).
The costs derived from contributions to climate change are estimated at $106 per household (about 11 per cent of the overall externalities and 18 per cent of the environmental costs). This indicator refers to the quantity of greenhouse gas emissions in CO2 equivalents derived from the crop production processes. The exclusion of livestock from the analysis results in relatively lower impact. Nonetheless, the relatively high level of the use of fertilizers and other chemical inputs is a significant factor driving this environmental impact, exacerbating the negative environmental implications in Viet Nam.
Scarce water use – defined as the consumption of blue water in water-stressed regions (Falkenmark and Rockström, Reference Falkenmark and Rockström2004) – is a notable environmental externality in Viet Nam, costing $79 per household. This represents 8 per cent of total external costs and 13 per cent of environmental externalities. Water sourcing is more diversified than in Kenya: while 69 per cent of smallholders rely on rainwater, substantial shares also use surface water (66 per cent), groundwater (21 per cent) and rainwater with reservoirs (13 per cent), underscoring the complexity of water management in Viet Nam.
5.2.2.2. Social costs in Viet Nam
Social externalities in Viet Nam are smaller than those related to the environment, though this finding should be interpreted cautiously due to the limited sample size of surveyed farm workers. Among social costs, underpayment or insufficient income emerges as the most significant, estimated at $141 per household. This accounts for over 14 per cent of total external impacts and 37 per cent of social impacts, highlighting its importance for targeted interventions. Labour dynamics further compound this issue: 34 per cent of smallholders hire labour (Table 4) and hired labour ranks as the second-highest direct cost (Figure 7), incentivizing farmers to suppress wages to minimize costs. Associated with this result is the prevalence of gender wage/income gaps, reflected in the relative position of the wage gender gap in the ranking.
Child labour-related externalities in Viet Nam are relatively modest, with estimated costs of $64 per household. This represents 6 per cent of total external impacts and 17 per cent of social impacts. Although only 10 per cent of households report children engaged in hazardous work, approximately one-third have children involved in light or nonlight activities. This broader engagement suggests some level of labour participation, but the relatively low prevalence of severe forms of child labour reduces the overall weight of this externality.
The occurrence of harassment is less prevalent in Viet Nam, representing only $31 per household (about 3 per cent of the overall externalities and 8 per cent of social costs). Only about 3 per cent of households report experiencing nonsexual/nonphysical harassment and 2 per cent as having experienced sexual/nonphysical harassment. Finally, workplace safety conditions in Viet Nam are relatively good. This cost is estimated at $14 per household (less than 1.4 per cent of total external impacts and 4 per cent of the social costs). In fact, the occurrence of fatal and nonfatal accidents is negligible, with about 14 per cent reporting working in nonstandard conditions, which is significantly lower than the 40 per cent in Kenya.
5.3. Estimation of true costs of crop production
The estimates of the true costs of production are generated in $ per household and are computed as the sum of the direct (Section 5.1.1) and indirect (Section 5.1.2) costs per household in each country.
In Kenya, the calculated true cost of crop production is $1,026 per household, comprising direct production costs at $715 and external costs estimated at $311 per household. The latter is also called the true cost gap, which in this case represents 30 per cent of the true cost. The breakdown of externalities indicates that social costs (25 per cent of true cost and 84 per cent of external costs) dominate those related to environmental impacts that are only 5 per cent of the true costs or 16 per cent of the external costs.
In Viet Nam, the true cost of crop production is estimated at $4,136 per household, comprising $3,148 in direct production costs and $988 in external costs. Externalities account for 24 per cent of the total cost – relatively lower than in Kenya. Environmental impacts dominate the external cost profile, representing 15 per cent of the true cost and 61 per cent of all externalities, while social impacts contribute 9 per cent of the true cost and 39 per cent of externalities. This contrasts with Kenya, where social externalities are more prominent. The comparison highlights that while both countries face environmental and social challenges in their crop production systems, Viet Nam's burden is more environmentally driven, whereas Kenya's is more socially rooted.
Looking at the importance of production and external costs on crop income, Table 5 shows that there are notable differences between Kenya and Viet Nam. In Kenya, external costs ($311) represent just over 25 per cent of the gross crop income. These external costs represent more than 70 per cent of the net (of direct costs) crop income, resulting in a significantly lower full net (of direct costs and externalities) crop income ($127). So, when accounting for all direct and external costs, final farm crop profits represent only 11 per cent of the original gross crop income.
In Viet Nam, external costs ($988) represent just over 11 per cent of the gross crop income. These external costs represent only 17 per cent of the net (of direct costs) crop income, resulting in a still reasonable full net (of direct costs and externalities) crop income ($4,695). In this case, when accounting for all direct and external costs, final farm crop profits represent more than 52 per cent of the gross crop income.
6. Conclusions and implications
Overall, our national-level analysis reveals stark differences in the food production systems of Kenya and Viet Nam. Kenya's agriculture is dominated by cereal and non-rice crops, with high labour-related costs and low yields, resulting in greater social externalities. In contrast, Viet Nam's rice-based system achieves significantly higher yields, likely correlated to heavy use of inorganic fertilizers – the largest direct cost – and in turn to higher environmental externalities than in Kenya.
At the national level, externalities amount to roughly one-third of the value of AFS output in Kenya, with social impacts accounting for nearly three-quarters of this total. In Viet Nam, externalities represent around one-sixth of output, mostly associated with environmental impacts, which make up about three-quarters of the total external impacts. At the site level, microdata analysis indicates that external costs (excluding health) constitute about one-third of crop production costs in Kenya, again dominated by social impacts, which comprise more than four-fifths of the total. In Viet Nam, external costs make up roughly one-quarter of production costs, with environmental impacts contributing close to two-thirds.
Because external costs make up a meaningful portion of total production costs, targeted policies and investments are essential for building environmentally sustainable and socially equitable AFSs. Key broad strategies include (a) regulatory reforms for economic actors, (b) investment in resource-efficient infrastructure and technologies and (c) careful management of environmentally impactful inputs. Implementing these approaches requires navigating constraints related to land and water scarcity, while also addressing labour factors such as wages, harassment, child and forced labour, working conditions and gender discrimination.
High social costs are rooted in low prices of agricultural commodities, rising costs of production, including labour, and high levels of informality. Price pressures force producers to cut costs, leading to underpayment, poor working conditions and reduced incomes. Informal labour arrangements and lack of contracts heighten vulnerability to forced labour and harassment. High labour costs drive reliance on family labour, increasing child labour. Weak farmer organization and pervasive informality also hinder regulatory oversight and enforcement, raising the cost of governance.
Environmental and social external costs create substantial economic, gender-related inefficiencies. The gender wage gap and workplace harassment disproportionately affect women and their limited access to resources leads to reduced productivity as well as lower input investment than that of their male counterparts. Unequal distribution of land management (with women managing smaller plots) and more limited access to improved agricultural inputs by women create additional inefficiencies in resource allocation and production outcomes.
Smallholder farmers face disproportionate climate risks and often lack the financial and technical capacity to adopt resilient, low-impact practices, resulting in significant environmental externalities. In Viet Nam, unsustainable production methods are strictly related to biodiversity loss, ecosystem degradation and water stress. Economic vulnerability and low profit margins constrain investment in sustainable alternatives, pushing farmers towards intensified chemical input use – fertilizers and pesticides – that further exacerbates environmental harm.
We suggest the following policy and investment actions to overcome the challenges of farmers and workers in the environmental and social impacts. First, strengthening smallholder farmers’ performance is essential. Enhancing farm-level productivity, resilience and sustainability requires promoting resource-efficient practices that increase yields, reduce production costs and support climate change mitigation and adaptation. Financial inclusion programmes tailored to women farmers should combine credit access and input subsidies with simplified collateral requirements that reflect women's unique asset ownership. Capacity building and training in sustainable agricultural practices and adaptive strategies can equip farmers with knowledge to achieve economic gains while minimizing environmental costs. Promoting regenerative farming will help restore ecosystem resilience and reduce dependence on inorganic inputs, lowering both costs and environmental harm. Contract farming should be encouraged to facilitate technology transfer and input credit schemes, while government-supported programmes can expand access to sustainable technologies and markets. Additionally, crop and income diversification should be promoted to help farmers manage risks, invest in sustainable production and improve overall livelihoods.
Second, empowering farm workers is critical to addressing labour-related externalities. This is key in Kenya, where forced labour and child labour alone account for over 40 per cent of total externalities. Many workers lack the means to advocate for their rights. Strengthening worker associations and unions can enhance collective bargaining power, enabling workers to negotiate for fair wages and better conditions. Training programmes focused on labour rights, including health and safety standards, should be provided to organized groups or unions to improve awareness and advocacy. Establishing local grievance mechanisms – ideally embedded within worker organizations and community structures – will further support workers in claiming their rights.
Third, addressing gender-based labour-related externalities will greatly reduce social externalities. As the gender wage gap contributes to external costs, it will be important to establish mandatory gender-equitable wage policies in agriculture, supported by transparent reporting mechanisms and compliance incentives for employers demonstrating wage equality. Furthermore, to address workplace harassment disproportionately affecting women, measures are needed to implement a gender-responsive workplace safety programme that includes mandatory training, the establishment of confidential reporting systems and rural support services designed specifically for women agricultural workers.
Finally, institutionalizing TCA within national food system governance structures can enable long-term transformation. Routinely conducting TCA analysis within ministries of agriculture or planning would allow governments to periodically measure and disclose environmental and social externalities, integrate true cost data into policymaking and develop incentive structures aligned with sustainability. Regular VCI reporting can increase transparency and accountability across AFSs. Such institutional reforms can ensure that the hidden costs revealed by TCA inform national investment decisions, subsidy programmes and sustainability standards.
The study's findings underscore that reducing hidden costs and promoting sustainability and equity requires coordinated policy action across labour regulation, environmental governance, market incentives, financial inclusion and institutional capacity building. By aligning public policies and investments with the true cost of food production, both Kenya and Viet Nam can transition towards AFSs that are not only more equitable and resilient but also economically and environmentally sustainable.
7. Study limitations
This study offers first-order estimates of social and environmental costs in food production but has several limitations. The household-level analysis focuses only on direct production, excluding upstream and downstream stages. The GID data analysis partially addresses this by estimating value-chain cost structures. Health costs are omitted due to missing data, and key environmental externalities, such as air and water pollution, biodiversity loss and ecosystem degradation, are not covered in the farmer household analysis. Behavioural responses to externalities are not modelled, and some social indicators rely on self-reported data, with Viet Nam's small worker sample reducing reliability. Finally, impacts are assessed separately, so interactions and combined effects remain unaccounted for. Future research should aim to address these limitations through more integrated and dynamic modelling approaches.
Supplementary material
The supplementary material for this article can be found at https://doi.org/10.1017/S1355770X26100643.
Data availability statement
The data used in this paper can be made available upon request.
Competing interests
The authors declare no competing interests that are relevant to the content of this article.