Application of biochar to soil is potentially important, in particular for two globally important issues – climate change and sustainable soil management (Chan et al. Reference Chan, Van Zwieten, Meszaros, Downie and Joseph2007) – because its two key characteristics are sequestering CO2 and improving soil properties. As well as carrying out both of these functions, it is likely that biochar only has to be applied to land once or occasionally, because it is mainly composed of stable aromatic forms of organic carbon that do not easily degrade to CO2 (Sohi et al. Reference Sohi, Krull, Lopez-Capel and Bol2010), making it a relatively simple mitigation method. Biochar's resistance to chemical and microbial decomposition means it has the potential to remain in the environment for centuries (Glaser et al. Reference Glaser, Haumaier, Guggenberger and Zech2001).
A key property of biochar is its highly porous structure, which is thought to be the reason for its ability to improve soil water retention. Biochar's physical properties suggest it has the potential to alter soil pore size distribution, water retention, percolation patterns and flow paths (Major et al. Reference Major, Steiner, Downie, Lehmann, Lehmann and Joseph2009). Increased water retention with biochar addition has been found in many studies (Briggs et al. Reference Briggs, Breiner and Graham2005; Brockhoff et al. Reference Brockhoff, Christians, Killorn, Horton and Davis2010; Dugan et al. Reference Dugan, Verhoef, Robinson and Sohi2010; Laird et al. Reference Laird, Fleming, Wang, Horton and Karlen2010; Karhu et al. Reference Karhu, Mattila, Bergstrom and Regina2011), and is often cited as a key factor in explaining improved crop yields (Sohi et al. Reference Sohi, Lopez-Capel, Krull and Bol2009). Biochar can improve crop production through improvements in soil chemical or physical properties, with an improvement in physical properties tending to improve root growth as well as acquisition and retention of water and soluble nutrients (Sohi et al. Reference Sohi, Lopez-Capel, Krull and Bol2009). When biochar is applied to soil, it can affect soil physical properties such as texture, structure, porosity, surface area and pore size distribution. These changes will then influence plant growth because the depth of roots and the availability of air and water within the root zone are largely determined by soil physical properties (Downie et al. Reference Downie, Crosky, Munroe, Lehmann and Joseph2009).
If biochar is able to increase soil water holding capacity in agricultural soils, it may be possible to reduce irrigation frequency or volume. However, increased water retention by biochar may only occur in coarse textured soils, soils with a large number of macropores or when large amounts of biochar are applied (Verheijen et al. Reference Verheijen, Jefferey, Bastos, van der Velde and Diafas2009). Unfortunately, most studies are conducted on different soil types with different concentrations of biochar, making direct comparisons difficult. Also, much of the research to date has been in tropical soils and may not be relevant in a temperate environment. Therefore, this study aims to assess the effects of biochar application to a typical UK agricultural soil on soil physical properties and wheat growth. The objective of this study was to measure the effects of biochar on soil water-holding capacity and water repellency, as well as investigating the changes in soil pore characteristics associated with biochar addition, by using X-ray computed tomography (CT) scanning to visualise and measure changes in total porosity and pore size. A further set of measurements concentrated on assessing the influence of biochar on the early growth stages of wheat were obtained.
1. Materials and methods
Sandy loam soil from the Dunnington Heath series (FAO class; Stagno-Gleyic Luvisol) was collected from the upper 15 cm of an agricultural field at the University of Nottingham farm, Sutton Bonington, Leicestershire, UK. Kubiëna tins were collected to measure field bulk density, which was then determined using the method described by Rowell (Reference Rowell1994). The rest of the soil was air dried, sieved to 2 mm and mixed with 0·5, 1·5%, 2·5% or 5% w/w biochar, and then packed to the field bulk density of 1·25 g cm–3 in triplicate in columns (diameter=7·5 cm; length=15 cm). The biochar used was a powered variety obtained from wood charcoal (Fisher Scientific, batch 0966955). To avoid surface compression, the soil was packed in layers, and to reduce the visibility of compaction lines during imaging the soil surface was scarified after each layer during packing.
Winter wheat seeds, cultivar cordiale, were germinated at room temperature for 48 hours, after which three were placed just under the soil surface in each of the wheat columns. Wheat columns were arranged in a randomised design in the glasshouse and the moisture content maintained at field capacity. Plant height from the soil surface to the top of the highest stem was recorded once a week for two months.
Columns were completely air dried to remove any differences in initial wetness before measuring water droplet penetration time (WDPT) (Doerr et al. Reference Doerr, Woods, Martin and Casimiro2009) to give an indication of soil hydrophobicity. Four droplets of distilled water were placed on each soil surface and the time until adsorption recorded. WDPT classes of ≤5 seconds for wettable and 5–60 seconds for slightly water repellent (Zavala et al. Reference Zavala, Granged, Jordan and Barcenas-Moreno2010) were used. A water release curve was determined for each treatment in triplicate using a sand table and pressure membrane suction apparatus. All data were subsequently fitted to a van Genuchten m=1–1/n model using RETC software (www.pc-progress.com).
Saturated hydraulic conductivity (Ksat) was measured by a constant head permeability test at the beginning and end of the experiment, a time-span of two months, with the hydraulic head maintained at 2 cm. Above ground, biomass of wheat plants was harvested and oven dried at 60°C for 48 hours. Root measurements were taken using a WinRHIZO (Regent Instruments, Canada) scanner and root biomass was then determined from oven drying at 50°C for 48 hours.
X-ray computed tomography (CT) scanning was conducted using a high resolution Phoenix Nanotom 180NF system (GE Sensing and Inspection Technologies GmbH, Wunsdorf, Germany) to visualise and quantify pore characteristics in undisturbed soil columns. Scanning of all cores was undertaken at the beginning and end of the experiment, a time difference of two months, with the soil columns held at field capacity both times. Due to a scanner constraint, only the top 64 mm of each wheat column was scanned at an electron acceleration energy of 120 kV, 200 µA current, and at a resolution of 62 µm. Each scan collected 1080 projection images, resulting in a total scan time of 18 minutes. Projection images were reconstructed using Datos|Rec software (GE Sensing and Inspection Technologies GmbH, Wunsdorf, Germany) and subsequently visualised using VGStudioMAX (Volume Graphics GmbH, Heidelberg, Germany). Quantification of pore geometries was performed using ImageJ software (National Institutes of Health, Maryland, USA). To summarise the image analysis procedure, image noise was first reduced by the use of despeckle and smoothing filters, and subsequently thresholded manually (S.E. <5%) to isolate the pore space from the soil particles. A manual threshold was only chosen after the testing of >20 automated threshold algorithms in ImageJ were found to be unsuccessful. Pore quantification was performed using the ‘analyse particles’ macro. Finally, an analysis of variance (ANOVA) was conducted using GenStat (13th edition) on all the data to show any statistical significance between biochar treatments and time (rooting) effects.
2. Results and discussion
2.1. Soil bulk density
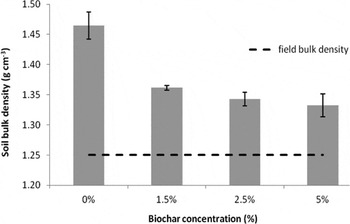
Bulk density of all soils increased from the original field bulk density of 1·25 g cm–3 to which they were packed, highlighting the effect of watering and settling (Fig. 1). In addition, a significant decrease in soil bulk density occurred as biochar concentration increased (P=0·001, F(3,8)=14·42, r2=0·84). Reductions in soil bulk density from biochar addition have also been found for 9 t ha–1 (Karhu et al. Reference Karhu, Mattila, Bergstrom and Regina2011), 30 and 60 t ha–1 (Vaccari et al. Reference Vaccari, Baronti, Lugato, Genesio, Castaldi, Fornasier and Miglietta2011) and 116·6 t ha–1 (Major et al. Reference Major, Lehmann, Rondon and Goodale2010), confirming that this effect is present at a wide range of biochar concentrations. This is because, in general, biochar tends to have a lower bulk density than soil and therefore reduces soil bulk density (Verheijen et al. Reference Verheijen, Jefferey, Bastos, van der Velde and Diafas2009). Values as low as 0·30–0·43 g cm–3 for bulk density (Pastor-Villegas et al. Reference Pastor-Villegas, Pastore-Valle, Meneses Rodríguez and García2006) and 1·47 g cm–3 (Brown et al. Reference Brown, Kercher, Nguyen, Nagle and Ball2006) have been reported, although this is likely to vary between biochar materials.
Change in mean soil bulk density of each biochar treatment from the original packing bulk density of 1·25 g cm–3. Error bars represent the standard errors.

2.2. Water release curve
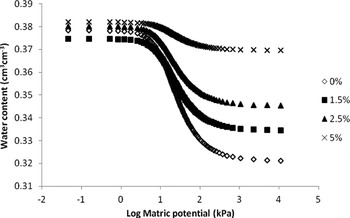
The water release measurements (Fig. 2) show that an increase in biochar results in an increase, in soil water content for a given matric potential. suggesting that as matric potential increases, the biochar retains more water within pores as compared to biochar-free sandy loam soil, as more suction is applied. These effects were more pronounced at higher matric potentials. Gaskin et al. (Reference Gaskin, Speir, Morris, Ogden, Harris, Lee and Das2007) also found a significant increase in water-holding capacity of biochar when measuring the water release curve at pressures of 20–100 kPa, but this was only in one of the six treatments tested.
The effects of increasing matric potential and biochar treatment on soil water content. Matric potential has undergone a log transformation. Fitted to the van Genuchten m =1–1/n model.

2.3. Saturated hydraulic conductivity (Ksat)
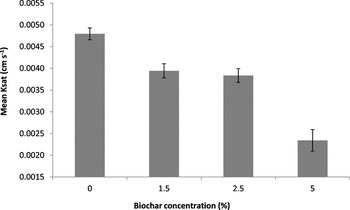
Ksat significantly decreased with increasing biochar concentration (P<0·001, F(3,20)=31·86, r2=0·83) at the beginning of the experiment, demonstrating that more water was retained when more biochar was present (Fig. 3). Average Ksat decreased from 4·8×10–3 cm s–1 for the control soil down to 2·3×10–3 cm s–1 for the 5% biochar soil, as more water was held in soil pores. All of the soils do show very fast drainage, as Ksat is usually around 10–6 to 10–7 cm s–1 in a sandy soil (Hillel Reference Hillel1998). However, these results agree with Atkinson et al. (Reference Atkinson, Sparkes and Mooney2009), who found average Ksat on the same soil to be 1·86×10–3 cm s–1. Uzoma et al. (Reference Uzoma, Inoue, Andry, Fujimaki, Zahoor and Nishihara2011) found that Ksat in the field decreased in a sandy soil as biochar concentration increased from 1·96 cm s–1 for the control soil down to 1·27 cm s–1 for 20 t ha–1 biochar. The decrease was thought to be due to biochar's large surface area and high number of pores which need to fill up before water drains under the force of gravity, meaning that more biochar led to the retention of more water in pores.
The effect of increasing biochar concentration on saturated hydraulic conductivity at the beginning of the experiment. Error bars represent standard errors.

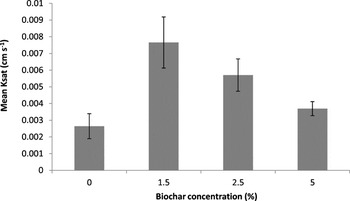
Over the course of the experiment, the Ksat of biochar soils increased when compared to Ksat values at the beginning of the experiment (Fig. 4). There were significant effects on Ksat of increasing biochar (P=0·002, F(3,40)=5·72, r2=0.21), of time between the beginning and end of the experiment (P=0·024, F(1,40)=5·51, r2=0·07), and the interaction between biochar concentration and time (P=0·002, F(3,40)=5·79, r2=0·22). The decrease in Ksat in the 0% biochar soil is likely to be because the soils were packed into columns and so over time the soil settled, as shown in Figure 1 by an increase in bulk density, resulting in reduced water flow through the soil.
The effect of biochar concentration and wheat root growth on Ksat at the end of the experiment. Error bars represent the standard errors.

The differences between Ksat in Figures 3 and 4 for soil ameliorated with biochar can be attributed to roots. Wheat roots create channels in the soil which, we hypothesise, allows a greater amount of water flow. As in Figures 3 and 4, increasing biochar concentration caused a decrease in Ksat, even though overall Ksat was higher at the end of the experiment. The gap between Ksat values from the first to the second measurement period decreases with increasing biochar. This could be due to biochar changing the soil structure by increasing soil microporosity. Increasing biochar concentration has been found to significantly increase Ksat in other studies (e.g., Asai et al. Reference Asai, Samson, Stephan, Songyikhangsuthor, Homma, Kiyono, Inoue, Shiraiwa and Horie2009; Major et al. Reference Major, Lehmann, Rondon and Goodale2010), with changes to soil structure from biochar addition being proposed as the explanation. Beck et al. (Reference Beck, Johnson and Spolek2011) found that soils containing 7% w/w biochar and no plants retained 2·1% more water than controls without biochar, Sedum trays retained 8·1% more water and for Ryegrass control, soils retained 0·1% more water.
2.4. Water droplet penetration time (WDPT)
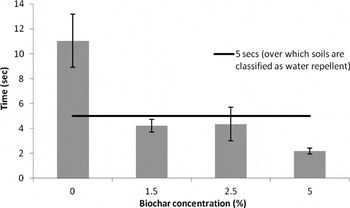
Figure 5 shows that the control soil took c.11 seconds to absorb the water droplet and is therefore classified as slightly water repellent, whereas the biochar soils all took <5 seconds and are therefore classified as wettable. The effect of biochar on soil water repellency was significant (P=0·006, F(3,8)=8·84, r2=0·77), with 5% biochar decreasing water repellency by the greatest amount, reducing soil hydrophobicity. There are conflicting arguments over the explanation for some soils displaying water repellency (Doerr et al. Reference Doerr, Woods, Martin and Casimiro2009). However, in the majority of instances, water repellency is thought to be due to the coating of soil particles with hydrophobic substances. Therefore, coarsely textured soils are more prone to hydrophobicity as they have a lower specific surface area (Scott Reference Scott2000). The surfaces of low temperature biochars are generally hydrophobic (Sohi et al. Reference Sohi, Lopez-Capel, Krull and Bol2009), so it may be expected that biochar would increase hydrophobicity. The heterogeneity of biochar with its high surface area allows both hydrophobic and hydrophilic molecules to sorb onto it, depending on the functional groups displayed by the biochar (Major et al. Reference Major, Steiner, Downie, Lehmann, Lehmann and Joseph2009). Biochar's ability to decrease soil hydrophobicity is important, because while soil hydrophobicity research has mainly been conducted in semi-arid or Mediterranean climates, as the effects are more prominent in areas that have long dry periods, soil hydrophobicity has also been reported for wetter climates such as the UK (Doerr et al. Reference Doerr, Shakesby and Walsh2000). The heterogeneous composition of biochar means its surfaces can exhibit hydrophilic and hydrophobic properties (Atkinson et al. Reference Atkinson, Sparkes and Mooney2010) and so the effect of different compositions of biochar on soil wettability is still largely unknown.
WDPT of soils containing increasing concentrations of biochar. Five seconds is deemed the time at which soils are considered to be water repellent (Bisdom et al. Reference Bisdom, Dekker and Schoute1993). Error bars represent the standard errors.

2.5. X-ray computed tomography (CT)
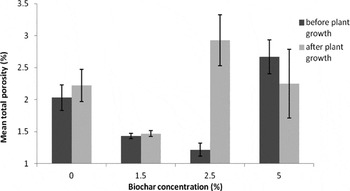
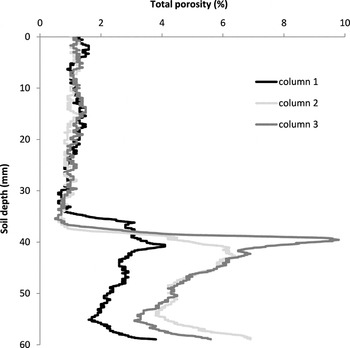
X-ray CT was used to quantify the effects of biochar concentration, time and wheat root growth on soil pore characteristics. Biochar concentration significantly affected total porosity (P=0·025, F(3,14)=4·23, r2=0·30), but the difference between the two sampling periods did not lead to any significant differences. However, the interaction between biochar concentration and the different sampling times was significant (P=0·014, F(3,14)=5·11, r2=0·36). When compared to the control soil, the 1·5% biochar soils had lower porosities and the 5% biochar soils had higher porosities, with the 2·5% biochar decreasing porosity in the first scan and increasing in the second scan. This result demonstrates the variable effect of biochar on soil total porosity and the high degree of spatial heterogeneity when examining soils at the micro scale. Jones et al. (Reference Jones, Haynes and Phillips2010) investigated the effect of biochar on phosphogypsum-amended residue sand and found percentage total porosity decreased with increasing biochar, also apparent in Figure 8 when 1·5% biochar was applied. However, Oguntunde et al. (Reference Oguntunde, Abiodun, Ajayi and Van de Giesen2008) identified a significant increase in total porosity in charcoal soil compared to adjacent soil, which was also found for 5% biochar in Figure 6. Figure 7 demonstrates the variability in total porosity with depth through the columns.
The effect of increasing biochar concentration on total soil porosity. Measured porosity only includes pores >63 µm. Error bars represent the standard errors.

Change in total porosity with depth for the three replicate columns containing 0% biochar when scanned at the end of the experiment.

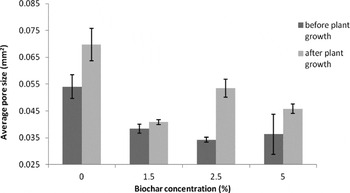
The effect of biochar concentration and a two-month time difference on average pore size. Error bars represent the standard errors.

Pore size distribution was found to be significantly affected by biochar concentration (P<0·001, F(3,14)=16·15, r2=0·57), with a general decrease in average pore size as biochar concentration increased. However, only macropores (>63 µm) were detected due to the scan resolution (Fig. 8). Decreasing size of macropores with biochar addition was also found by Jones et al. (Reference Jones, Haynes and Phillips2010), who noted increased meso- and micropores overall, leading to an increase in available water-holding capacity with the application of biochar to sand. Novak et al. (Reference Novak, Lima, Xing, Gaskin, Steiner, Das, Ahmedna, Rehrah, Watts, Busscher and Schomberg2009) found an increase in soil water retention with biochar addition, thought to be due to an increase in biochar polarity, improved soil aggregation or an increase in micropores. An increase in available water-holding capacity in soil through biochar addition will provide more water for plants and allow growth to continue during dry periods, and greater water content at field capacity should reduce the flow of water and nutrients down the soil profile. The difference in pore size in the soil treatment was also significant between the start and end of the experiment (P<0·001, F(1,14)=20·69, r2=0·24), and resulted in an increase in pore size from the first to the second, likely due to the presence of wheat roots causing cavity expansion.
2.6. Wheat growth
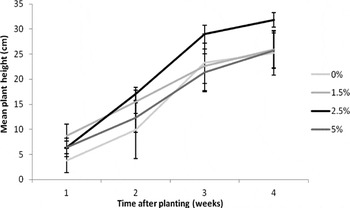
Biochar concentration did not significantly affect plant height, but Figure 9 does show that 2·5% biochar caused the greatest increase in plant height between weeks two to four, suggesting that biochar does have the potential to improve crop growth, although this was not found in this study. Figure 10 shows that an increase in biochar generally caused an increase in dry weight of roots and shoots, but the influence of biochar was not significant. Results for 1·5% biochar are lower than expected, because in one of the columns only one wheat plant germinated. There is also a suggestion that while 2·5% additions of biochar appear to enhance plant growth, additions of 5% have the opposite effect.
Showing the increase in plant height of wheat over the four-week growing period for columns containing different biochar concentrations. Error bars represent the standard errors.

Dry weights of above ground and root biomass for the biochar treatments. Error bars represent the standard errors.

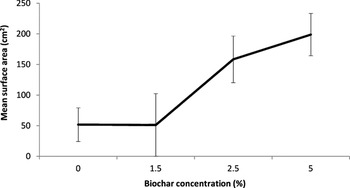
Figure 11 shows an increase in root surface area with increasing biochar, suggesting that biochar did increase the number of wheat roots, but not significantly. Root surface area was calculated by scanning the roots using WinRHIZO; an example of the root scans is shown in Figure 12. Other measurements taken using this method include root total length, diameter and volume; however, none of the wheat measurements showed a significant effect from increasing biochar concentration, or due to the presence of biochar compared to no biochar.
Showing how addition of biochar affected root surface area. Error bars represent the standard errors.

WinRHIZO image scans of the roots from a column containing (a) 0% biochar and (b) 5% biochar.

3. Conclusions
This study showed that biochar significantly improved soil physical properties, but not wheat growth. Soil physical properties such as bulk density and Ksat were improved when increasing biochar concentrations were applied to the soil, improving soil quality. We have shown that when more biochar is applied, soil with biochar is able to retain more water. An increase in biochar led to a decrease in soil hydrophobicity. This is important, because if soil temperatures rise due to global warming, there is likely to be an increase in soil hydrophobicity in the UK, so biochar could be applied to reduce hydrophobicity, which reduces infiltration of water into soil. CT scanning showed that pore size is reduced when biochar is added to a sandy loam soil, but biochar has a variable effect on total soil porosity. A reduction in pore size with increased water retention means that water is being stored in smaller pores within the soil and that drainage is retarded. The results of this study show that application of biochar to UK soils could be used as a mitigation method against increased temperatures and drought by allowing soil to retain more of the available water, supporting crop production. However, extensive further testing is required to validate this finding, including work over longer time scales than considered here, as well as assessment of the impacts of varying composition in biochar materials.