Introduction
Understanding the developmental programming of chronic diseases is relevant due to the increasing exposure of offspring to undernutrition or overnutrition, obesity, and maternal diabetes. Reference Spradley, Smith, Alexander and Anderson1 Diabetes mellitus (DM) affects around 537 million people, and could reach 783 million by 2045. 2 Hyperglycemia during pregnancy is responsible for adverse effects on both mothers and children in the perinatal period. Reference Hod, Kapur and Sacks3 Furthermore, maternal diabetes can affect the long-term development of offspring, causing diabetes and other metabolic diseases in adulthood. Reference Tozour, Hughes, Carrier, Vieau and Delahaye4
One of the main organs susceptible to the effects of oxidative stress induced by hyperglycemia is the liver. Reference Bugianesi, McCullough and Marchesini5 The hyperglycemic state favors the formation of advanced glycation products, cytoplasmic accumulation of oxidized proteins, and mitochondrial dysfunction, which contribute to insulin resistance, inflammation, and cell death. Reference Yzydorczyk, Li and Chehade6,Reference González, Lozano, Ros and Solano7 These changes cause liver damage, including metabolic dysfunction-associated fatty liver disease (MAFLD), which is the most common cause of liver disease and is responsible for increasing global mortality. Reference Eslam, Newsome and Sarin8 The mechanism involved in liver injury caused by DM is unclear and is connected to the autophagy process. Reference Joo, Song and Park9
Autophagy is an important cellular process, mediated by lysosomes, which involves the degradation of senescent organelles and damaged proteins and lipids, which provide nutrients necessary to the cell’s energy needs and ensure quality control in organelles. Reference Madrigal-Matute and Cuervo10,Reference Arden11 This process is divided into three main types: macroautophagy, microautophagy, and chaperone-mediated autophagy. Reference Madrigal-Matute and Cuervo10 Macroautophagy accounts for more than 90% of cellular autophagy. Reference Arden11,Reference Yao, GangYi and QiNan12 Therefore, this article will focus on the mechanisms involved in macroautophagy, which will be referred to as autophagy. The autophagic process includes three main stages: formation of the autophagosome, fusion of the autophagosome with lysosomes, forming the autolysosome, and the degradation of the engulfed substrate by lysosomal enzymes. Reference Arden11
In peripheral tissues such as the liver, autophagy plays an important role in glycogenolysis, gluconeogenesis, fatty acid β-oxidation, and lipid droplet degradation. Reference Madrigal-Matute and Cuervo10 Qian et al. Reference Qian, Zhang and Orwig13 demonstrated that the suppression of autophagic regulators and decreased lysosomal activity in hepatocytes compromise the liver’s ability to adapt to metabolic stress and impair insulin action. Additionally, a systematic review and meta-analysis demonstrated that murine (mice and rats) with diabetes induced by a high-fat diet (HFD) showed a decreased autophagic response according to blood glucose, fat percentage, long-term exposure to HFD, or an increase in the animal’s age. Reference da Cruz, Vesentini, Sinzato, Villaverde, Volpato and Damasceno14 However, most studies were carried out in males, and a scarcity of female studies leaves open questions about the possible alteration of the autophagic process in female animals. Reference da Cruz, Vesentini, Sinzato, Villaverde, Volpato and Damasceno14 Furthermore, the presence of maternal hyperglycemia is also an important issue to be explored regarding whether there is an interference with the modulation of autophagy in liver tissue in adult female pups.
In this study, we hypothesized that a diabetogenic environment during pregnancy and the consumption of an HFD during the postnatal period would compromise metabolic parameters and biomarkers of the autophagy process in the liver tissue of adult female rats. Therefore, this study aimed to evaluate the metabolic effects and modulation of hepatic autophagy in adult female pups from diabetic rats, whether or not subjected to HFD, in the postnatal period.
Methods
Ethical approval
All experimental procedures applied in this study are in accordance with the National Institutes of Health Guide for the Care and Use of Laboratory Animals 15 and the ARRIVE (Animal Research: Reporting of In Vivo Experiments) guidelines and were approved by our institution’s Animal Research Ethics Committee (Protocol CEUA Number: 1341/2019).
Animals
For this study, we used male and female Sprague Dawley rats (three months old, 200 ± 50 g of body weight). The animals were adapted to and housed at the local laboratory vivarium under standard laboratory conditions (temperature: 22 ± 2°C; humidity: 50 ± 10%; and a light/dark cycle: 12/12 h). Filtered water and a standard diet (Kcal content: 28.54% protein, 62.65% carbohydrate, 8.7% fat, Purina®, São Paulo, Brazil) were offered ad libitum. The animals remained in polypropylene cages (41×34×16 cm) lined with autoclaved wood shavings, with three animals per cage, and as a form of environmental enrichment, paper balls were placed in the cages.
Parental generation experimental sequence (F0)
The experimental sequence is summarized in Fig. 1. For diabetes induction, female rats received the beta (β)-cytotoxic drug Streptozotocin (Sigma-Aldrich Chemical Company®, USA, dose of 70 mg/kg, subcutaneously) on postnatal day 5 (PND). Reference Sinzato, Klöppel and Miranda16 For the nondiabetic group composition (control – C), female rats (PND5) received the equivalent vehicle volume (citrate buffer – 0.01 M, pH 4.5). At 75 PND (adulthood), the rats were submitted to the oral glucose tolerance test (OGTT) to evaluate glycemic values and to characterize the inclusion criteria. For this, after 6 h of fasting, a drop of blood was collected from the rats’ tails for glycemic determination (time 0). Next, the D-glucose solution (Sigma Chemical Company®, USA, 2.0 g/kg body weight) was intragastrically administered by gavage. 30, 60, and 120 min after the administration of the glucose solution, blood glucose levels were measured using a conventional glucometer, with values ≥200 mg/dL in at least one point on the OGTT confirming diabetes. 2,Reference Sinzato, Klöppel and Miranda16 For the control group, only rats with blood glucose levels measuring <140 mg/dL at least three times during the OGTT were included. Female rats not presenting the above characteristics were anesthetized using sodium thiopental (Thiopentax®, Cristália, Brazil – 120 mg/kg dose), euthanized, and excluded from this study.
Experimental design.

To obtain mothers with and without diabetes (generation parental) and to reproduce an inadequate intrauterine environment from the induction of diabetes, after the inclusion criteria on PND 90, the diabetic (D) and control (C) female rats were mated with normoglycemic males. The next morning, pregnancy was confirmed when sperm were found in the vaginal smear, and this was designated as day 0 of pregnancy. Female rats that did not mate after 15 consecutive days were considered infertile and excluded from this study. Reference Sinzato, Klöppel and Miranda16 Only during pregnancy were the rats kept in individual boxes for monitoring. The offspring were obtained through vaginal delivery, and after birth, due to the number of functional teats and to ensure equal access to breast milk, no more than eight puppies were kept per litter until weaning (PND 22), maintaining as close as possible to a 1:1 sex ratio, that is, 4 males and 4 females. Reference Zambrano, Martínez-Samayoa and Bautista17
Experimental sequence of female pups from nondiabetic (control) and diabetic mothers (first generation – F1)
Sample size calculation was performed based on experiment studies, Reference Zhou and Ye18–Reference Paula, Sinzato and Gallego20 using 80% power and a 5% type I error. The effect size was determined by a specialist in biostatistics at our institution, with a minimum of 5 rats per group of female pups.
After weaning, two female adult pups from each control (FC) and diabetic (FD) mother were distributed into four experimental groups (minimum n = 5 animals/group): FC/SD – female adult pups fed a standard diet after weaning from control mothers; FC/HFD – female adult pups fed a high-fat diet after weaning from control mothers; FD/SD – female adult pups fed a standard diet after weaning from diabetic mothers; FD/HFD – female adult pups fed a high-fat diet after weaning from diabetic mothers.
The FC and FD rats received a standard diet (SD – with Kcal content: 28.54% protein, 62.65% carbohydrate, 8.7% fat, Purina®, São Paulo, Brazil) or a high-fat diet (HFD – with kcal content: 23.43% protein, 46.63% carbohydrate, 30% fat) from weaning (PND 21) until PND 120, Reference Paula, Sinzato and de Moraes-Souza21 a period equivalent to childhood, adolescence, and adulthood in humans. Reference Lomas-Soria, Reyes-Castro and Rodríguez-González22 The HFD was prepared in our institution using lard as a fat source and maintained under refrigeration until the time of use. To prepare 10 kg of HFD, the following ingredients were used: soybean meal (3.443 kg), sorghum (0.800 kg), soybean peel (1.167 kg), corn starch (0.200 kg), refined sugar (1.500 kg), lard (1.400 kg), vitamins and minerals (containing approximately: 50 mg/kg of iron, 0.05 mg/kg of selenium, 0.05 mg/kg of biotin, 20 μg/kg of vitamin B12, 7 mg/kg of vitamin B6, 1800 UI/kg of vitamin D3 and 12.000 UI/kg of vitamin A), and salt (0.040 kg). An additional bromatological comparison between the diets is shown in Supplementary Table S1.
Oral glucose tolerance test (OGTT), euthanasia of animals, and sample collection
In PND 115, after 6 h of fasting, OGTT was performed to assess glucose tolerance, as previously described, and these measurements were used to estimate the area under the curve (AUC) using the trapezoidal method. Reference Tai23
In PND 120, the rats were anesthetized with sodium thiopental (120 mg/kg, intraperitoneally) and euthanized by decapitation for blood sampling. The animals were then submitted to laparotomy for liver collection. The relative weight of the liver was calculated using the following equation: (organ weight/body weight of each animal) × 100, and the result was expressed in grams/100 g body weight (g/100g b.w.). Subsequently, the left lobe of the liver of each animal was collected to determine oxidative stress markers, measure cytokines, evaluate protein expression, and store in formaldehyde for histological analyses.
Assessment of the biochemical profile
Blood samples were collected without an anticoagulant and centrifuged at 1,575 × g for 10 min at 4°C to obtain serum samples. The serum samples were then stored at −80°C and subsequently used to measure the biochemical parameters using commercial kits (Wiener®, Argentina): aspartate aminotransferase (AST) (code #1751302), alanine aminotransferase (ALT) (code #1761302), triglycerides (code #1780105), and total cholesterol (code #1220114), according to the manufacturer’s specifications. Very-low-density lipoprotein (VLDL-cholesterol) was determined by a mathematical calculation proposed by Knopfholz et al. Reference Knopfholz, Disserol and Pierin24 All analyses were carried out with the investigator blinded and measured using light spectrometry using UV1800 equipment (Shimadzu Europe®, Germany). Subsequently, the TyG index was calculated using the following equation: TyG = Ln [fasting triglycerides (mg/dL) × fasting blood glucose (mg/dL) / 2], and used as a tool to assess insulin resistance. Reference Guerrero-Romero, Simental-Mendía and González-Ortiz25 To assess liver damage, the Ritis ratio was calculated (Ritis ratio = AST concentration/ALT concentration). Reference De, Coltorti and Giusti26
Analysis of hepatic oxidative stress markers
For the analysis of oxidative stress, all biomarkers were estimated in liver homogenates. Thiobarbituric acid reactive substances (TBARS), hydrogen peroxide (H2O2), and reduced thiol groups (-SH), as well as the antioxidant activities of superoxide dismutase (SOD), catalase (CAT), and glutathione peroxidase (GPx) were determined. Fresh fragments of liver tissue were collected and frozen at −80°C. These liver samples were homogenized using the bullet blender system with zirconium beads and the addition of phosphate-buffered saline (PBS-0.1M Na2HPO4, 0.1M KH2PO4, 0.1M EDTA, pH 7.8) and a protease inhibitor (Sigma-Aldrich Chemical Company®, USA) was used for GPx, CAT, -SH, and H2O2 assays. RIPA Lysis Buffer 1× buffer (Millipore®, USA) was used for TBARS, and a solution with 20 mM HEPES, 1 mM EGTA, 210 mM mannitol, and 70 mM sucrose (pH 7.2) was used for SOD. Reference da Cruz, Barco and Paula27 Then, the samples were centrifuged as previously described by Da Cruz et al. Reference da Cruz, Barco and Paula27 After centrifugation, the supernatant was stored in a freezer at − 80°C, and all oxidative stress markers were performed using the technique of Sinzato et al. Reference Sinzato, Rodrigues and Cruz28 Total protein concentrations were determined by the Bradford method. Reference Bradford29
Analysis of cytokines in liver tissue
To evaluate the cytokine profile, 100 mg of liver tissue from each animal was homogenized in RIPA Lysis Buffer 1× (Millipore®, USA), with the addition of the protease inhibitor (Sigma-Aldrich Chemical Company®, USA). Subsequently, the samples were centrifuged at 1,600 × g for 10 min at 4°C to obtain homogenates. Tumor necrosis factor-alpha (TNF-α) (code #DY510-05), interleukin-6 (IL-6) (code #DY506-05), and interleukin-10 (IL-10) (code #DY522-05) were determined by the enzyme-linked immunosorbent assay (sandwich ELISA, R&D Systems®, USA) method according to the manufacturer’s instructions. Absorbances were determined using an ELISA microplate reader (Biotek®, USA) with a wavelength of 450 nm, and cytokine concentration was calculated.
Hematoxylin and eosin (HE) staining and histomorphometric analysis
Liver tissue was fixed in 10% formaldehyde (P.A.) for 24 h, dehydrated in progressive alcohol concentrations, cleared in xylene, and embedded in paraffin for cutting using a microtome (Thermo Scientific® HM 340E, Brazil). Histological sections of 5 μm were stained with hematoxylin and eosin (HE). After staining in HE, the photomicrographs were captured blinded using a computerized image system (Software KS-300, version 3.0, Zeiss®, Germany), which receives an image from a digital camera (CCD-IRIS/RGB, Sony®, Japan) attached to the microscope (DMR, Leica®, Germany). The images of H&E-stained liver specimens were processed using ImageJ software (National Institutes of Health, USA) for morphometric analysis by counting the number of hepatocytes, area fraction, and the number of lipid droplets. Reference Piao, Sultana and Holyoak30
Histological detection of lipofuscin accumulation
The presence of lipofuscin, non-digestible residues in lysosomes formed by oxidized insoluble proteins, was identified using liver tissue fragments that were fixed in 10% formaldehyde (P.A.) for 24 h, dehydrated in progressive alcohol concentrations, cleared in xylene, and embedded in paraffin. Histological sections of 5 μm were obtained in microtome (Thermo Scientific® HM 340E, Brazil) and were stained with 0.3% Sudan Black (Êxodo Científica®, Brazil) for 30 min. They were then washed with distilled water to remove excess dye, dried for 30 min at room temperature, and counterstained with Harris hematoxylin for 3 min. The images were captured using a computerized imaging system (Software KS-300, version 3.0, Zeiss®, Germany), which receives an image from a digital camera (CCD-IRIS/RGB, Sony®, Japan) attached to the microscope (DMR, Leica®, Germany). The blind analyses were carried out according to the methodology of Yzydorczyk et al., Reference Bechmann, Hannivoort, Gerken, Hotamisligil, Trauner and Canbay31 and the area marked for lipofuscin staining was quantified using ImageJ software (National Institute of Health, USA). The results are reported as the percentage of lipofuscin area compared to the total area.
Western blotting of autophagy and apoptosis markers in the liver
Samples from the left lobe were frozen in liquid nitrogen and stored in a − 80°C freezer until processing. Samples were extracted using RIPA Lysis Buffer 1x (Millipore®, USA) with the addition of protease and a phosphatase inhibitor (Sigma-Aldrich Chemical Company®, USA). Liver homogenates were centrifuged at 1,575 × g for 20 min at 4°C to remove insoluble material. Protein content in the homogenates was determined using the Bradford method,29 and then the samples were normalized and denatured in the sample buffer (50 mM Tris-HCl, pH 6.8, 1% SDS, 5% 2-mercaptoethanol, 10% glycerol, 0.001% bromophenol blue). Aliquots containing 70 μg of total proteins were separated on a polyacrylamide gel (SDS-PAGE, 8 a 12%). Rainbow markers were run in parallel to estimate the molecular weights (Bio-Rad®, USA). After electrophoresis, the proteins were transferred to a nitrocellulose membrane (Millipore®, USA). To verify that equal amounts of liver protein were charged in each well and the efficiency of the transference, membranes were stained with Ponceau stain (Sigma–Aldrich Chemical Company®, USA). The membranes were blocked in 5% nonfat milk and incubated with the specific primary antibodies diluted in tris-buffered saline and Tween 20 (TBS-T, Sigma-Aldrich Chemical Company®, USA) for 16 h at 4°C: anti-mTOR Ser/Thr (Cell Signaling®, USA, code #2983, 1:1000), anti-AMPK alpha (α) 1 (Abcam®, UK, code #ab32047, 1:800), anti-Phospho-AMPKα-1,2 (Thermofisher®, USA, code #PA5-17831, 1:800), anti-Beclin-1 (BD Bioscience®, USA, code #612112, 1:800), anti-ATG-5 (Cell Signaling®, USA, code #12994, 1:1000), anti-ATG-7 (Cell Signaling®, USA, code #8558, 1:800), anti-LC3 A/B (Cell Signaling®, USA, code #12741, 1:800), anti-p62/SQSTM1 (Elabscience®, USA, code #70387, 1:800), anti-LAMP-2 (Cell Signaling®, USA, code #49067, 1:500), anti-BCL-2 (Cell Signaling®, USA, code #15071, 1:800), anti-FAS (Bd Bioscience®, USA, code #610197, 1:800), anti-BAX (Elabscience®, USA, code #13814, 1:800), anti-cleaved caspase-3 (Abcam®, UK, code #ab2302, 1:500), and β-actin (Cell Signaling®, USA, code #3700, 1:1000).
After this incubation, the membranes were washed 3 times with TBS-T, followed by an incubation with the HRP-conjugated secondary antibody at room temperature for 1h: Anti-rabbit IgG (Cell Signaling®, USA, code #7074, 1:10,000) or Anti-mouse (Cell Signaling®, USA, code #7076, 1:10,000), specific for each primary antibody. After another series of washes, the membranes were developed using the Chemiluminescent HRP antibody detection ECL reagent (Bio-Rad®, USA), and the ECL signals were captured using a CCD camera G:BOX system (Syngene, Cambridge®, UK). The integrated optical densities of the targeted protein bands were measured using ImageJ software (National Institute of Health, USA). The protein expression levels were normalized to β-actin and the results were expressed in fold change as the mean ± standard deviation (SD).
Statistical analysis
The results were analyzed with the help of our institution’s biostatistical specialist. Data are reported as mean ± SD. After the normality test using Shapiro–Wilk, a comparison among groups was performed using a one-way analysis of variance (ANOVA) followed by Tukey’s multiple comparison test. The gamma distribution tests, followed by Wald’s multiple comparison test, were used if data presented an asymmetric distribution. All statistical analyses were performed using SAS software for the Windows program, v.9.4. A p-value of less than 0.05 was considered statistically significant.
Results
Criteria of inclusion for diabetic and nondiabetic rat mothers
Figure 2 represents the OGTT of mothers with mild diabetes (diabetic) and control mothers (F0 generation). The diabetic group had blood glucose levels of >200 mg/dL in at least one test point, in accordance with the inclusion criteria used in our study, confirming the diabetes status. Also, rats included in the control group had blood glucose levels of <140 mg/dL at all time intervals during the OGTT. The diabetic group presented a high value of circulating blood glucose in 120 min in the AUC assessment.
(a) Oral glucose tolerance test (OGTT) and (b) area under the curve (AUC) of control mothers and mothers with mild diabetes induced by streptozotocin at 75 days of life. Data are shown as mean ± standard deviation. (n = 10 animals/group). *p < 0.05 – compared to the control (non-diabetic) group (gamma distribution followed by Wald’s multiple comparison test).

General characteristics in female pups
When performing the OGTT in adult female pups, fasting blood glucose was elevated in the FD/SD group compared to the FC/SD group. The FC/HFD, FD/SD, and FD/HFD groups showed increased AUC in relation to the FC/SD group, being more exacerbated in the FD/HFD group compared to the groups from non-diabetic mothers (control).
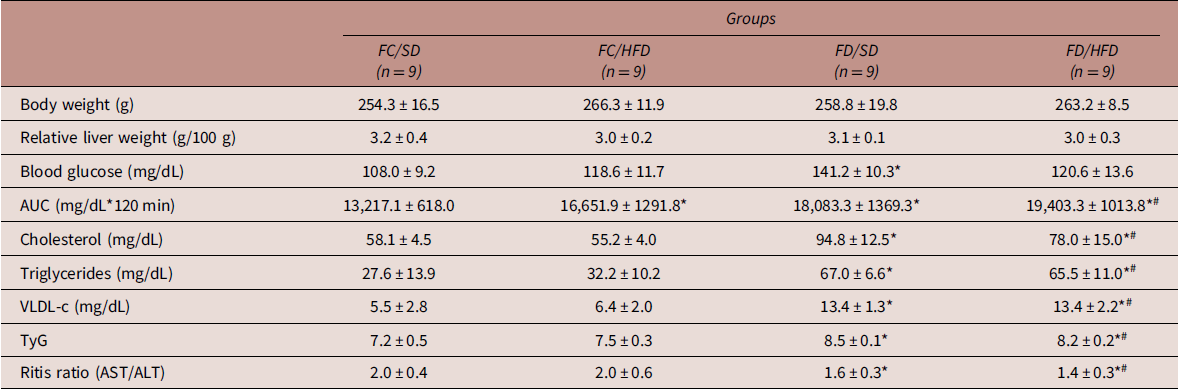
Female adult pups from diabetic rats (FD/SD and FD/HFD) had increased serum concentrations of cholesterol, triglycerides, and VLDL-c in relation to female adult pups from non-diabetic rats. Concomitantly, groups FD/SD and FD/HFD had higher insulin resistance confirmed by the TYG index and decreased Ritis ratio when compared to FC/HFD and FC/SD groups. There were no changes in body weight or relative liver weight in female adult pups from non-diabetic or diabetic rats (Table 1).
Body weight, relative liver weight, and biochemical parameters of female adult pups from non-diabetic (control – FC) or diabetic (FD) groups, fed with a high-fat diet (HFD) or not (SD), from weaning until to 120 days of postnatal life

AUC, area under the curve; VLDL-c, very-low-density lipoprotein; TyG, product of fasting triglycerides and fasting blood glucose; AST, aspartate aminotransferase; ALT, alanine aminotransferase. Values expressed as mean ± standard deviation.
* p < 0.0001 – compared to the FC/SD group.
# p < 0.0001 – compared to the FC/HFD group.
(ANOVA followed by Tukey’s multiple comparisons test).
Liver histomorphometric analysis
Pathological changes in liver tissue sections stained with HE were observed under microscopic examination (Fig. 3). In the FC/SD group, lobules were integral in structure, liver cells were arranged in order, nuclei were located in the center of cells, and cytoplasmic staining was even. Small vacuolar fat droplets were occasionally seen. In contrast, in the FC/HFD and FD/HFD groups, lobules were irregular and lipid droplets were seen most frequently. In the FD/HFD group, hepatocytes were arranged irregularly and parts of them were less structured with vacuolar fat droplets occupying the cytoplasm. The histomorphometric analyses confirmed that the FD/HFD animals showed an increase in the number of lipid droplet structures and a higher percentage of area with droplets when compared to the other groups. In addition, the number of hepatocytes per captured area was higher in the FC/HFD, FD/SD, and FD/HFD groups in relation to the FC/SD, and in the FD/HFD group compared to the FC/HFD rats (Fig. 3).
Photomicrographs of liver tissue stained with hematoxylin and eosin (HE) on day 120 days of life in adult female pups from non-diabetic (control – FC) or diabetic (FD) groups, fed with a high-fat diet (HFD) or not (SD), from weaning until to 120 days of postnatal life. The yellow arrow represents lipid droplets visualized as circular or slightly elliptical particles and the black arrow represents the hepatocyte. (a) FC/SD group; (b) FC/HFD group; (c) FD/SD group; (d) FD/HFD group; (e) percentage of the area with lipid droplets in relation to the total area; (f) counting the number of lipid droplets; (g) hepatocyte count per captured area; magnification: 40×. (These images are representative from n = 5 animals/50 photos/group.) Data are shown as mean ± standard deviation. *compared to the FC/SD group; #compared to the FC/HFD group; $compared to the FD/SD group (ANOVA followed by Tukey’s multiple comparisons test).

Lipid peroxidation and hepatic antioxidant capacity
The analyses of liver homogenate samples showed that TBARS concentrations were higher in FD/HFD rats compared to the other groups and had increased SOD enzyme activity compared to the FD/SD group. Furthermore, FD/SD and FD/HFD rats had lower H2O2 levels and high CAT activity compared to control groups. GPx activity was elevated in the FD/SD group compared to the FC/SD group and lower in the FD/HFD group compared to the FD/SD group. There was no difference in -SH concentrations (Fig. 4).
Oxidative stress biomarkers in the liver samples [(a) TBARS, thiobarbituric acid reagent species concentration; (b) SOD, superoxide dismutase activity; (c) H2O2, hydrogen peroxide concentration; (d) GPx, glutathione peroxidase activity; (e) CAT, catalase activity; and (f) −SH, reduced thiol groups concentration] on day 120 days of life in adult female pups from non-diabetic (control – FC) or diabetic (FD) groups, fed with a high-fat diet (HFD) or not (SD), from weaning until to 120 days of postnatal life. Data are shown as mean ± standard deviation (n = 9 animals/group). *compared to the FC/SD group; #compared to the FC/HFD group; $compared to the FD/SD group (gamma distribution followed by Wald’s multiple comparison test).

Biomarkers of liver inflammation
Figure 5 shows cytokine concentrations in liver tissue. HFD caused an increase in the hepatic concentration of pro-inflammatory cytokine TNF-α regardless of maternal origin. In addition, the FD/HFD group showed higher IL-6 concentrations compared to the FD/SD rats and increased hepatic IL-10 concentrations when compared to the FC/HFD group.
Cytokine concentrations in the liver [(a) tumor necrosis factor-alpha (TNF-α); (b) interleukin-6 (IL-6); and (c) interleukin-10 (IL-10)] on day 120 days of life in adult female pups from non-diabetic (control – FC) or diabetic (FD) groups, fed with a high-fat diet (HFD) or not (SD), from weaning until to 120 days of postnatal life. Data are shown as mean ± standard deviation (n = 9 animals/group). *compared to the FC/SD group; #compared to the FC/HFD group; $compared to the FD/SD group (ANOVA followed by Tukey’s multiple comparisons test).

Hepatic autophagy evaluation on female pups in adulthood
To study the regulation of autophagy in the liver, the expression of proteins involved in various stages of the process was analyzed (Fig. 6). The expression of mTOR and ATG-7 proteins were increased and the expression of p-AMPKα, the LC3-II/LC3-I ratio, and LAMP-2 were decreased in the FC/HFD group compared to the FC/SD rats. We observed an increase in p-AMPKα levels and the LC3-II/LC3-I ratio, the accumulation of the p62/SQSTM1 protein, and a lower protein expression of LAMP-2 in FD/SD rats in comparison to the FC/SD group. Regarding protein expression in FD/HFD rats, an increase in the LC3-II/LC3-I and LAMP-2 ratio was observed in relation to FC/HFD rats. The protein expression of p-AMPKα, the LC3-II/LC3-I ratio, and p62/SQSTM1 were decreased, and LAMP-2 increased in FD/HFD rats compared to FD/SD rats. However, LAMP-2 was reduced in the FD/HFD group relative to the FC/SD group. There was no significant difference in the expression of Beclin-1 and ATG-5 proteins.
Hepatic protein expression of autophagy regulators on day 120 days of life in adult female pups from non-diabetic (control – FC) or diabetic (FD) groups, fed with a high-fat diet (HFD) or not (SD), from weaning until to 120 days of postnatal life. (a) Western blotting with densitometric analysis of autophagy-related proteins; fold change of (b) mTOR; (c) p-AMPKα; (d) AMPKα; (e) Beclin-1; (f) ATG-5; (g) ATG-7; (h) LC3-II/LC3-I; (i) p62/SQSTM1; (j) LAMP-2. Mean densitometric values normalized for β-actin expression ± standard deviation from at least three repeated, independent WB experiments. (n = 6 animals/group). *compared to the FC/SD group; #compared to the FC/HFD group; $compared to the FD/SD group (gamma distribution followed by Wald’s multiple comparison test).

Histological detection of incomplete autolysosomal digestion
At 120 PND, the cytoplasmic accumulation of highly oxidized insoluble proteins and lipids, known as lipofuscin, was evaluated in livers using Sudan black marking. It was found that the percentage of area labeled for lipofuscin was greater in the FC/HFD, FD/SD, and FD/HFD groups compared to the FC/SD group. The FD/HFD rats showed a smaller marked area in relation to the FD/SD group (Fig. 7).
Photomicrograph of lipofuscin staining with Sudan black B in the liver (a, c, e, g) and color deconvolution using ImageJ software (b, d, f, h) on day 120 days of life in adult female pups from non-diabetic (control – FC) or diabetic (FD) groups, fed with a high-fat diet (HFD) or not (SD), from weaning until to 120 days of postnatal life. A “stack image” was generated from FC/SD (a and b), FC/HFD (c and d), FD/SD (e and f) and FD/HFD (g and h) groups to quantify the stained structure area using ImageJ software. The results are reported as the percentage of lipofuscin staining area of the total area (i). Magnification: 40×. (These images are representative from n = 5 animals/50 photos/group.) Data are shown as mean ± standard deviation *compared to the FC/SD group; $compared to the FD/SD group (ANOVA followed by Tukey’s multiple comparisons test).

Assessment of apoptosis markers
Analysis of the expression of apoptosis-related proteins in liver homogenates revealed that FC/HFD rats showed decreased BCL-2 protein expression and an increased BAX/BCL-2 ratio in relation to the FC/HFD group. FD/SD rats had reduced BCL-2 expression and a greater expression of cleaved caspase-3 compared to the FC/SD group. However, when adult female pups from diabetic dams were supplemented with HFD (FD/HFD), there was also lower BCL-2 expression compared with the FC/SD and FD/SD groups, an increased BAX/BCL-2 ratio in relation to FC/SD rats, and reduced expression of cleaved caspase-3 compared to the FD/SD group. There were no changes in the expression of FAS and BAX among the experimental groups (Fig. 8).
Hepatic protein expression of apoptosis process on day 120 days of life in adult female pups from non-diabetic (control – FC) or diabetic (FD) groups, fed with a high-fat diet (HFD) or not (SD), from weaning until to 120 days of postnatal life. (a) Western blotting with densitometric analysis of apoptosis-related proteins; fold change of (b) FAS; (c) BAX; (d) BCL-2; (e) BAX/BCL-2; (f) cleaved caspase 3. Mean densitometric values normalized for β-actin expression ± standard deviation from at least three repeated, independent WB experiments. (n = 6 animals/group). *compared to the FC/SD group; $compared to the FD/SD group (gamma distribution followed by Wald’s multiple comparison test).

Discussion
This is an unprecedented study, as there are no reports on the association between maternal diabetes and anHFD from weaning until adulthood (120 days of life) in female pups from diabetic or non-diabetic rats (control) for the evaluation of metabolic changes and the modulation of hepatic autophagy. In this study, the introduction of an HFD from weaning to adulthood resulted in changes in glucose homeostasis in the female pups of control mothers, reinforcing the importance of a healthy diet. Furthermore, there was an impairment in autophagy, an important process in the degradation of senescent organelles, damaged proteins, and lipids droplets, which play a role in the pathogenesis of MAFLD. Furthermore, we observed that the alteration of the autophagic mechanism is associated with AMPK signaling and may be a consequence of fetal programming caused by maternal diabetes and/or inadequate nutrition. The “multiple insults model” is accepted to explain the progress of liver diseases. Reference Eslam, Newsome and Sarin8,Reference Bechmann, Hannivoort, Gerken, Hotamisligil, Trauner and Canbay31 In this study, we showed that exposure to a hyperglycemic maternal environment during crucial stages of development (conception, embryo-fetal, and breastfeeding periods) represented the first issue, and an HFD intake, from weaning to adulthood, represented the second issue, with damage to the liver evidenced by increased hepatic lipid deposition, the presence of oxidative stress, and the elevation of inflammatory cytokines.
The mild diabetes induction model used in this study, with STZ injection on PND5, was effective in causing hyperglycemia, as confirmed by the higher glycemic levels seen in the OGTT and in the AUC calculation of the mother rats, leading to an unfavorable intrauterine environment. When analyzing the OGTT in female pups, we showed that both maternal diabetes and the postnatal consumption of HFD were responsible for the presence of diabetes in adulthood. Abnormalities in the maternal organism, such as maternal diabetes or malnutrition, can induce adaptations in fetal development, creating a vicious cycle of metabolic dysfunction transmitted from other generations, as pointed out by the DOHaD concept. Reference Paula, Sinzato and de Moraes-Souza21,Reference da Cruz, Barco and Paula27,Reference Gallego, Barco and Sinzato32 The effect is significant even when maternal hyperglycemia exceeds the control glycemic value by only 20%. Reference Aerts and Van Assche33 Furthermore, fetal programming induced by maternal hyperglycemia resulted in insulin resistance, confirmed by the TyG index, which relates insulin resistance to fat distribution and deposits. Reference Vasques, Novaes and de Oliveira Mda34 In our research, we observed a reduction in the Ritis ratio in female pups from diabetic rats. Decreased Ritis ratio (AST/ALT) in humans Reference Niu and Zhou35 and rats Reference Müllebner, Herminghaus and Miller36 is associated with insulin resistance and steatohepatitis. Reference Niu and Zhou35,Reference Sorbi, Boynton and Lindor37
In this study, female pups from diabetic dams presented hyperlipidemia, corroborating another study developed in our laboratory. Reference Paula, Sinzato and de Moraes-Souza21 When insulin-resistant tissues fail to accelerate glucose uptake, the extra glucose can return to the liver, where it increases de novo lipogenesis, gluconeogenesis, and hepatic glycogenolysis. In this way, glucose provides the glycerol skeleton for the synthesis of triglycerides via triose-phosphate or increases concentrations of Acetyl-CoA from glycolysis and, consequently, increases entry into the citric acid cycle, in which citrate formed from the union of Acetyl-CoA with oxaloacetate may be diverted from the metabolic route for the synthesis of fatty acids. Reference Arab, Arrese and Trauner38,Reference Finck39 Furthermore, insulin resistance in adipose tissue can increase the influx of fatty acids into the liver. Reference Finck39 The liver is the only solid organ that uses regenerative mechanisms to ensure that the liver/body weight ratio is equivalent to maintain body homeostasis. Reference Michalopoulos and Bhushan40 In addition, the liver histomorphometric analyses showed the presence of lipid accumulation and an increased number of hepatocytes (in an attempt to restore liver function). However, we observed microsteatosis in female pups from diabetic rats with 120 days of life, equivalent to 30 years of human age. Reference Quinn41 Thus, we suggest a possible transition to macrosteatosis with increasing animal age and/or a longer period of HFD administration.
Reactive oxygen species (ROS) can be formed during the oxidation of fatty acids, electron transport in the mitochondrial respiratory chain, and reactions that occur in the cytochrome P-450 system. Reference Devarajan, Rajasekaran, Valburg, Ganapathy, Bindra and Freije42 In response to ROS, liver enzymes perform antioxidant defense, including SOD, CAT, and GPx. Reference Bak, Na and Choi43 In this study, there was a significant increase in GPx and CAT activities in adult female pups from diabetic rats, suggesting a defense mechanism to overcome the state of oxidative stress after the production of hydrogen peroxide (H2O2) through the enzymatic action of SOD, reducing H2O2 levels. In contrast, our results showed that hepatic TBARS levels were elevated, indicating that the livers of female pups from diabetic dams were vulnerable to lipid peroxidation when challenged by the addition of the HFD. Thus, we highlight that despite the activation of antioxidant agents, characterized by increased SOD and CAT activities and the consumption of GPx, levels of the lipid peroxidation marker (TBARS) remained high, indicating a condition of oxidative stress. The accumulation of ROS and peroxidized lipids creates an adverse environment, which promotes inflammation in liver tissue. Reference Michalopoulos and Bhushan40 Our study demonstrated that HFD supplementation promoted an imbalance of pro-inflammatory/anti-inflammatory markers in favor of a pro-inflammatory response. Possibly, the caloric excess induced by HFD triggered the activation of the NF-κB pathway (hepatocytes or Kupffer cells or both), resulting in an increased expression of pro-inflammatory cytokines TNF-α and IL-6, which are also related to resistance insulin Reference Zeng, Liu, Zhou, Pan, Xia and Chen44 and hepatocyte proliferation. Reference Xu, Hua, Tautenhahn, Dirsch and Dahmen45 We also observed an increase in IL-10 in the FD/HFD groups. IL-10 has anti-inflammatory abilities but has also been associated with the healing of tissues damaged by inflammation. Reference Ouyang, Rutz, Crellin, Valdez and Hymowitz46
Thus, exposure to an HFD caused glucose intolerance, liver inflammation, and an increase in the number of hepatocytes, while exposure to maternal diabetes promoted glucose intolerance, insulin resistance, hyperlipidemia, an increase in the number of hepatocytes, and activity of hepatic antioxidant enzymes in adult female pups. Furthermore, adult female rats exposed to both issues (maternal diabetes and HFD) showed pathophysiological features typical of the development of MALFD, such as hyperglycemia, insulin resistance, hyperlipidemia, hepatic steatosis, oxidative stress, and inflammation. Reference Eslam, Newsome and Sarin8,Reference Yu, Zhang and Lu47 Considering that lipophagy (a type of macroautophagy) has an important function in the degradation of intracellular lipid droplets and the prevention of MALFD, Reference Singh, Kaushik and Wang48,Reference Martinez-Lopez and Singh49 we propose that lipid changes are also associated with the dysregulation of hepatic autophagy, and we investigated changes in autophagy-related proteins. We suggest that hepatic autophagy in the female pups from diabetic rats was stimulated in an attempt to protect the organ against damage caused by hyperglycemia and avoid lipid accumulation, as evidenced in this research by the increased protein expression of p-AMPK. Metabolic stress results in a decline in the ATP:ADP ratio, with a subsequent increase in adenosine monophosphate (AMP) concentrations, Reference Maiuri, Zalckvar, Kimchi and Kroemer50 which stimulates AMPK activity to promote catabolic pathways with the activation of autophagy and the oxidation of fatty acids. Reference Alers, Löffler, Wesselborg and Stork51 During the autophagic process, the LC3-I form is conjugated with phosphatidylethanolamine and converted into LC3-II, allowing for the elongation, closure, and formation of the autophagosome. Reference Arden11,Reference Xu, Hua, Tautenhahn, Dirsch and Dahmen45 The difference in LC3 levels between the two conditions (LC3 I and LC3 II) is an indicator of autophagic flux, Reference Klionsky, Abdel-Aziz and Abdelfatah53 and another complementary method for assessing flux is the quantification of the p62/SQSTM1 protein, which is involved in the transport of ubiquitinated proteins destined for autophagic digestion and is highly degraded within the autolysosome. Reference Petrović, Bogojević and Korać52,Reference Klionsky, Abdel-Aziz and Abdelfatah53 Therefore, it is likely that the increased levels of the LC3-II/LC3-I ratio and the accumulation of p62/SQSTM1 observed in the female pups from diabetic rats are attributed to the accumulation of formed autophagosomes and the blockage of autophagic degradation. Our results corroborate another study that found an increase in the ratio of LC3-II/LC3-I and p62/SQSTM1 in the fetal pancreases and placentas of women with gestational DM. Reference Avagliano, Massa and Terraneo54
In contrast, our data showed that HFD exposure reduced hepatic autophagy. mTOR is a nutrient-excess sensing pathway that negatively regulates autophagy. Reference Klionsky, Abdel-Aziz and Abdelfatah53 Our findings added to this by demonstrating that this protein was activated by HFD. We also observed that, regardless of the influence of maternal hyperglycemia, ATG-7 was higher in females exposed to HFD. The female pups from diabetic rats that received HFD after birth showed an accumulation of lipid droplets in the liver, indicative of decreased autophagy, which was confirmed by lower AMPK phosphorylation and a decreased conversion of LC3-І to LC3-II. Evidence demonstrates that rodents that received HFD for a short period of time have a marked increase in hepatic autophagy due to an adaptive mechanism to reduce fat overload, while there are signs of suppression in autophagy in rodents that receive a long-term HFD, Reference da Cruz, Vesentini, Sinzato, Villaverde, Volpato and Damasceno14 with chronic elevation of Acetyl-CoA being one of the mechanisms responsible for autophagic suppression. Reference Mariño, Pietrocola and Eisenberg55 Furthermore, our results are consistent with previous findings indicating a reduced autophagic response in human MAFLD Reference Czaja56 and a mouse model. Reference Tanaka, Hikita and Tatsumi57
When we analyzed LAMP-2, an essential protein present in the lysosomal membrane that is responsible for the fusion step of autophagosomes with lysosomes, Reference Zhang, Liu and Hu58 we observed that both females from the diabetic environment and those fed with HFD in postnatal life showed a decrease in protein expression, demonstrating a reduced capacity for the fusion of autophagosomes and lysosomes. These findings corroborate studies that found that exposure to diets with a high concentration of lipids and the diversity of degrees of saturation of fatty acids (saturated, mono-, and polyunsaturated) can affect the physicochemical properties of lipid bilayers, Reference Hoefel, Hansen and Rosa59 decreasing the fusion capacity between autophagosomes and lysosomes. Reference Klionsky, Abdel-Aziz and Abdelfatah53 Therefore, the lipid composition of lysosomal membranes is relevant for investigation in experimental models.
Our research showed an incorrect autophagic process confirmed by the accumulation of lipofuscin. Lipofuscin is a cross-linked intracellular polymer, consisting of insoluble proteins and lipids, formed mainly by exposure to oxidative damage to macromolecules, Reference Xu, Hua, Tautenhahn, Dirsch and Dahmen45,Reference Jung, Höhn and Grune60 which accumulates in the lysosomes of most cells, including hepatocytes. Reference Klionsky, Abdel-Aziz and Abdelfatah53 However, lysosomal enzymes (acid hydrolases) are not effective in degrading lipofuscin. Consequently, there is a decline in the lysosomal capacity to disrupt intracellular macromolecules and an unbalanced distribution of enzyme availability in healthy lysosomes not loaded with lipofuscin, Reference Xu, Hua, Tautenhahn, Dirsch and Dahmen45 reflecting incomplete and unsuccessful autophagy. Reference Klionsky, Abdel-Aziz and Abdelfatah53 The accumulation of lipofuscin leads to a reduction in the turnover of damaged mitochondria, which results in increased ROS and causes additional impairment of the autophagy process by decreasing lysosomal function. Reference Xu, Hua, Tautenhahn, Dirsch and Dahmen45 Thus, if autophagic flux is blocked due to loss of fusion between autophagosomes and lysosomes, and/or increased ROS, this impairment in autophagy could contribute to cell death. Reference Arden11,Reference Maiuri, Zalckvar, Kimchi and Kroemer50,Reference Ajoolabady, Aslkhodapasandhokmabad and Libby61
We suggest that apoptotic (mitochondrial) pathways were activated due to autophagic impairment in adult females of diabetic dams, as demonstrated by a decreased expression of BCL-2. In the absence of BCL-2, pro-apoptotic proteins can release apoptogenic factors, such as cytochrome c, into the cytosol and promote caspase activation. Reference Mahdavi, Khodarahmi and Roodbari62 Furthermore, we found an increase in the BAX/BCL-2 ratio, indicating that the pro-apoptotic pathway was accelerated in the liver after feeding an HFD. In summary, our results indicate that impaired hepatic autophagy can lead to cell death due to intense oxidative reactions caused by the accumulation of lipids, damaged organelles, and/or malformed proteins. Reference Petrović, Bogojević and Korać52
Our findings provide deeper insights into the relationship of autophagy in fetal programming caused by diabetes (Fig. 9). Furthermore, our findings showed that female offspring of diabetic rats exposed to dietary supplementation with 30% kcal from fat after birth exhibited hyperglycemia and MAFLD, which suggests potential translational implications for human pathology. Furthermore, we point to autophagy as an important target for studies involving therapeutic drugs or physical exercise in the treatment of liver complications related to diabetes. It is worth noting that there are some limitations and perspectives to be pointed out, which are as follows: the absence of picrosirius red staining for evaluating collagen deposits and analyzing fibrosis development in the livers; LC3-II/LC3-I conversion has not been studied in the presence of lysosomal inhibitors (such as chloroquine), which could provide more details about the autophagic process; the analysis of the ultrastructure of autophagosomes by electron microscopy would have further reinforced the findings presented in this study; determining whether these alterations show sex specificity provides another topic to study in future research.
Illustrative summary of the main results found in female pups from diabetic rats, fed or not with a high-fat diet from weaning to adulthood (120 days of life).

In conclusion, fetal programming caused by maternal hyperglycemia is decisive for inducing diabetes, insulin resistance, hyperlipidemia, and deregulated hepatic autophagy in female pups in adulthood, regardless of the type of diet, which causes cell death. In addition, both issues (maternal hyperglycemia and postnatal inadequate diet) cause the impairment of cellular autophagy, contributing to metabolic dysfunction-associated fatty liver disease, with the presence of lipid accumulation, oxidative stress, and inflammation. Our findings are extremely important since the prevalence of diabetes is growing due to current lifestyle choices, such as a sedentary lifestyle and high caloric intake. Thus, the regulation of autophagy is an important therapeutic target for diabetes and its liver complications. In this way, preventing and treating the mother’s diabetes will prevent the transmission of diabetes to future generations.
Supplementary material
The supplementary material for this article can be found at https://doi.org/10.1017/S204017442400045X.
Acknowledgments
The authors are thankful to Mr. Danilo Chaguri and Mr. Jurandir Antonio for laboratory assistance and animal care.
Author contribution
LLC and DCD designed the study. LLC, YKS, VGP, MNF, FQG, VSB, and ACLC collected the data. LLC, JEC, and DCD analyzed the data. LLC, LAJ, TR, GTV, and DCD interpreted the results. LLC, TR, GTV, and DCD drafted the work and performed the final revision of the intellectual content. All authors were responsible for critical revisions of the paper. All authors approved the final version of the manuscript.
Financial support
This work was supported by the São Paulo Research Foundation (FAPESP) (D.C.D., grant number 2016/25207-5) and the Coordenação de Aperfeiçoamento de Pessoal de Nível Superior (CAPES/Brazil) (L.L.C., Finance Code 001).
Competing interests
None.
Ethical standard
The authors assert that all procedures contributing to this work comply with the ethical standards of the relevant National Institutes of Health Guide for the Care and Use of Laboratory Animals, the ARRIVE guidelines, and were approved by the Ethical Committee for Animal Research of the UNESP (CEUA Number: 1341/2019).