Introduction
A focused ion beam (FIB) system coupled with a scanning electron microscope (SEM) on the same platform, often referred to as an FIB-SEM microscope, is a powerful combination for three-dimensional (3D) microstructural analysis. The FIB is used serially to remove layers of material, while the electron beam is used to illuminate the freshly exposed surface. While early FIB-SEM imaging yielded 3D data stacks from measured electron signals (secondary electrons or backscattered electrons), more recent developments have integrated diffraction and x-ray spectroscopy with 3D FIB-SEM imaging. This article briefly reviews recent developments in acquisition and analysis of 3D FIB-SEM electron backscatter diffraction (EBSD) and x-ray microanalysis. A related review was recently published by Holzer and Cantoni, Reference Holzer and Cantoni1 and the interested reader is directed there for more details on imaging and microanalytical developments.
Three-dimensional orientation mapping
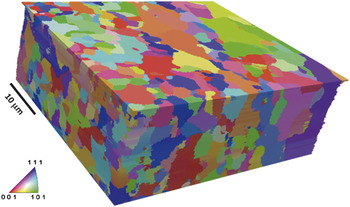
Automated EBSD, which makes it possible to accumulate a map of crystal orientations on a surface, has had a transformative effect on the study of grain boundaries in polycrystals. It is currently possible to measure several hundred orientations per second, enabling the determination of the shapes and orientations of thousands of grains in a reasonable amount of time. However, EBSD reveals information only on near-surface crystallography. Three-dimensional details extending beneath the surface requires serial sectioning (sequentially removing layers of material). Reference Rowenhorst, Lewis and Spanos2,Reference Saylor, Morawiec and Rohrer3 The experimental solution for serial sectioning has been made possible by dual beam microscopes that contain both an electron beam for EBSD mapping and an FIB for milling away layers of material. Efforts to fully automate the sequence of orientation mapping and FIB milling have obviated user intervention in the imaging cycle, enabling the collection of large 3D orientation maps of materials from which statistical information can be derived. Reference Beladi and Rohrer4–Reference Rohrer, Li, Lee, Rollett, Groeber and Uchic10 For example, a 3D orientation map of a ferritic steel is shown in Figure 1 .
Reconstructed serial sections of electron backscatter diffraction data for a ferritic steel. The volume consists of 68 parallel layers. The colors are the orientations referred to as the normal direction. Reference Beladi and Rohrer4

Three-dimensional orientation maps, compared to 2D images, occupy large banks of memory and are time consuming to measure. A typical 3D map will take several days to measure, where the time demand scales with the field of view and the number of parallel sections examined. In a conventional FIB-SEM microscope, orientation mapping and milling require comparable amounts of time. To balance the cost of the instrument time with the desire to collect as much useful information as possible, it is important to consider the choices for the spacing of the orientation points both within planes and between planes. It has been found that the spacing between planes should be no greater than 1/10th of the mean grain size, and the spacing of orientation points in the plane should be equal to or less than the spacing between planes. Reference Rohrer, Li, Lee, Rollett, Groeber and Uchic10
Data processing is very important for the accurate calculation of microstructural quantities. There are commercially available software solutions, such as Avizo, 11 but they tend to emphasize structure rather than orientation and images rather than statistics. For the processing of 3D orientation maps, one capable platform is Dream.3D, developed by Groeber and Jackson. Reference Groeber and Jackson12 Dream.3D uses another open source software package, ParaView, Reference ParaView13 for interactive visualization. As an example, the image in Figure 1 was created in Dream.3D and displayed using ParaView.
One of the most statistically valuable methods to describe the microstructure of a polycrystalline material is the grain boundary character distribution (GBCD), which can be derived only from 3D orientation maps. Reference Rohrer14,Reference Rohrer, Saylor, El Dasher, Adams, Rollett and Wynblatt15 The grain boundary character is specified by five parameters. For each pair of neighboring grains, the misorientation between the two grains (given by misorientation axis and a misorientation angle, which is a rotational around the misorientation axis) and the orientation of planar interface between the two grains (specified by a unit vector normal to the boundary [two angles]) are recorded. It must be noted that the computation of grain boundary character is highly sensitive to the alignment of sequential 2D orientation maps; a poor alignment would give errant grain boundary positions, thereby giving incorrect boundary plane orientations.
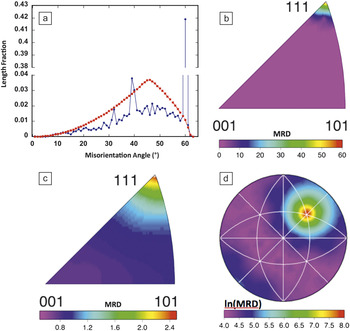
The results in Figure 2 show different components of GBCD data obtained by 3D serial sectioning in the FIB. This particular distribution is for high purity Ni. Reference Li, Dillon and Rohrer9 Note that these data and many others can be found at the Grain Boundary Data Archive, an online repository. Reference Rohrer16 The distribution of grain boundary misorientation angles is shown in Figure 2a. The peak at 60° corresponds to the Σ3 misorientation; this is a grain boundary with a lattice misorientation of 60° around the [111] axis. The peak at 39° corresponds to the Σ9 boundary; this is a grain boundary with a 39° misorientation around the [110] axis. The distribution of misorientation axes for grain boundaries with a 60° misorientation angle is shown in Figure 2b. The distribution of grain boundary planes is presented in Figure 2c and shows a preference for (111) planes. The strong peak at [111] demonstrates that these are Σ3 boundaries, which have a misorientation of 60° about [111]. Finally, the distribution of grain boundary planes at the Σ3 misorientation is shown in Figure 2d. The maximum is at the (111) position, and this corresponds to the coherent twin grain boundary.
Representations of the grain boundary character distribution for pure Ni. Reference Li, Dillon and Rohrer9 (a) Misorientation angle distribution is shown with blue dots. The red squares show a random distribution for comparison. Note the break in the vertical axis. (b) The distribution of misorientation axes for all grain boundaries with a 60° misorientation. (c) The distribution of grain boundary planes, ignoring misorientation, in the crystal reference frame. (d) The distribution of grain boundary planes for all boundaries with a misorientation of 60° around [111]. (b–d) are stereographic projections, and the units are multiples of a random distribution (MRD).

One valuable application of the 3D data is as input to numerical simulations of properties. Reference Lee, Key, Liang, García, Wang, Tricoche, Rohrer, Saito, Ito and Tani17 Material properties can be simulated based on models that are ensembles of microstructure statistics, but there is no substitute for building a model directly from the empirically observed microstructure. As an example of numerical modeling of a polycrystal, the 3D orientation map on a regular grid can be used as input into simulations of mechanical response using the fast Fourier transform method to determine the plastic response of a material to mechanical loads. Reference Rollett, Lebensohn, Groeber, Choi, Li and Rohrer18 This method has been used to identify microstructural “hot spots” or stress concentrations in Ni microstructures.
Applications such as Dream.3D and Avizo can be used to create meshed models of microstructures that can then be exported in formats that are accepted by standard finite element model simulations. Ghosh and coworkers have outlined the challenges for constructing a simulation-ready mesh specifically from 3D orientation maps. Reference Ghosh, Bhandari and Groeber19
Numerical modeling can be computationally demanding. Lewis and coworkers describe shortcuts that can extend the scale of the system that can be studied. Reference Lewis, Qidwai, Jackson and Geltmacher20 Usually, these shortcuts involve reducing the complexity of the model by, for example, using adaptive mesh refinement methods or simply reducing the model domain down to a representative volume. As evolving imaging methods deliver larger 3D volumes at higher resolutions, image-derived modeling will continue to demand greater computing resources.
Three-dimensional x-ray microanalysis
Much like EBSD, conventional x-ray energy dispersive spectroscopy (XEDS) microanalysis interrogates only the surface of a sample. Quite often, however, a 2D chemical map is not sufficient to answer a scientific question, and, therefore, methods for 3D analysis are needed. The first 3D measurement using electron excited x-rays in a SEM was performed with mechanical sectioning followed by acquisition of pre-selected x-ray maps. Reference Marschallinger21
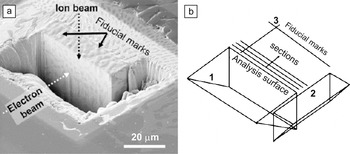
The first measurements of 3D elemental distributions with an FIB-SEM equipped with an x-ray detector were done without the benefit of automation, with the operator serially milling layers with the FIB and scanning those layers with the SEM as an x-ray detector was used to acquire full spectral images. Reference Kotula, Keenan and Michael22–Reference Kotula, Keenan and Michael24 The analytical geometry developed in that work is shown in Figure 3 for the example of the analysis of a copper silver eutectic alloy. Figure 3a is a secondary-electron image taken from the perspective of the x-ray detector showing the trenches milled to first expose the analysis surface to the electron beam, and second, a trench to the right that removes sample material that would otherwise obscure x-rays from reaching the detector. While this image shows some material-specific contrast, it is not definitive of the chemical phases in the sample. Figure 3b is a schematic of the analysis geometry. These data were acquired manually in about one day’s time and consisted of 10 serial sections, each with a full spectrum at every pixel. The technique of 3D XEDS was successfully automated using a combination of the FIB manufacturer’s scripting and custom scripting software to control the XEDS software, Reference Schaffer, Wagner, Schaffer, Schmied and Mulders25 and commercial integration of FIB-SEM and XEDS has been available since 2011. 26
(a) Secondary-electron image showing the trenches, protective Pt layer, and fiducial (reference) markers for a copper silver eutectic alloy taken to approximate the view of the analysis surface seen by the x-ray spectrometer. (b) Schematic of the analysis geometry with (1) first stair-step trench, (2) second stair-step trench, and (3) fiducial markers. Reprinted with permission from Reference 24. © 2006 Cambridge University Press.

Performing microanalysis in a trench is far from ideal, as both backscattered electrons and x-rays can excite x-rays from areas far from the analysis surface. This has been overcome by using a micromanipulator in the FIB to remove a volume of material and place it on a support. Reference Schaffer and Wagner27 Although this method takes longer, the resulting volume of material removed from the trench can then be sectioned and analyzed without the spurious background signal. In many cases though, an analyzed geometry with a trench is both faster and easier while allowing for the most common qualitative analyses.
Ultimately though, what limits the microanalytical spatial resolution is not the surrounding material (the trench for example) or the slice thickness. Rather, it is the energy of the incident electrons on the analysis face and the average atomic number of the target material. The incident electron beam generates x-rays from a volume of material, thus making this technique near-surface sensitive. With an electron-energy of 15 keV, the interaction volume for the generation of x-rays for an aluminum target would be about 3 µm, for titanium it would be about 2 µm, and for copper it would be about 1 µm. For platinum, however, it would be about 100 nm. We can improve this, especially for low atomic number targets, by decreasing the incident electron voltage, but at the expense of efficiently exciting only lower energy x-ray transitions. The resulting emission bands tend to overlap with each other for many elements. At very low energy though, we come to the limit of current XEDS systems where excited transitions are not detectable by the current x-ray detectors. As a rule of thumb, an electron beam voltage of two times the ionization energy for a transition of a target material is desirable.
A 3D x-ray spectral image (termed tomographic spectral image) Reference Kotula, Keenan and Michael24 contains a full x-ray spectrum in each voxel in a 3D array. A significant challenge then is how to comprehensively analyze what can consist of billions of data elements (number of voxels times number of x-ray energy channels) without a priori knowledge of the material composition. Multivariate statistical analysis (MSA) is key to interpreting these high-dimensional data; by reducing the large number of initial variables (typically the spectral channels) into a smaller number of more discriminating variables, MSA yields physically interpretable factors. Reference Kotula, Keenan and Michael24,Reference Kotula, Keenan and Michael28,Reference Kotula, Van Benthem and Sorensen29 The factors consist of corresponding component images and spectral shapes.
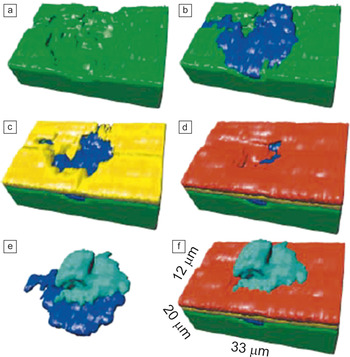
As an example of the use of lower accelerating voltages to improve the spatial resolution of 3D XEDS, 5 keV was used to analyze a localized corrosion event Reference Kotula, Keenan and Michael22–Reference Kotula, Keenan and Michael24 on a gold and nickel plated copper specimen where the initial elements of interest were gold (Au-M 2.123 keV), nickel (Ni-Lα 0.852 keV), and copper (Cu-Lα 0.930 keV), plus corrosion products likely including sulfur (S-K 2.308 keV). Unexpectedly, in this case, Si and O were found using advanced data analysis methods. Reference Kotula, Keenan and Michael24 Rather than choosing elements in advance for data collection, the full spectral image data were collected for retrospective analysis. Figure 4a–f shows the component images from the MSA analysis of the tomographic spectral image rendered in 3D where Au is red, Cu is green, Si-O is blue, Cu-S is cyan, and Ni is yellow. Reference Kotula, Keenan and Michael24 The Si-O contaminant on the Cu substrate came from a grit-blasting process step intended to roughen the substrate to improve adhesion of the electrodeposited Ni and Au layers with the Au in particular used to prevent corrosion. The presence of the Si-O created a defect in the Ni plating, which the Au only partially covered, leaving a path for corrosion to occur.
(a–f) Selected views of the multivariate statistical analysis-derived 3D component images corresponding to the different chemical phases found. Red is Au, green is Cu, blue is Si-O, cyan is Cu-S, and yellow is Ni. Reprinted with permission from Reference 24. © 2006 Cambridge University Press.

In conventional processing, maps corresponding to expected elements are visualized with 3D rendering software. One challenge though is the fact that with low incident beam energies, many x-ray lines from different elements overlap (e.g., Fe-L and F-K), which is referred to as pathological overlap. If we acquire the full spectral data at each 3D volume element (voxel) though (the standard approach now), we can apply more advanced data processing methods that require no a priori knowledge of the elements that may be present, Reference Kotula, Keenan and Michael28 and can thus effectively be deconvolved for many such pathological overlaps.
Three-dimensional elemental maps can be used as models for numerical simulations, but there are no unique requirements as there are with 3D orientation maps. Whereas conventional FIB-SEM electron imaging experiments must be segmented (identifying what grayscale values correspond to what elements), a clean 3D elemental map requires no segmentation. Generally preferable to conventional FIB-SEM electron images, XEDS maps definitively measure the chemistry at every position in the 3D model. But in some cases, this may not be strictly necessary. Iwai and coworkers Reference Iwai, Shikazonob, Matsuic, Teshimab, Kishimotoa, Kishidac, Hayashia, Matsuzakib, Kannob, Saitoa, Muroyamac, Eguchic, Kasagib and Yoshida30 have shown that the secondary electron (SE) contrast is sufficient to differentiate the materials in every slice of a 3D data set of a solid oxide fuel cell anode. An XEDS map of a single representative slice is sufficient to calibrate the grayscale interpretation for all of the slices in the 3D SE map. Their 3D model was then subjected to lattice Boltzmann simulation of ionic diffusion in the measured microstructure. Reference Iwai, Shikazonob, Matsuic, Teshimab, Kishimotoa, Kishidac, Hayashia, Matsuzakib, Kannob, Saitoa, Muroyamac, Eguchic, Kasagib and Yoshida30 Despite the success of this study, grayscale resolution in the SE signal is far less characteristic than chemical mapping by XEDS. Alternatively, it is possible to collect electron images from finely spaced slices and then collect x-ray spectral images from larger depth intervals (e.g., every fifth or tenth slice). 26 In this way, data acquisition can be optimized for post-processing at the best spatial resolution of the respective techniques.
Remaining challenges and future developments
The scale of these 3D microstructural analyses studies is limited by the milling rate. Since the liquid-metal ion source in Ga FIB columns is physically very small, it is difficult to obtain a large Ga beam current commensurate with the relatively large serial section thicknesses useful for 3D microanalysis and thus larger volume removal. Recent developments in gaseous plasma sources Reference Smith, Skoczylas, Kellogg, Kinion, Tesch, Sutherland, Aanesland and Boswell31 have raised the possibility of a plasma FIB-SEM. The volumes of material that could then be analyzed would increase significantly so that operators could realistically perform serial sectioning experiments at depths on the order of 500 μm.
Large datasets can be computationally taxing. Data interpretation and microstructural characterization is possible with current hardware, but many desirable simulations are not tractable. This will be addressed only when numerical simulation engines are more highly optimized or when more computational power is applied to the problems.
Future advances in 3D XEDS microanalysis will involve the use of higher solid angle silicon-drift energy-dispersive x-ray detectors (SDDs) to shorten the time required to collect the x-ray data. Free from liquid nitrogen cooling, these SDDs can be fashioned into custom geometries that can be positioned closer to the specimen or subtend larger solid angles. Reference Doyle, Walsh, Kotula, Rossi, Schulein and Rohde32,Reference Kotula, Michael and Rohde33
Summary
Until recently, 3D microanalysis experiments were possible only by labor-intensive manual approaches, and often there was no user-friendly software for data interpretation. Advances in FIB-SEM instrument control software have greatly simplified data collection for both 3D orientation maps and 3D elemental mapping experiments for a variety of application areas. Third party and vendor software for 3D orientation mapping interpretation have made it possible to thoroughly characterize crystallographic microstructures and even numerically simulate physical properties of polycrystalline materials such as ceramics Reference Lee, Key, Liang, García, Wang, Tricoche, Rohrer, Saito, Ito and Tani17 and minerals. Reference Shushakova, Fuller, Heidelbach, Mainprice and Siegesmund34 Three-dimensional chemical mapping reveals the makeup of samples of materials sciences Reference Kotula, Keenan and Michael24,Reference Schaffer, Wagner, Schaffer, Schmied and Mulders25,Reference Holbrook, Davis, Scott and Szakal35 and life-science specimens; Reference Scott and Ritchie36 the former has benefited strongly from MSA techniques for dealing with high-dimensional spectral data. The scale of specimens studied with these techniques is likely to grow, especially when FIB milling rates are accelerated by new technologies.
Acknowledgments
Sandia is a multiprogram laboratory operated by Sandia Corporation, a Lockheed Martin Company, for the United States Department of Energy (DOE) under contract DE-AC0494AL85000. P. K. acknowledges Michael Rye at Sandia for helping with manual serial sectioning and 3D XEDS acquisition. G.S.R. acknowledges financial support from the ONR-MURI under Grant No. N00014–11–1-0678 and the MRSEC program of the National Science Foundation under Award DMR-0520425.