Introduction
Recent large-scale losses in honey bee (Apis mellifera Linnaeus; Hymenoptera: Apidae) colonies in Canada, the United States of America, Europe, and other temperate regions have greatly affected apiculture and the pollination industry (Underwood and vanEngelsdorp Reference Underwood and vanEngelsdorp2007; vanEngelsdorp et al. Reference VanEngelsdorp, Underwood, Caron and Hayes2007; Aizen and Harder Reference Aizen and Harder2009; Currie et al. Reference Currie, Pernal and Guzman-Novoa2010; Neumann and Carreck Reference Neumann and Carreck2010; Potts et al. Reference Potts, Biesmeijer, Kremen, Neumann, Schweiger and Kunin2010; vanEngelsdorp and Meixner Reference VanEngelsdorp and Meixner2010). In Canada, average colony losses increased from a historical average of 5–15% to over 36% in recent years with some commercial beekeepers losing up to 90% of their hives (Currie et al. Reference Currie, Pernal and Guzman-Novoa2010). These impacts are of considerable economic importance because the value of crops pollinated by honey bees is estimated to be up to CAD$2 billion annually in Canada (Canada Honey Council 2012) and US$212 billion on a global basis (Gallai et al. Reference Gallai, Salles, Settele and Vaissière2009).
Varroa destructor Anderson and Trueman (Acari: Varroidae) is often associated directly or indirectly with these colony losses and has become more problematic because V. destructor resistance to acaricides such as fluvalinate and coumaphos is widespread (Eischen Reference Eischen1995, Reference Elzen, Eischen, Baxter, Pettis, Elzen and Wilson1998, Reference Elzen, Baxter, Spivak and Wilson1999; Currie et al. Reference Currie, Pernal and Guzman-Novoa2010). Among the other stresses affecting colony loss, bee viruses are thought to be one of the major threats, and their transmission through V. destructor has caused serious problems in the beekeeping industry (vanEngelsdorp et al. Reference VanEngelsdorp, Hayes, Underwood and Pettis2008, Reference VanEngelsdorp, Evans, Saegerman, Mullin, Haubruge and Nguyen2009; Highfield et al. Reference Highfield, El Nagar, Mackinder, Noel, Hall and Martin2009; Currie et al. Reference Currie, Pernal and Guzman-Novoa2010; Genersch et al. Reference Genersch, von der Ohe, Kaatz, Schroeder, Otten and Buchler2010; Guzman-Novoa et al. Reference Guzman-Novoa, Eccles, Calvete, McGowan, Kelly and Correa-Benitez2010). More than 20 different bee viruses have been detected in honey bees (Allen and Ball Reference Allen and Ball1996; Ball and Bailey Reference Ball and Bailey1997; Evans and Schwarz Reference Evans and Schwarz2011). Multiple virus infections have been reported in individual bees as well as in bee colonies (Chen et al. Reference Chen, Zhao, Hammond, Hsu, Evans and Feldlaufer2004b; Tentcheva et al. Reference Tentcheva, Gauthier, Zappulla, Dainat, Cousserans and Colin2004; Berényi et al. Reference Berényi, Bakonyi, Derakhshifar, Koglberger and Nowotny2006). The viruses most often thought responsible for severe disease outbreaks are distributed worldwide and include deformed wing virus deformed wing virus (DWV) and sacbrood virus (SBV) (family Iflaviridae); black queen cell virus (BQCV), Israeli acute paralysis virus (IAPV), Kashmir bee virus (KBV), and acute bee paralysis virus (ABPV) (family Dicistroviridae); and chronic bee paralysis virus (CBPV) (unclassified) (Chen and Siede Reference Chen and Siede2007). Viral infections are found in all developmental stages of honey bees. Bee viruses can cause inapparent (i.e., lack of obvious morphological and behavioural symptoms) infections in bees that have low concentrations of virus but we have little understanding of what baseline level is in asymptomatic bees from healthy colonies.
Virus prevalence varies between regions throughout the world. Deformed wing virus is one of the most prevalent and is widely distributed, usually being found wherever honey bees are present (Martin et al. Reference Martin, Highfield, Brettell, Villalobos, Budge and Powell2012). Deformed wing virus is closely associated with the mite V. destructor (Ball and Allen Reference Ball and Allen1988; Martin Reference Martin2001; Highfield et al. Reference Highfield, El Nagar, Mackinder, Noel, Hall and Martin2009), causes visible deformities in severely infected adult bees and is associated with high levels of winter loss of bee colonies (Highfield et al. Reference Highfield, El Nagar, Mackinder, Noel, Hall and Martin2009; Williams et al. Reference Williams, Rogers, Kalkstein, Taylor, Shutler and Ostiguy2009; de Miranda and Genersch Reference De Miranda and Genersch2010). Black queen cell virus is also common in adult bees throughout the world, and has been implicated as a cause of increased colony loss when found in combination with the microsporidian Nosema apis Zander (Dissociodihaplophasida: Nosematidae) (Chen and Siede Reference Chen and Siede2007). Israeli acute paralysis virus, KBV, and ABPV are closely related to each other, forming a complex group within the family Dicistroviridae (de Miranda et al. Reference De Miranda, Cordoni and Budge2010). Recently, IAPV received much attention globally, as it has been linked to colony collapse disorder (CCD) in honey bees (Cox-Foster et al. Reference Cox-Foster, Conlan, Holmes, Palacios, Evans and Moran2007). Israeli acute paralysis virus causes bee paralysis and death of colonies, but its role as a specific cause of CCD is unclear (Maori et al. Reference Maori, Lavi, Mozes-Koch, Gantman, Peretz and Edelbaum2007). Kashmir bee virus occurs in Canada, the United States of America, Europe, and several other countries (Allen and Ball Reference Allen and Ball1996; Ellis and Munn Reference Ellis and Munn2005). There are no clearly defined morphological symptoms associated with KBV under field conditions (Bailey and Woods Reference Bailey and Woods1977; Allen and Ball Reference Allen and Ball1995). Kashmir bee virus is associated with V. destructor, (Shen et al. Reference Shen, Cui, Ostiguy and Cox-Foster2005a, Reference Shen, Yang, Cox-Foster and Cui2005b) and is associated with some varroa-induced colony losses (Todd et al. Reference Todd, De Miranda and Ball2007; Ribiere et al. Reference Ribiere, Ball and Aubert2008). Acute bee paralysis virus is globally distributed but less prevalent than some of the other viruses and levels of virus vary with season. Chronic bee paralysis virus-infected adults also show no morphological deformities, but exhibit paralysis similar to those infected with ABPV. Chronic bee paralysis virus occurs sporadically and occasionally is associated with collapse of colonies. Unlike ABPV, CBPV takes several days to kill bees (Bailey and Ball Reference Bailey and Ball1991).
The distribution and relative concentration of viruses within bee colonies in Canada is poorly understood. Of the viruses mentioned above, only three (KBV, DWV, and IAPV) have been previously reported in adult bees in Canada although SBV has been identified through morphological diagnosis in larvae (Allen and Ball Reference Allen and Ball1995; Berenyi et al. Reference Berényi, Bakonyi, Derakhshifar, Koglberger, Topolska and Ritter2007; Palacios et al. Reference Palacios, Hui, Quan, Kalkstein, Honkavuori and Bussetti2008) but the distribution and impact of these viruses is not known. Recently, beekeepers have observed increased occurrence of symptoms such as twitching bees, dark-coloured and deformed bees, abnormally low worker population size, increased winter colony losses, and collapse of entire colonies, but the types of virus involved and potential role that these might play in these events where other factors such as pesticide poisoning have been excluded, is unclear.
It is very difficult or impossible to differentiate and quantify virus infections through field symptoms but they can be diagnosed using reverse transcription polymerase chain reaction (RT-PCR) and quantitative polymerase chain reaction (qPCR) (Chen et al. Reference Chen, Higgins and Feldlaufer2005; Chantawannakul et al. Reference Chantawannakul, Ward, Boonham and Brown2006; Tentcheva et al. Reference Tentcheva, Gauthier, Bagny, Fievet, Dainat and Cousserans2006). The qPCR assay provides rapid, sensitive, specific, and quantitative viral diagnosis, and is especially good for detecting virus at low concentrations and allows quantitation of mixed infections.
The purpose of this study is to characterise the occurrence and frequency of seven single stranded honey bee RNA viruses (DWV, BQCV, SBV, IAPV, KBV, CBPV, and ABPV) in Canada by using conventional RT-PCR and to quantify the relative levels of DWV, BQCV, and IAPV from different geographical regions of Canada using qPCR. We investigated the distribution pattern of honey bee viruses in randomly collected samples of adult workers from healthy colonies and non-random samples from beekeeper-identified unhealthy colonies. Our goal was to better understand the distribution and relative concentration of these viruses in healthy and unhealthy colonies, to establish baseline data for the types and concentrations of viruses present in Canada and assess the potential value in using virus prevalence data from colonies that survive winter to help explain winter loss.
Materials and methods
Honey bee sampling
Samples of bees were collected from honey bee colonies from five beekeepers in each of eight provinces within Canada by provincial apiarists and collaborators and immediately sent to the University of Manitoba, Winnipeg, Manitoba, Canada. Samples of ~100 live bees at ambient temperature or dead bees in dry ice from each colony were shipped by overnight express mail. Bees from “healthy colonies” were obtained by collecting them from a total of 10 hives (representing two colonies from each of five beekeepers) in each province (n=80). We also collected a separate set of bee samples (n=23) from “unhealthy colonies” that had been identified by the provincial apiarist and local beekeepers within the province of Manitoba, Canada. Colonies identified as “unhealthy” either had a heavy infestation of V. destructor, had collapsed, had evidence of paralysed and dark-coloured bees, were unexpectedly low in population, or had combinations of these symptoms. All adult honey bee samples from healthy colonies were collected and submitted for analysis between September 2009 and December 2009 and for unhealthy colonies between April and June each year 2009 and 2010. Upon arrival at the University of Manitoba, all the samples were stored immediately in a −80 °C freezer until further analysis.
RNA isolation
A subset (n=10) of adult worker honey bees from each hive sample was selected, and the bees were pooled and crushed into a fine homogenous powder in a mortar cooled by liquid nitrogen. The RNA was extracted from 30 mg of ground honey bee material using an RNeasy Mini Kit (Qiagen, Valencia, California, United States of America) following manufacturer’s instructions. RNA samples were dissolved in diethylpyrocarbonate-treated water in the presence of ribonuclease inhibitor and stored for further analysis at −80 °C.
RT-PCR analysis
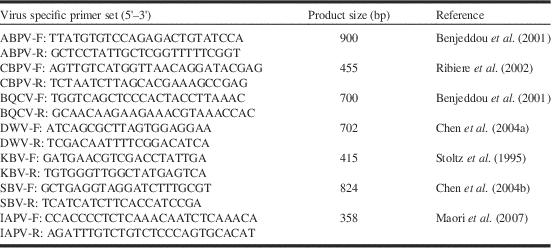
All the RNA samples were analysed for presence of seven bee viruses by RT-PCR. The PCR products were gel-extracted, ligated into pGEM-T easy plasmid vectors (Promega, Madison, Wisconsin, United States of America), and transformed into Escherichia coli (Migula) Castellani and Chalmers (Enterobacteriaceae) DH5α competent cells (Promega) according to the manufacturer’s protocol. The plasmid clones were then sequenced using DNA sequencing services (Macrogen Inc., Rockville, Maryland, United States of America) and compared using the National Center for Biotechnology Information BLAST programme. A BLAST search analysis confirmed that the seven cloned sequences resulted in a virus-specific product. The primers for the PCR are listed in Table 1.
PCR primers used in the study.

Note: PCR, polymerase chain reaction; ABPV, acute bee paralysis virus; CBPV, chronic bee paralysis virus; BQCV, black queen cell virus; DWV, deformed wing virus; KBV, Kashmir bee virus; SBV, sacbrood virus; IAPV, Israeli acute paralysis virus; bp, base pair.
qPCR analysis for DWV, BQCV, and IAPV
Virus quantification by qPCR was performed for the three most prevalent viruses (DWV, BQCV, and IAPV), in an ABI Prism 7300 real-time PCR machine system (Applied Biosystems, Foster City, California, United States of America). Negative controls (reaction mix without cDNA template) were included in triplicate, in all batches, to check for contamination in any of the reagents. The qPCR reactions were performed in triplicate and the relative virus gene expressions were calculated using the
 $${\rm 2}^{{{\minus}\Delta } {C_{\rm t} }} $$
method, where C
t indicates the cycle threshold. Relative expression
 $${\rm 2}^{{{{\minus}\Delta }} {{C_{{\rm t}} }} $$
was calculated; where ΔC
t=C
t(virus gene)−C
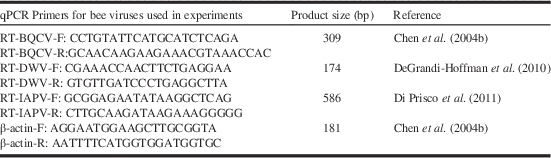
t(β-actin) (Persico et al. Reference Persico, Capasso, Persico, Svelto, Russo and Spano2007). Honey bee actin (DNA fragment) was used as an internal control gene to normalise qPCR experiments, since it is a stable gene and expressed in all honey bee cells. The primers for the qPCR are listed in Table 2.
qPCR primers used in the study.
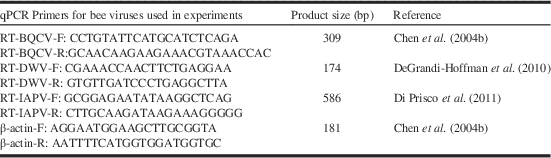
Note: bp, base pair.
Statistical analysis
The RT-PCR results were expressed as prevalence (the percentage of colonies with presence of virus) for DWV, BQCV, SBV, IAPV, KBV, CBPV, and ABPV. Percentage of colonies infected with different viruses in each province, and comparisons between unhealthy colonies from Manitoba with healthy colonies from across Canada (including from Manitoba) were examined by Fisher’s exact test (PROC FREQ; SAS 1999). The qPCR data were
 $${\rm log 2}^{{{\minus}}{{\Delta C_{{\rm t}} }}} {\plus}{\rm 1}$$
transformed before analyses to improve the equality of variance (Snedecor and Cochran Reference Snedecor and Cochran1980). In order to analyse the difference between virus levels of three most prevalent viruses (DWV, BQCV, and IAPV) in different provinces, a multivariate analysis (MANOVA) was first performed using PROC GLM (Carey Reference Carey2012). Univariate analysis (Welch’s ANOVA) was than performed for each virus to assess differences in virus levels between provinces (Welch Reference Welch1951). Means were separated by Tukey’s test with the significance level of 0.05. Relative virus levels of DWV, BQCV, and IAPV for pooled baseline values across all provinces for healthy colonies were compared with unhealthy colonies from Manitoba by orthogonal CONTRAST (SAS 1999).
Concentrations of DWV, BQCV, and IAPV from the same samples were analysed by PROC MIXED using a repeated measures design with hive as the experimental subject and virus as a repeated measure (SAS 1999). An unstructured covariance matrix was used. Where significant interactions were observed between virus and provinces (including unhealthy and healthy colonies) interactions were partitioned by province using a slice statement. For provinces where differences in virus levels were observed, differences among means within provinces were compared by Bonferroni corrected contrasts using P
diff (P<0.005). Partial correlation coefficients for two viruses (controlling for the third virus) were generated in PROC GLM (MANOVA) (SAS 1999). Virus concentration data were presented as mean
 $${\rm log 2}^{{{\minus}}{{\Delta C_{{\rm t}} }}} \,\pm\,{\rm standard\,error}$$
.
Results
Distribution pattern of seven bee viruses
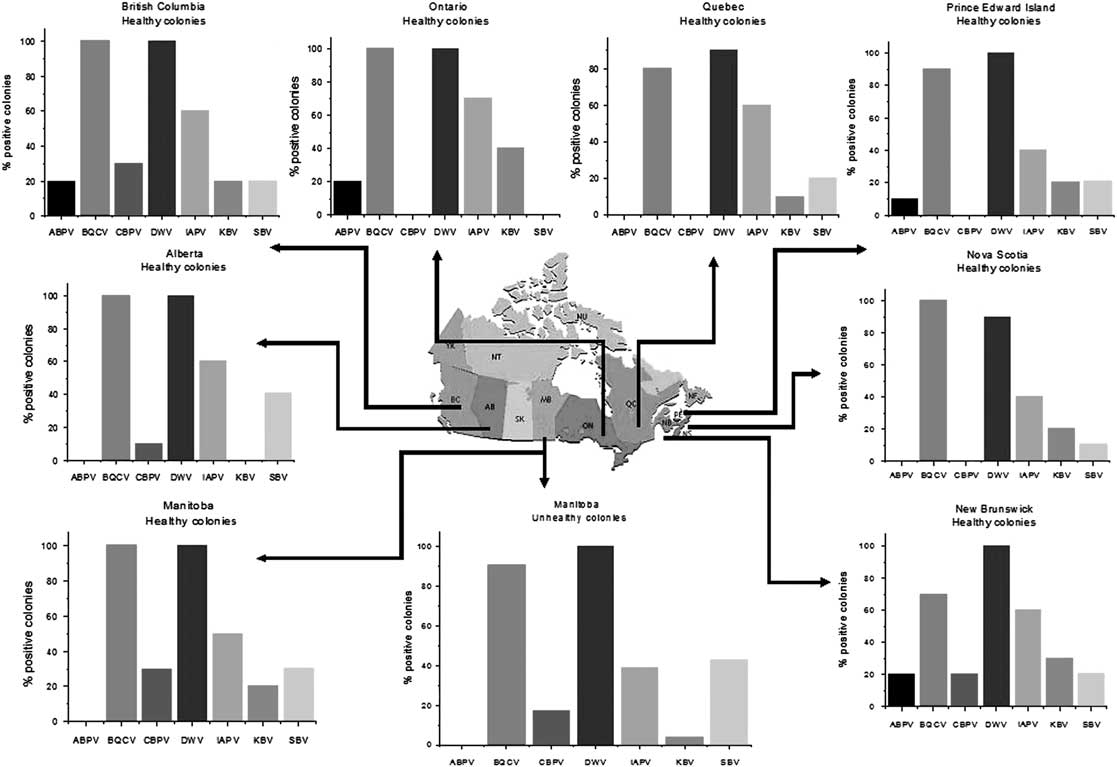
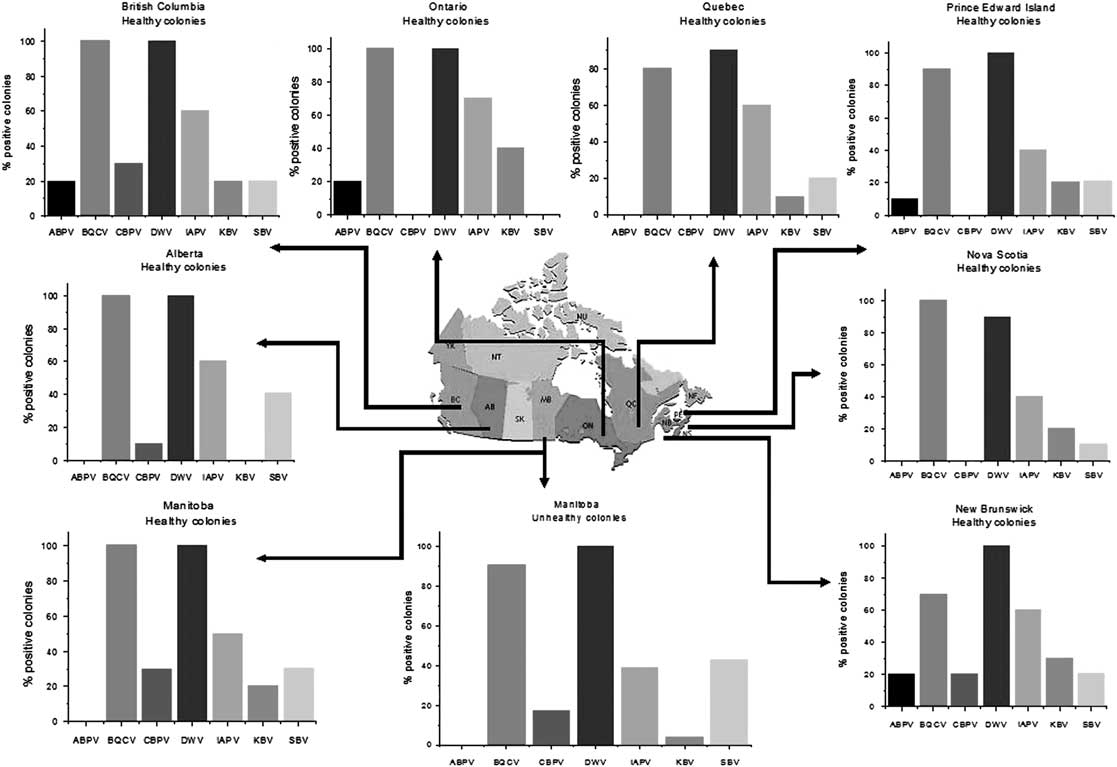
For each virus collected from the eight Canadian provinces, the percentage of colonies infected with the virus was similar across all provinces within all healthy colonies ABPV P=0.274; BQCV P=0.075; CBPV P=0.062; DWV P=1.0; IAPV P=0.09; KBV P=0.056; SBV P=0.56 (Fisher’s exact test) (see Fig. 1). Some of the viruses occurred more frequently than others (χ 2=153.95, df=6, P<0.0001): DWV was the most prevalent virus, found in 90–100% (n=10) of healthy colonies across all provinces and occurred at similar frequencies (100%, n=23) in “unhealthy” colonies from MB (χ 2=0.17, df=1, P=0.68) (Fig. 1). Black queen cell virus was also very common and had similar prevalence in healthy colonies across all provinces at 70–100% (n=10), and unhealthy colonies from Manitoba at 91% (n=23) (χ 2=0.04, df=1, P<0.85). Israeli acute paralysis virus was common but more variable in occurrence than BQCV and DWV and ranged from 40–70% occurrence in healthy colonies across all provinces (n=10) and was at a similar low rate (40%) in unhealthy colonies (χ 2=1.77, df=1, P=0.18). It is of interest to note that SBV occurrence was greater in unhealthy colonies from Manitoba at 44% (n=23) than in the healthy colonies across all provinces, which were much lower at 16% (n=80) (χ 2=5.21, P<0.02); however, SBV prevalence from healthy colonies within Manitoba was similar to healthy ones elsewhere in Canada (χ 2=1.89, df=1, P=0.17) (Fig. 1). Kashmir bee virus was also found at low levels of prevalence (10–40%) but was not detected in samples from Alberta. Acute bee paralysis virus and CBPV occurred at low frequencies (0–20% and 0–30%, respectively), but were not consistently detected in all provinces (Fig. 1). Kashmir bee virus (χ 2=2.59, df=1, P=0.11), ABPV (χ 2=0.29, df=1, P=0.59), and CBPV (χ 2=0.57, df=1, P=0.45) prevalence in healthy colonies across Canada did not differ from unhealthy colonies in Manitoba. There were no differences in prevalence of any viruses among unhealthy (n=23) and healthy colony (n=10) samples within Manitoba (ABPV P=1.0; BQCV P=1.0; CBPV P=0.65; DWV P=1.0; IAPV P=0.71; KBV P=0.21; SBV P=0.70 (Fisher’s exact test) (see Fig. 1).
Prevalence of seven bee viruses in healthy colonies in eight provinces of Canada (n=10 per province) and in unhealthy colonies from Manitoba (n=23).
Relative virus levels of DWV, BQCV, and IAPV
A quantitative analysis of viruses (qPCR) was performed to examine the difference in relative concentration of the three most common viruses we found in Canada (DWV, BQCV, and IAPV) (see above). Overall, virus levels differed among the different locations including both healthy colonies in different provinces and the unhealthy colony cohort from Manitoba) (MANOVA, Wilks’s λ=0.47, F=3.30, df=24, 267.43, P<0.0001) (Fig. 2). Deformed wing virus levels accounted for 61.11% of the variability in virus concentration followed by BQCV (27.24%) and IAPV (11.65%). Univariate ANOVAs showed DWV varied between provinces (Welch ANOVA, F(8, 32.52)=11.88, P=0.0001) but BQCV and IAPV levels did not (BQCV, Welch ANOVA, F(8, 35.31)=1.45, P=0.21), (IAPV, Welch ANOVA, F(8, 32.43)=2.14, P=0.06) (Fig. 2). The DWV concentration in British Columbia was much higher than in Manitoba, Québec, New Brunswick, and Nova Scotia, however, its level was similar to that found in Alberta, Ontario, and Prince Edward Island (Tukey’s test, P<0.05) (Fig. 2). Deformed wing virus concentrations in all provinces other than British Columbia were similar to each other.
Relative viral concentration of deformed wing virus (DWV), black queen cell virus (BQCV), and Israeli acute paralysis virus (IAPV) among samples collected from healthy colonies in eight provinces in Canada, and from unhealthy colonies from Manitoba. Data are presented as mean
 $${\rm log}_{{10}} {\rm 2}^{{{\minus}} {{\Delta C_{{\rm t}} }}}\pm\,{\rm standard\,error}$$
. Bars followed with the same letter within each virus are not significantly different (Tukey’s Studentised range test, P>0.05). Horizontal line represents contrast between unhealthy colonies in Manitoba and pooled values for all baseline healthy colonies. For differences between relative virus concentrations within each province, see text.
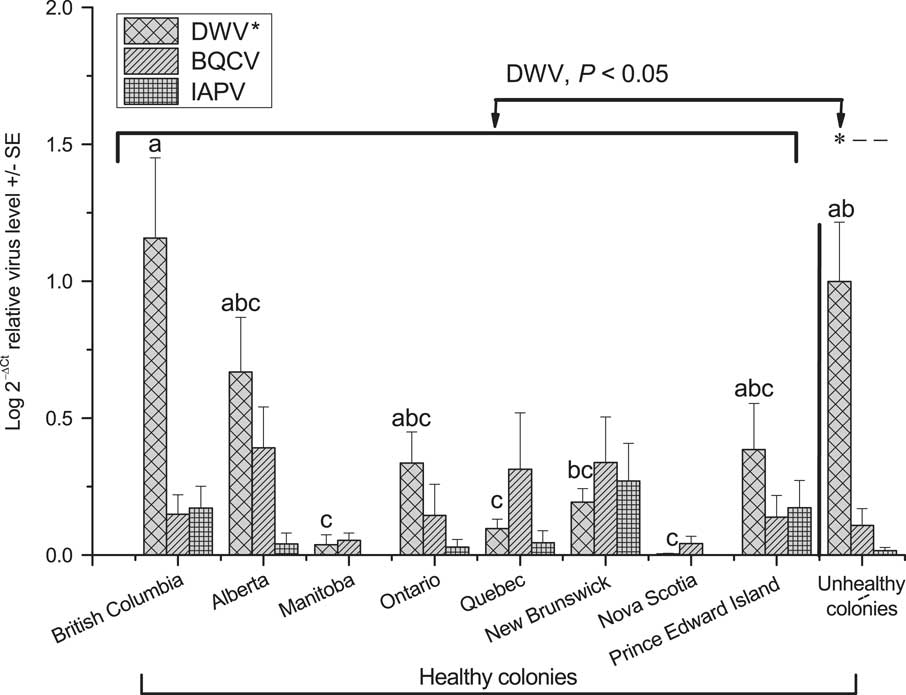
Differences in relative concentration of the three viruses occurred within the provinces of Alberta (SLICE, df=2, 94, F=9.72, P<0.0001), British Columbia (SLICE, df=2, 94, F=12.10 P<0.0001), and in unhealthy colonies within Manitoba (SLICE, df=2, 94 F=27.97 P<0.0001) (Fig. 2). Deformed wing virus concentration was higher than IAPV concentration within the provinces of Alberta, British Columbia and in unhealthy colonies in Manitoba (P<0.05; P diff). Black queen cell virus concentration was lower than DWV concentration within the province of British Columbia and in unhealthy colonies in Manitoba (P<0.05; P diff) but did not differ from DWV in Alberta (P>0.05; P diff) (Fig. 2). Israeli acute paralysis virus concentration was similar to BQCV in all provinces (P>0.05; P diff). No difference in the concentrations of the three viruses occurred within healthy colonies in the rest of the provinces (P>0.05; SLICE).
Within Manitoba, relative virus loads of DWV were greater in unhealthy survivor colonies in spring than in healthy colonies in fall (Tukey’s test, P<0.05) and DWV concentration was greater in unhealthy colonies from Manitoba than in “baseline” fall values for healthy colonies pooled across all provinces (CONTRAST F=18.42, df=1, 94, P<0.0001).
Black queen cell virus was positively correlated with IAPV virus levels across all samples (n=103) (partial correlation coefficients (R=0.31, P=0.002). However, no other combinations of virus DWV-BQCV, DWV-IAPV showed significant correlations.
Simultaneous virus infections
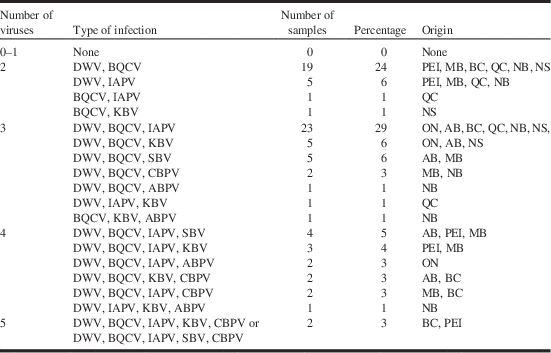
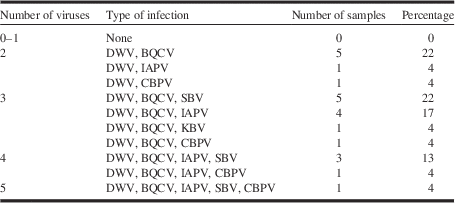
Co-infections with multiple viruses in colonies were common and no samples were found with less than two viruses (Tables 3 and 4). Dual infection occurred in 33% of healthy colonies (Table 3) and was at a similar level in unhealthy colonies (30%) (Tables 3 and 4). The most prevalent dual infection was the pair of DWV and BQCV but the occurrence of this pair was at similar levels within the healthy colonies (24%) and the unhealthy colonies (22%). Co-infections with three viruses were found in 48% of the healthy and 48% in unhealthy colonies. Four viruses were present at the same time in 18% of healthy colonies and 17% of unhealthy colonies. One colony in the unhealthy group and two colonies in the healthy colonies contained five viruses. Sac brood virus was the only virus that occurred at higher frequencies in unhealthy colonies across all provinces than in healthy colonies from Manitoba (see above). Sacbrood virus occurred in combinations with DWV, BQCV, and IAPV in healthy colonies and in combinations with DWV, BQCV, IAPV, and CBPV in unhealthy colonies. Quantitative analysis of SBV was not performed in this study.
Frequencies of simultaneous virus infections in healthy honey bee samples (n=80).

Note: DWV, deformed wing virus; BQCV, black queen cell virus; SBV, sacbrood virus; IAPV, Israeli acute paralysis virus; KBV, Kashmir bee virus; CBPV, chronic bee paralysis virus; ABPV, acute bee paralysis virus; AB, Alberta; BC, British Columbia; MB, Manitoba; NB, New Brunswick; NS, Nova Scotia; ON, Ontario; PEI, Prince Edward Island; QC, Québec.
Frequencies of simultaneous virus infections in unhealthy honey bee samples n=23 from Manitoba.

Note: DWV, deformed wing virus; BQCV, black queen cell virus; SBV, sacbrood virus; IAPV, Israeli acute paralysis virus; KBV, Kashmir bee virus; CBPV, chronic bee paralysis virus.
Discussion
In this study, we characterised the prevalence of seven economically important single-stranded RNA viruses and quantified the variation in relative concentration of three (DWV, BQCV, and IAPV) across a broad geographic range of beekeeping regions in Canada. The viruses characterised in this study are present in A. mellifera all over the world at varying frequencies, but comparatively little is known about which are present in Canada, and of those, which are the most prevalent and greatest potential threats, especially in northern beekeeping regions. Before this study, the baseline levels of bee viruses in Canada had not been studied. We found BQCV, SBV, ABPV, and CBPV for the first time in Canadian bee samples from adult workers. We showed that all seven viruses were common, multiple infections were ubiquitous and the most prevalent viruses were DWV and BQCV in this study. Only DWV concentration varied between regions and with health status of colonies but for most viruses’ prevalence did not.
Healthy colonies in our study were randomly sampled from apiaries distributed across Canada in the autumn whereas unhealthy colonies were from different beekeepers from a single province, and sampled in spring when symptoms appeared. “Unhealthy” colonies they selected were based on combinations of high V. destructor population, small clusters of bees, sudden depopulation of bees, high numbers of twitching dead bees on the bottom board and other characteristics of dying colonies. Thus, observed differences in virus prevalence or concentration between unhealthy and healthy colonies could be due to seasonal differences, regional differences, or differences in variety of other beekeeping management practices that affect colony health. Beekeepers and extension personnel typically discover collapsing colonies in spring where attempts to a diagnosis them can only be made from those colonies exhibiting symptoms that are still alive. The virus types and levels found at that time of year may not represent an accurate picture of which pathogens are responsible for colony loss. Those viruses remaining in collapsing colonies could be opportunistic pathogens that thrive when the colonies immune responses are weakened by other factors. Virus prevalence analysis is commonly carried out on surviving colonies in spring in an attempt to help extension apiarists explain winter colony death as it might relate to fall pathogen composition, but the value of doing this is unclear. Therefore, we compared virus prevalence, composition, and level between unhealthy (diseased) surviving colonies to healthy colonies sampled in fall both within a region (province of Manitoba) and to fall baseline levels for all provinces in Canada. Our results suggest that since unhealthy and healthy colonies had similar prevalence for all viruses within Manitoba and to most viruses across Canada, the identification of the mere presence or absence of bee viruses in colonies is not likely to be useful for assessing the impact of viruses on colonies or informing the development of successful management strategies for colonies. Of the seven viruses, only SBV prevalence differed in the different sample sites but did not differ between healthy and unhealthy colonies within Manitoba. It is not known if differences in SBV prevalence that were observed across Canada were due to health status of colonies, sample timing or sample location. The statistical power to detect subtle differences in prevalence among provinces in this study was very low as only 10 colonies were sampled from each province, but that sample size is typical of what is normally used to explain impacts at the apiary level in commercial beekeeping operations.
Quantitative data on unhealthy colonies provide important baseline information on the pathogen profile and range of virus concentrations in collapsing colonies that will inform the design of future studies on the impacts of specific viruses. Of the potential viruses that infect bee colonies, DWV is emerging as one of the most serious and is frequently associated with severe winter loss of bees (Martin Reference Martin2001; Highfield et al. Reference Highfield, El Nagar, Mackinder, Noel, Hall and Martin2009; Dainat et al. Reference Dainat, Evans, Chen, Gauthier and Neumann2012; Martin et al. Reference Martin, Highfield, Brettell, Villalobos, Budge and Powell2012). Deformed wing virus has recently been linked to honey bee colony declines in Africa, Asia, Europe, Middle East, North America, and South America (Chen et al. Reference Chen, Smith, Collins, Pettis and Feldlaufer2004a; Ellis and Munn Reference Ellis and Munn2005; Berényi et al. Reference Berényi, Bakonyi, Derakhshifar, Koglberger, Topolska and Ritter2007; Ai et al. Reference Ai, Yan and Han2012; Martin et al. Reference Martin, Highfield, Brettell, Villalobos, Budge and Powell2012). Our results suggest the impact of this virus is worthy of further study in Canada as it was ubiquitous, often occurred at high levels in healthy colonies sampled in fall, and was found at high levels in unhealthy colonies sampled in spring.
There may be several reasons for the differences in DWV concentration we observed between provinces. For example, treatment methods (acaricides) that reduce V. destructor levels can influence DWV replication in diseased colonies and differences in the efficacy of mite control that occur in different regions could be responsible for some of the observed variation in DWV (Currie et al. Reference Currie, Pernal and Guzman-Novoa2010; Locke et al. Reference Locke, Forsgren, Fries and de Miranda2012) but these require further study. Differences in climate or beekeeping management practices may also be responsible for the variation and the low number of beekeepers sampled from each region may not be fully representative of provincial averages. We saw comparatively high concentrations of DWV in some provinces but high concentrations of DWV in adult workers also occur in the United States of America (Chen et al. Reference Chen, Smith, Collins, Pettis and Feldlaufer2004a), Thailand (Chantawannakul et al. Reference Chantawannakul, Ward, Boonham and Brown2006), and Europe (Dainat et al. Reference Dainat, Evans, Chen, Gauthier and Neumann2012).
Quantitative analysis of relative virus concentration showed DWV levels within British Columbia, Alberta, and unhealthy colonies in Manitoba were higher than the other two most common viruses examined (BQCV and IAPV). This is in agreement with previous work in France that examined five of the same viruses as in our study and showed that DWV concentrations are generally higher than those of BQCV, SBV, ABPV, KBV, CBPV (Gauthier et al. Reference Gauthier, Tentcheva, Tournaire, Dainat, Cousserans and Colin2007).
Black queen cell virus was the second most prevalent virus and although it was present in most of the colonies in every province sampled, the relative concentration was comparatively low relative to DWV. Black queen cell virus is also widespread in France (86%) (Tentcheva et al. Reference Tentcheva, Gauthier, Zappulla, Dainat, Cousserans and Colin2004), Austria (30%) (Berenyi et al. Reference Berényi, Bakonyi, Derakhshifar, Koglberger and Nowotny2006), Spain (68%) (Kukielka et al. Reference Kukielka, Perez, Higes, Bulboa and Sanchez-Vizcaino2008), and Japan (77%) (Kojima et al. Reference Kojima, Toki, Morimoto, Yoshiyama, Kimura and Kadowaki2011), however, the contribution of this virus to colony loss is uncertain. It has been linked to losses when found in association with Nosema apis (Bailey et al. Reference Bailey, Ball and Perry1983). In our study, N. apis was not quantified in either unhealthy or healthy colonies so potential relationships between nosema and BQCV could not be assessed.
The prevalence of IAPV is of special interest because it has been associated with colonies that die due to colony collapse disorder (CCD) (Cox-Foster et al. Reference Cox-Foster, Conlan, Holmes, Palacios, Evans and Moran2007). Colony collapse disorder-like symptoms have since been diagnosed in many countries, however, subsequent research has shown that IAPV is not the sole reason for colony losses (vanEngelsdorp et al. Reference VanEngelsdorp, Hayes, Underwood and Pettis2008; vanEngelsdorp and Meixner Reference VanEngelsdorp and Meixner2010). Interactions of various stressors with multiple pathogens are now generally thought to be involved in contributing to colony losses in different regions of the world (vanEngelsdorp et al. Reference VanEngelsdorp, Evans, Saegerman, Mullin, Haubruge and Nguyen2009). In our study, IAPV prevalence and relative concentration of IAPV were similar in healthy and unhealthy colonies. Israeli acute paralysis virus is prevalent in Australia, but as was the case in our study, under that climate it is not linked to sudden colony mortality (Cox-Foster et al. Reference Cox-Foster, Conlan, Holmes, Palacios, Evans and Moran2007). In France, only 14% of the 35 apiaries tested are positive to IAPV, and the virus has not been definitively linked to severe winter losses (Blanchard et al. Reference Blanchard, Schurr, Celle, Cougoule, Drajnudel and Thiery2008). Despite the high prevalence and concentration of IAPV in adult bees, beekeepers did not observe symptoms of paralysis in the provincial surveys of asymptomatic colonies even though active IAPV infections with high viral loads can be associated with unhealthy colonies (Chen et al. Reference Chen, Pettis, Corona, Chen, Li and Spivak2014; Hou et al. Reference Hou, Rivkin, Slabezki and Chejanovsky2014)
Prevalence of CBPV, ABPV, and KBV was comparatively lower in the colonies in our study when compared with DWV and BQCV; however, sporadic increases in prevalence of CBPV, ABPV, and KBV occur in European countries. At least one of these viruses (ABPV) is more often found at higher frequencies in mid-summer than in spring or fall (Aubert et al. Reference Aubert, Ball, Fries, Moritz, Milani and Bernardinelli2008) and so if high levels of this virus were present, then it may have been missed by our sampling protocol as colonies were sampled only in fall and spring.
Our study showed SBV occurred more frequently in unhealthy colonies from Manitoba than healthy ones across all provinces. However, when comparing unhealthy and healthy colonies within Manitoba, no differences were noted, and differences between the unhealthy and healthy colonies may have been an artefact associated with lower sample size, differences in timing of sampling or regional variation. Sacbrood virus is known to occur in colonies that are weak in size France, Austria, and Denmark (Tentcheva et al. Reference Tentcheva, Gauthier, Zappulla, Dainat, Cousserans and Colin2004; Berényi et al. Reference Berényi, Bakonyi, Derakhshifar, Koglberger and Nowotny2006; Aubert et al. Reference Aubert, Ball, Fries, Moritz, Milani and Bernardinelli2008). In this study, SBV only occurred in combination with DWV, BQCV, IAPV, and CBPV. It is not known if SBV may have been a causal factor in colony losses in this study or if it is an “opportunistic pathogen” that increases in prevalence when colonies are weakened by other stressors or had no effect. Further studies are required to assess the impacts of this virus alone, and in combination with those that co-occurred in unhealthy colonies.
All the colonies tested in our study had simultaneous infections with multiple viruses. There are similar reports of multiple infections from France (Tentcheva et al. Reference Tentcheva, Gauthier, Zappulla, Dainat, Cousserans and Colin2004), Austria (Berényi et al. Reference Berényi, Bakonyi, Derakhshifar, Koglberger and Nowotny2006), United States of America (Chen et al. Reference Chen, Zhao, Hammond, Hsu, Evans and Feldlaufer2004b), and China (Ai et al. Reference Ai, Yan and Han2012). Multiple virus infections have also been reported for queens, larvae, pupae, and adults (workers), with up to four virus combinations occurring within a single individual (Chen et al. Reference Chen, Zhao, Hammond, Hsu, Evans and Feldlaufer2004b, Reference Chen, Pettis, Collins and Feldlaufer2006). The dynamics of multiple virus infections and the interactions between viruses, V. destructor populations and other stressors within bee colonies are poorly understood. Studies are needed to understand how interactions between these viruses affect colony survival since multiple infections could be a potential indicator warning of poor colony health status.
The underlying causes of high rates of overwintering colony loss in the northern hemisphere remain unclear. In Canada, honey bee winter colony losses of 10–15% are traditionally considered “normal” (Currie et al. Reference Currie, Pernal and Guzman-Novoa2010; Canadian Association of Professional Apiculturalists 2013). However, V. destructor infestation and interactions with other stressors such as viruses, N. apis and colony nutrition have significantly increased colony losses in recent years (Currie et al. Reference Currie, Pernal and Guzman-Novoa2010). Recent colony losses in Canada have ranged from 21% to 35% and are similar those found in the United States of America (35.8%) and in Europe (8–37%) (vanEngelsdorp and Meixner Reference VanEngelsdorp and Meixner2010). The ability to manage bee colonies to prevent colony loss will likely depend developing the ability to directly or indirectly control bee virus epidemics. Increased knowledge of the relative impact of viruses and how to manage viral disease infections is critical.
Our study provides important baseline data on virus presence, prevalence, and concentrations in healthy colonies in Canada. Black queen cell virus, SBV, ABPV, and CBPV were identified for the first time in bee samples from adult workers in Canada. DWV, IAPV, and BQCV levels were quantified for the first time. All seven viruses were common but DWV and BQCV were the most prevalent viruses in Canada. Deformed wing virus was the only virus that varied in concentration with region, and present was at higher levels in unhealthy colonies. Sacbrood virus was the only virus that differed in prevalence among the sample locations. Our study suggests spring virus prevalence data from surviving colonies should not be used by extension personnel to explain colony loss in the absence of other supporting data. Management of honey bee virus infections, by better managing V. destructor populations, providing better nutrition, reducing stresses on bees, reducing infection, breeding bees resistant to viruses or using dsRNA-based treatment methods, may offer substantial hope for successful management of various bee pathogens to prevent winter losses of colonies (Maori et al. Reference Maori, Paldi, Shafir, Kalev, Tsur and Glick2009; Hunter et al. Reference Hunter, Ellis, van Engelsdorp, Hayes, Westervelt and Glick2010; Desai et al. Reference Desai, Eu, Whyard and Currie2012). This study also suggests that DWV and BQCV would be good candidates as models for examining the impact of virus control strategies under Canadian management conditions, because they are common and occur at moderate-to-high concentrations. The role that SBV plays as a possible contributor to colony loss also warrants further study.
Acknowledgements
This work was supported by the funding provided to R.W.C. from Natural Sciences and Engineering Research Council of Canada-Canadian Pollination Initiative (NSERC-CANPOLIN), Manitoba Rural Adaptation Council (MRAC), the Canadian Bee Research Fund, Manitoba Beekeepers Association, and Boone Hodgson Wilkinson Trust Fund. The authors also acknowledge financial support from University of Manitoba Graduate Fellowship to S.D.D. They thank the beekeepers and provincial apiarists Rhéal Lafrenière, David Ostermann, Pierre Giovenazzo, Andony Melathopoulos, Alison Van Alten, Chris Jordan, Chris Maund, Paul vanWestendorp, Joanne Moran from Canada for donating bee samples and providing logistic support. Rob Hill and Denis Krause provided access to laboratory facilities. This is manuscript number 97 from NSERC-CANPOLIN.