




No CrossRef data available.
Article contents
Nested patterns in parasite component communities of a marine fish along its latitudinal range on the Pacific coast of South America
Published online by Cambridge University Press: 25 May 2005
Abstract
A major goal of community ecology is to identify and explain non-random patterns of species composition. To date, the search for nested patterns in parasite component communities of the same fish host species has not been attempted, despite the fact that this higher hierarchical level is more relevant to nestedness analyses. The aims of this study are first, to determine the structure of component communities – considering ectoparasites and endoparasites separately – of a marine fish (Sebastes capensis) with an extended geographical distribution along the southeastern Pacific and, second, to explain these patterns by taking into account the extrinsic factors associated with the distribution of this host fish. From April to September 2003 and from April to August 2004, 537 fish were captured from different latitudes along the southeastern Pacific. The component communities of both ectoparasites and endoparasites of this fish host showed significant nested subset patterns. However, the type of nestedness pattern differed between ectoparasites and endoparasites. Ectoparasite component communities of S. capensis show higher species richness between latitude 30°S and 40°S, whereas endoparasite component communities show higher species richness between 40°S and 52°S. A nested pattern in ectoparasite component communities of S. capensis result from the gradual loss of some ectoparasites species southward and northward of the central part of their latitudinal distribution, which can be explained by the interaction of S. capensis with other host fish species from the central Chilean coast. Nestedness in endoparasite component communities of S. capensis is produced by the gains and losses of species toward the south of their latitudinal distribution, caused by changes in their prey-items (intermediate hosts) along their latitudinal distributional range.
Keywords
Information
- Type
- Research Article
- Information
- Copyright
- © 2005 Cambridge University Press
INTRODUCTION
A major goal of community ecology is to identify and explain nonrandom patterns of species composition in natural species assemblages. Nested subset analyses are valuable descriptive tools for revealing ecologically meaningful non-random patterns, and are useful exploratory tools for suggesting mechanisms that may structure a particular community (Worthen, 1996). A nested pattern has been defined as a departure from a random association of species in which species that compose a depauperate island community constitute a proper subset of those species inhabiting richer islands (Patterson and Atmar, 1986; Wright and Reeves, 1992). This structural pattern seems to be common in communities of free-living organisms (e.g. Patterson and Brown, 1991; Worthern, Carswell and Kelly, 1996; McLain and Pratt, 1999). In recent years, many studies of parasite community ecology, based on nested analyses, have been carried out to understand the forces structuring these communities, especially on fish hosts (e.g. Poulin, 1996, 2001; Worthen and Rohde, 1996; Hugueny and Guégan, 1997; Rohde et al. 1998; Poulin and Guégan, 2000). In parasite communities, a nested subset pattern occurs when the parasite species found in depauperate infracommunities represent non-random subsets of progressively richer ones (Rohde et al., 1998; Poulin and Valtonen, 2001). However, most of those studies, performed at the infracommunity level, have not found any consistency in nested patterns when comparing parasite community structure among different host species (Rohde et al. 1998) and/or among host populations either from different localities or in different seasons (Poulin and Valtonen, 2002; Timi and Poulin, 2003; Vidal-Martínez and Poulin, 2003). Thus, the absence of a general and repeatable nested pattern in parasite communities has been explained by intrinsic factors affecting such infracommunities (e.g. size of fish, prevalence and/or abundances of parasites).
The theory underpinning nested subset patterns (Patterson and Atmar, 1986), however, is more applicable to patterns of presence/absence of parasite species in various host populations or localities, that to patterns of presence/absence in individual hosts. To date, only 3 studies have analysed the structure of component communities of parasites using nestedness analysis (Poulin, 1997; Valtonen et al. 2001; Calvete et al. 2004), but the search for nested patterns in component communities (sensu Bush et al. 1997) of the same host species have not been considered, despite the fact that this higher hierarchical level is more relevant to nestedness analyses. Component communities of parasites are structured by biogeographical processes that are in agreement with the original idea of the nested subset pattern developed by Patterson and Atmar (1986).
The aims of the present study were first, to determine the structure of component communities – treating ectoparasites and endoparasites separately – of a marine fish with an extended geographical distribution in the southern Pacific and, second, to explain these patterns taking into account the extrinsic factors associated with the distribution of this host fish. The red rockfish, Sebastes capensis, lives along the eastern Pacific coast of South America associated with the cold waters of the Humboldt Current System, and southward of 43°S, it lives in the fjord areas of Chile (Kong, 1985); it is a sedentary species, without schooling behaviour, that inhabits in the rocky subtidal (Pequeño, 2000). All of these characteristics allow us hypothesize that nested patterns, if any, in ectoparasite component communities of S. capensis are generated by extrinsic factors such as interaction with other host fish species; and that nested patterns in endoparasite component communities are produced by changes in their prey-items (intermediate hosts) along their distributional latitudinal range.
MATERIALS AND METHODS
The fish were captured from the following localities along the southeastern Pacific: Huacho (11°S) on the Peruvian coast; Iquique (20°S), Antofagasta (23°11′S), Coquimbo (29°58′S), Valparaíso (32°54′S), Talcahuano (36°44′S), Valdivia (39°45′S), Aysen Fjord (45°34′S), and Punta Arenas (52°S) along the Chilean coast (Fig. 1).

Fig. 1. Sampling localities for red rockfish, Sebastes capensis in the Southern Pacific, indicating species richness of ectoparasites (numerator) and endoparasites (denominator). PER=Huacho (11°S); IQQ=Iquique (20°S); ANF=Antofagasta (24°S); COQ=Coquimbo (30°S); VAP=Valparaíso (33°S); THN=Talcahuano (36°S); VAD=Valdivia (40°S); AYS=Aysen channels (45°S); PAR=Punta Arenas (52°S).
From April to September 2003 and from April to August 2004, 537 fish were captured either by hand line, or speared by divers, or else they were acquired from local fishermen who caught them with spinners. Fish were identified using the otolith morphology and taxonomic characteristics outlined by Eschmeyer (1998). The captured fish were placed in individual bags. The depth of capture varied from 15 to 50 m. No ectoparasites were recorded on the fish from Peru. Thus, only 487 specimens were included in the analyses of ectoparasites.
Immediately following capture, the fish were transferred from the sampling locality to the laboratory, and were frozen until analysis. The total length (TL) of each fish was measured (to ±1 cm) prior to dissection. Ectoparasites and endoparasites were collected using traditional parasitological techniques (Pritchard and Kruse, 1982). The collected parasites were sorted, counted, and preserved in 70% alcohol for future identification. The specialized literature was used to identify parasite species (see González and Acuña, 1998).
Due to the non-normality of fish size data in the samples, the Kruskal-Wallis test was performed to compare fish sizes from different localities (Zar, 1999). For each parasite species, mean abundance and prevalence were estimated according to Bush et al. (1997). Parasite richness, that is the number of ectoparasite or endoparasites species present in each component community, was calculated for each locality. The Spearman correlation (rs) was used to evaluate the association between the species richness per host and fish size for ectoparasites and endoparasites separately. The same type of analysis was used to evaluate the possible correlation between sample size and species richness across all localities.
Nestedness analyses
All parasite species found in a fish are probably not a true community because the life-strategies of ectoparasites and endoparasites are different. Thus, nested analyses were carried out separately for ectoparasites and endoparasites. There are various metrics of nestedness (Wright et al. 1998), but most are strongly dependent on the size of the input matrix (species by sites), which makes comparison of nestedness between different data sets difficult. The detection of nestedness depends not only on matrix size (number of cells in the matrix), but also on matrix fill (proportion of cells in the matrix that indicate presence as opposed to absence of parasite species) (Wright and Reeves, 1992). The only metric that appears independent of matrix size is matrix ‘temperature’ (T) proposed by Atmar and Patterson (1993). This metric provides a standardized measure of matrix disorder by quantifying the deviation of an observed matrix from one of the same size and fill that is perfectly nested and ranges from 0 (perfectly nested matrix) to 100 (completely disordered matrix). Thus, nestedness is an estimate of the degree of non-random pattern in species distribution.
We computed the temperature (T) of each matrix (parasite species vs. host populations) for ectoparasites and endoparasites separately, using the Nestedness Temperature Calculator Program (NTCP, Atmar and Patterson, 1995). For each community of parasites, the observed matrix temperature was compared with the T values of 1000 randomly generated presence-absence matrices produced with Monte-Carlo simulations. The statistical probability of the observed pattern was given by the proportion of simulated T values that were lower than or equal to the observed T value and was used as a measure of the departure from the structure expected under random assembly (Guégan and Hugueny, 1994; Hugueny and Guégan, 1997). A P value <0·05 indicated communities that were significantly nested, whereas P values >0·95 characterized significantly anti-nested patterns (Poulin and Valtonen, 2001; Vidal-Martinez and Poulin, 2003).
RESULTS
The sizes of analysed specimens of S. capensis ranged between 16·5 and 35·5 cm of total length. Significant differences in fish sizes existed among sampled localities (Kruskal-Wallis, H(8,537)= 256·71; P<0·001), the fish being largest in Punta Arenas (52°S) and smallest in Peru (32°S) (Fig. 2). The total number of ectoparasites per host (rs=0·249; P<0·05) and total number of endoparasites per host (rs=0·360; P<0·001) were correlated with fish size when all localities were pooled. Also, the ectoparasite species richness per host (rs=0·132; P<0·05) and endoparasite species richness per host (rs=0·270; P<0·001) were correlated with fish size when all localities were pooled. However, when Spearman correlations were performed for each locality the ectoparasite species richness was only correlated with fish size in Valdivia (40°S) and Aysén channels (45°S), and endoparasite species richness was only correlated with fish size in Iquique (20°S), and Talcahuano (36°S).

Fig. 2. Size distribution of examined specimens of Sebastes capensis from different localities (latitudes). Abbreviations of locality name are as in Fig. 1.
The ectoparasite species richness (rs=0·09; P>0·05) and endoparasite species richness (rs=0·314; P>0·05) of component communities were not correlated with the sample size across the 9 localities. Also, the total number of ectoparasites (rs=0·109; P>0·05) and endoparasites (rs=0·302; P>0·05) recovered were not correlated with sample size per locality. There were no observed latitudinal gradient in the ectoparasite species richness (rs=0·11; P>0·05). However, endoparasite species richness was significantly correlated with latitude (rs=0·68; P=0·04), with richness increasing toward the south of the distributional range.
It was found that 94% of the specimens of S. capensis were parasitized by at least 1 ectoparasite species, while 84% of fish were parasitized by at least 1 endoparasite species. The number of fish analysed, species richness, prevalence and mean abundance of the ectoparasites and endoparasites for each locality are given in Tables 1 and 2, respectively.
Table 1. Mean abundances and prevalence (%) of the ectoparasites recorded in Sebastes capensis from different localities along the southeastern Pacific (IQQ=Iquique (20°S); ANF=Antofagasta (24°S); COQ=Coquimbo (30°S); VAL=Valparaíso (33°S); THN=Talcahuano (36°S); VAD=Valdivia (40°S); AYS=Aysén channels (45°S); PAR=Punta Arenas (52°S).)

Table 2. Mean abundances and prevalence (%) of the endoparasites recorded in Sebastes capensis from different localities along the southeastern Pacific (PER=Huacho (11°S); IQQ=Iquique (20°S); ANF=Antofagasta (24°S); COQ=Coquimbo (30°S); VAL=Valparaíso (33°S); THN=Talcahuano (36°S); VALD=Valdivia (40°S); AYS=Aysén channels (45°S); PAR=Punta Arenas (52°S).)

The commonest ectoparasite species distributed along the Pacific coast were the larval isopod, Gnathia sp., the monogeneans, Microcotyle sp., and Interniloculus chilensis and the copepods, Caligus cheilodactylus and Lepeophtheirus chilensis (Table 1). The commonest endoparasite species were the nematodes, Ascarophis sebastodis, and Anisakis sp.; the larval acantocephalan Corynosoma australis; and the digenean, Pseudopecoelus sp. (Table 2). The ectoparasite fauna of S. capensis consisted of component communities with higher species richness between the latitudes 30°S and 40°S; while the endoparasite fauna of this fish host showed component communities with higher species richness between latitudes 40°S to 52°S.
Significant nested subset patterns were observed among both ectoparasite component communities (Matrix fill: 66·6%; Matrix T: 3·64°; P=0·0043) and endoparasites component communities (Matrix fill: 30·6%; Matrix T: 26·74°; P=0·003) of this fish host, along the southeastern Pacific. In ectoparasite communities, nestedness results from depauperate communities in the north and south of the distributional range consisting of subset of the species found in progressively richer communities occurring toward the middle of the range. In endoparasites, as one moves from north to south, one encounter increasingly rich component communities, with the species-poor communities being proper subset of the progressively richer ones (Fig. 3).

Fig. 3. Matrix presence (dark square) and absence (white square) of the parasites recovered of Sebastes capensis across its latitudinal range. (A) Ectoparasites. Cal: C. cheilodactylus; Mi1: Microcotyle sp.1; Lch: L. chilensis; Gna: Gnathia sp.; Ich: I. chilensis; Neo: Neobenedenia sp.; Udo: U. australis; Pis: Piscicolidae; Cir: Cirolana sp.; Mi2=Microcotyle sp.2. (B) Endoparasites. As: A. sebastodis; An: Anisakis sp., Co: C. australis; Ps: Psettarium sp.; Hy: Hysherothylacium sp.; Cu: Cucullanus sp.; Lg: L. genypteri; Hn: H. nimia; Zo: Zoogonidae; He: Hemiuridae; Sp: S. pleuronectis; L1, L2, L3: Lecithastheridae spp.; D1, D2: Digenea spp., Dp: Diphyllobothrium sp, Ht: H. trichiuri; Dy: Dyphillidea. Abbreviations of locality name are as in Fig. 1.
DISCUSSION
There is still not enough evidence that nested patterns are common in communities of fish parasites. Several studies showed either no evidence of nested subset pattern, or that a nested pattern is rare among parasite species in a host population (Poulin, 1996; Worthen and Rohde, 1996; Rohde et al. 1998; Gotelli and Rohde, 2002). Rohde et al. (1998), in an extensive study, showed that only one-third of parasite assemblages studied were nested, concluding that parasite assemblages in marine fish were commonly unstructured and unpredictable, at least in terms of hierarchical species assembly rules. However, other studies have shown that an increase in parasite species richness did not occur at random but followed a predictable pattern of parasite infracommunity structure (Guégan and Hugueny, 1994). Rohde et al. (1998) pointed out that other authors have found nested patterns in fish parasite assemblages only because they used fish samples including both juvenile and adult hosts. Along the same lines, Poulin and Valtonen (2001) determined that nested subset patterns are more likely to be observed in host samples in which parasite abundance is correlated with host size. Likewise, Poulin and Guégan (2000), and Poulin and Valtonen (2002) demonstrated that as the prevalence or mean intensity of parasites increase in a fish population, the likelihood that the parasite infracommunities are nested also increases. All of theses studies, however, have focused on the infracommunity level. Infracommunities are ephemeral assemblages influenced by epidemiological processes (Morand, Rohde and Hayward, 2002). Nested patterns are more likely to reflect ecological processes on larger geographical scales. In this study, intrinsic factors such as fish size, prevalence or abundances of parasites in individual hosts are considered, but we focused on the component communities of the same fish host species across of its latitudinal range. These component communities are influenced mainly by extrinsic factors associated with biogeographical processes.
In free-living organisms, nested patterns observed across insular or fragmented habitats are considered to result from differential colonization or extinction probabilities among available species (Patterson and Atmar, 1986; Worthen, 1996). Nested patterns in parasite communities have also been explained by colonization-extinction dynamics (Guégan and Hugueny, 1994; Rohde, Hayward and Heap, 1995). The component communities of both ectoparasites and endoparasites of the fish host studied here show significant nested subset patterns. However, the nestedness pattern is different for ectoparasites and endoparasites. The ectoparasite fauna of S. capensis shows component communities with higher species richness between the latitudes 30°S and 40°S, while the endoparasite fauna consist of component communities with higher species richness between latitudes 40°S to 52°S. This indicates that the processes underlying the structure of component communities in S. capensis are different for ectoparasites and endoparasites and, therefore, the approach used here, that is independent analyses for each group of parasites, was correct.
The geographical distribution of Sebastes capensis along the southeastern Pacific coast overlaps with two faunistic provinces: a northern warm temperate region, extending from Peru to the northern Chilean coast up to ca. 30°S, and a cold temperate region, extending southward of 42°S along the southern Chilean coast (Briggs, 1974). Between both areas lies a transitional zone in which species of northern and southern origins overlap (Brattstrom and Johanssen, 1983; Lancelloti and Vásquez, 1999). The ectoparasite fauna of S. capensis consists predominantly of a group of 6 species that remain fairly constant along the Chilean coast (Table 1). However, there is another group formed by 4 species (Udonella australis, Microcotyle sp.2, Piscicolidae gen. sp., and Cirolana sp.) that are distributed only within the transitional zone, disappearing northward and southward of this zone. The monogenean U. australis is an epibiont of the copepods C. cheilodactylus (Carvajal and Sepulveda, 2002) and L. chilensis (González and Acuña, 1998) and these caligids also infest other fish species from the Chilean coast (Fernández and Villalba, 1986; Carvajal, González and George-Nascimento, 1998). Thus, the absence of U. australis in the northern and southern Chilean coast may be related to the low levels of infestation of S. capensis by these caligid copepods at these latitudes (Table 1). Also, it is possible that the presence of U. australis only in the transitional zone may be a consequence of a close interaction between individuals of S. capensis and the other host fish species that harbour both copepods species and that may be more abundant in the transitional zone, ensuring higher infestation rates. Likewise, the higher ectoparasite species richness of S. capensis in the transitional zone (30°S – 40°S) might result from the interaction of S. capensis with the other members of the fish fauna of the Chilean coast. In this transitional zone lives a mixture of fish species from subtropical and sub-Antarctic origins (Ojeda, Labra and Muñoz, 2000; Pequeño, 2000), which could facilitate the contagious transmission of generalist ectoparasites like caligids. According to Ojeda et al. (2000), the littoral fish diversity remains fairly constant along the Chilean coast down to around 40°S, and then declines south of this latitude. Nevertheless, there are fish species whose distributions are restricted to the transitional zone. Also, in a study that considered only fishes living in the sub-littoral rocky habitat, although in a narrower latitudinal range, Moreno, Duarte and Zamorano (1979) observed a greater community diversity of these fish species along the central coast in comparison to the southern coast. Thus, the decrease in the diversity of littoral fishes southward of 42°S could explain the decrease of ectoparasite species richness of S. capensis southward. On the other hand, the higher ectoparasite species richness of S. capensis in the transitional zone may be attributed to the movements of their populations. According to Oliva and González (2004), differences in the structure of the parasite fauna of S. capensis suggest strongly the existence of different populations in Coquimbo (30°S) and Antofagasta (24°S). Therefore, the fish populations from the northern localities (20°S–24°S) might show lower ectoparasite species richness because there are fewer contacts between infested and uninfested fish there than in the transitional zone. Thus, the nested pattern observed in ectoparasite component communities of S. capensis is produced by the loss of some ectoparasites species southward and northward of their latitudinal distribution.
The nested patterns for endoparasites have been attributed to the pattern in which hosts accumulate parasite species rather interactions among those parasite species (Poulin and Valtonen, 2001). Thus, the species composition of these parasite communities is not determined from within the community, but rather by local extrinsic factors (e.g. host feeding rates, host habitat) that are likely to occur within of a host population. However, it is expected that factors such as host spatial range and geographical circumstances affecting the distribution and/or availability of prey (intermediate hosts) are responsible for the different endoparasite composition among host populations living in different environments (biogeographical areas). The endoparasite fauna of S. capensis consists of 3 species (Ascarophis sebastodis, Anisakis sp., and Corynosoma australis) that are widely distributed along the entire southeastern Pacific. However, in the southern latitudes new species are added (e.g. Hystherothylacium sp., Cucullanus sp., and larval cestodes) (Table 2). This increase in endoparasite species richness toward higher latitudes along the southeastern Pacific is concordant with the pattern observed for mollusc species diversity in this region of the world (Valdovinos, Navarrete and Marquet, 2003).
The composition of prey species for S. capensis shows clear geographical variations, which agree well with the availability of prey across the southeastern Pacific (unpublished data). Along the north and central Chilean coast, the main prey of S. capensis are crustacean such as Rhynchocinetes typus, and Petrolisthes desmarestii, but these prey are distributed only from 10°S up to 38°S on the Chilean coast (Retamal, 1981). South of 40°S, other crustaceans like mysids, but also different species of fish are important prey items of S. capensis. Despite the fact that life-cycles are not known for the endoparasites species recovered, the changes in the prey items of S. capensis along its latitudinal distribution are concordant with changes in the composition of endoparasites (unpublished data). Thus, the nestedness pattern found in the endoparasite component communities of S. capensis result from gains of species toward the south of their latitudinal distribution.
Further studies on nestedness patterns focusing on the parasite component communities of the same host across of their distributional range are necessary to determine whether the nestedness of component communities of the same host species is a generalized pattern associated with the geographical distributional range of the host.
This study was funded by fellowships CONICYT AT-4040092; MECESUP AUS-111, MECESUP UCO-0214 and D.I.D. of the University Austral of Chile granted to the principal author. M.T.G. is currently funded by a CONICYT (Chilean National Council of Science and Technology) doctoral fellowship.
References
REFERENCES
Atmar, W. and
Patterson, B. D. (
1993).
The measure of order and disorder in the distribution of species in fragmented habitat.
Oecologia
96,
373–382.CrossRefGoogle Scholar
Atmar, W. and
Patterson, B. D. (
1995).
The nestedness temperature calculator: a visual basic program, including 294 presence-absence matrices.
AICS Research, Inc., University Park, NM and The Field Museum,
Chicago, Il. http:/www.aics-research.com/nestedness/tempcalc.html.
Brattström, H. and
Johanssen, A. (
1983).
Ecological and regional zoogeography of the marine benthic fauna of Chile.
Sarsia
68,
289–339.CrossRefGoogle Scholar
Briggs, J. C. (
1974).
Marine Zoogeography.
McGraw-Hill Co.,
New York.
Bush, A. O.,
Lafferty, K. D.,
Lotz, J. M. and
Shostak, A. W. (
1997).
Parasitology meets ecology in its own terms: Margolis et al. revisited.
Journal of Parasitology
83,
575–583.CrossRefGoogle Scholar
Calvete, C.,
Blanco-Aguiar, J. A.,
Virgós, E.,
Cabeza-Díaz, S. and
Villafuerte, R. (
2004).
Spatial variation in helminth community structure in the red-legged partridge (Alectoris rufa L): effects of definitive host density.
Parasitology
129,
101–113.CrossRefGoogle Scholar
Carvajal, J.,
González, L. and
George-Nascimento, M. (
1998).
Native sea lice (Copepoda: Caligidae) infestation of salmonids reared in netpen systems in southern Chile.
Aquaculture
166,
241–246.CrossRefGoogle Scholar
Carvajal, J. and
Sepúlveda, F. (
2002).
Udonella australis n. sp. (Monogenea), an epibiont on sea-lice from native fish off southern Chile.
Systematic Parasitology
52,
67–74.Google Scholar
Eschmeyer, E. (
1998).
Catalog of Fishes.
California Academy of Sciences,
San Francisco.
Fernández, J. and
Villalba, C. (
1986).
Contribución al conocimiento del género Caligus Müller, 1785 (Copepoda: Siphonostomatoida) en Chile.
Gayana Zoologia
50,
37–62.Google Scholar
González, M. T. and
Acuña, E. (
1998).
Metazoan parasites of Sebastes capensis from northern Chile.
Journal of Parasitology
84,
753–757.Google Scholar
Gotelli, N. J. and
Rohde, K. (
2002).
Co-ocurrence of ectoparasites of marine fishes: a null model analyses.
Ecology Letters
5,
86–94.CrossRefGoogle Scholar
Guégan, J. F. and
Hugueny, B. A. (
1994).
Nested parasite species subset patterns in tropical fish host as major determinant of parasite infracommunity structure.
Oecologia
100,
184–189.CrossRefGoogle Scholar
Hugueny, B. and
Guégan, J. F. (
1997).
Community nestedness and the proper way to assess statistical significance by Monte-Carlo tests: some comments on Worthen and Rohde's (1996) paper.
Oikos
80,
572–574.CrossRefGoogle Scholar
Kong, I. (
1985).
Revisión de las especies chilenas de Sebastes (Osteichthyes, Scorpaeniformes, Scorpaenidae).
Estudios Oceanologicos
4,
21–75.Google Scholar
Lancellotti, D. A. and
Vásquez, J. A. (
1999).
Biogeographical patterns of benthic macroinvertebrates in the Southeastern Pacific littoral.
Journal of Biogeography
26,
1001–1006.CrossRefGoogle Scholar
McLain, D. K. and
Pratt, A. E. (
1999).
Nestedness of coral reef fish across a set of fringing reefs.
Oikos
85,
53–67.CrossRefGoogle Scholar
Moreno, C. A.,
Duarte, W. E. and
Zamorano, J. H. (
1979).
Variación latitudinal del número de especies de peces en el sublitoral rocoso: una explicación ecológica.
Archivos de Biología y Medicina Experimental (Chile)
12,
169–178.Google Scholar
Morand, S.,
Rohde, K. and
Hayward, C. (
2002).
Order in ectoparasite communities of marine fish is explained by epidemiological processes.
Parasitology
124 (Suppl.),
S57–S63.CrossRefGoogle Scholar
Ojeda, P.,
Labra, F. and
Muñoz, A. (
2000).
Patrones biogeográficos de los peces litorales de Chile.
Revista Chilena de Historia Natural
73,
625–641.Google Scholar
Oliva, M. E. and
González, M. T. (
2004).
Metazoan parasites of Sebastes capensis from two localities in northern Chile as tools for stock identification.
Journal of Fish Biology
64,
170–175.CrossRefGoogle Scholar
Patterson, B. D. and
Atmar, W. (
1986).
Nested subsets and the structure of insular mammalian faunas and archipelagos.
Biological Journal of the Linnaean Society
28,
65–82.CrossRefGoogle Scholar
Patterson, B. D., and
Brown, J. H. (
1991).
Regionally nested patterns of species composition in granivorous rodent assemblages.
Journal of Biogeography
18,
395–402.CrossRefGoogle Scholar
Pequeño, G. (
2000).
Delimitaciones y relaciones biogeográficas de los peces del Pacífico Suroriental.
Estudios Oceanológicos
19,
53–76.Google Scholar
Poulin, R. (
1996).
Richness, nestedness, and randomness in parasite infracommunity structure.
Oecologia
105,
545–551.CrossRefGoogle Scholar
Poulin, R. (
1997).
Parasite Faunas of Freshwater Fish: The Relationship Between Richness and the Specificity of Parasites.
International Journal for Parasitology
27,
1091–1098.CrossRefGoogle Scholar
Poulin, R. (
2001).
Interactions between species and the structure of helminth communities.
Parasitology
122 (Suppl.),
S3–S11.CrossRefGoogle Scholar
Poulin, R. and
Guégan, J. F. (
2000).
Nestedness, anti-nestedness, and the relationship between prevalence and intensity in ectoparasite assemblages of marine fish: a spatial model of species coexistence.
International Journal for Parasitology
30,
1147–1152.CrossRefGoogle Scholar
Poulin, R. and
Morand, S. (
1999).
Geographical distances and the similarity among parasite communities of conspecific host populations.
Parasitology
119,
369–374.CrossRefGoogle Scholar
Poulin, R. and
Valtonen, E. T. (
2001).
Nested assemblages resulting from host size variation: the case of endoparasite communities in fish hosts.
International Journal for Parasitology
31,
1194–1204.CrossRefGoogle Scholar
Poulin, R. and
Valtonen, E. T. (
2002).
The predictability of helminth community structure in space: a comparison of fish populations from adjacent lakes.
International Journal for Parasitology
32,
1235–1243.CrossRefGoogle Scholar
Pritchard, M. A. and
Kruse, G. O. (
1982).
The Collection and Preservation of Animal Parasites.
University of Nebraska Press,
Lincoln, NE,
USA.
Retamal, M. A. (
1981).
Catálogo ilustrado de los crustáceos decápodos de Chile.
Gayana Zoología
44,
1–110.Google Scholar
Rohde, K.,
Hayward, C. and
Heap, M. (
1995).
Aspects of the ecology of metazoan ectoparasites of marine fishes.
International Journal for Parasitology
25,
945–970.CrossRefGoogle Scholar
Rohde, K.,
Worthen, W. B.,
Heap, M.,
Hugueny, B. and
Guégan, J. F. (
1998).
Nestedness in assemblages of metazoan ecto-and endoparasites of marine fish.
International Journal for Parasitology
28,
543–549.CrossRefGoogle Scholar
Timi, J. T. and
Poulin, R. (
2003).
Parasite community structure within and across host populations of a marine pelagic fish: how repeatable is it?
International Journal for Parasitology
33,
1353–1362.Google Scholar
Valdovinos, C.,
Navarrete, S. and
Marquet, P. (
2003).
Mollusk species diversity in the Southeastern Pacific: why are there more species towards the pole?
Ecography
26,
139–144.Google Scholar
Valtonen, E. T.,
Pulkkinen, K.,
Poulin, R. and
Julkunen, M. (
2001).
The structure of parasite component communities in brackish fishes of the northeastern Baltic Sea.
Parasitology
122,
471–481.CrossRefGoogle Scholar
Vidal-Martínez, V. and
Poulin, R. (
2003).
Spatial and temporal repeatability in parasite community structure of tropical fish hosts.
Parasitology
127,
387–398.CrossRefGoogle Scholar
Worthern, W. D. (
1996).
Community composition and nested-subset analyses: basic descriptors for community ecology.
Oikos
76,
417–426.CrossRefGoogle Scholar
Worthen, W. B. and
Rohde, K. (
1996).
Nested subset analyses of colonization-dominated communities: metazoan ectoparasites of marine fishes.
Oikos
75,
471–478.CrossRefGoogle Scholar
Worthen, W. B.,
Carswell, M. L. and
Kelly, K. A. (
1996).
Nested subset structure of larval mycophagous fly assemblages: nestedness in a non-island system.
Oecologia
107,
257–264.CrossRefGoogle Scholar
Wright, D. H. and
Reeves, J. H. (
1992).
On the meaning and measurement of nestedness of species assemblages.
Oecologia
92,
416–428.CrossRefGoogle Scholar
Wright, D. H.,
Patterson, B. D.,
Mikkelson, G. M.,
Cutler, A. and
Atmar, W. (
1998).
A comparative analysis of nested subset patterns of species composition.
Oecologia
113,
1–20.Google Scholar
Zar, J. (
1999).
Biostatistical Analysis, 4th Edn.
Prentice-Hall Inc.,
NJ,
USA.
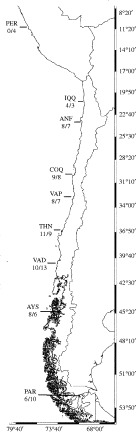
Fig. 1. Sampling localities for red rockfish, Sebastes capensis in the Southern Pacific, indicating species richness of ectoparasites (numerator) and endoparasites (denominator). PER=Huacho (11°S); IQQ=Iquique (20°S); ANF=Antofagasta (24°S); COQ=Coquimbo (30°S); VAP=Valparaíso (33°S); THN=Talcahuano (36°S); VAD=Valdivia (40°S); AYS=Aysen channels (45°S); PAR=Punta Arenas (52°S).
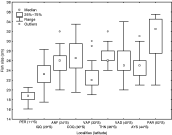
Fig. 2. Size distribution of examined specimens of Sebastes capensis from different localities (latitudes). Abbreviations of locality name are as in Fig. 1.
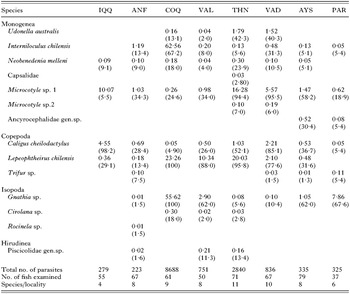
Table 1. Mean abundances and prevalence (%) of the ectoparasites recorded in Sebastes capensis from different localities along the southeastern Pacific
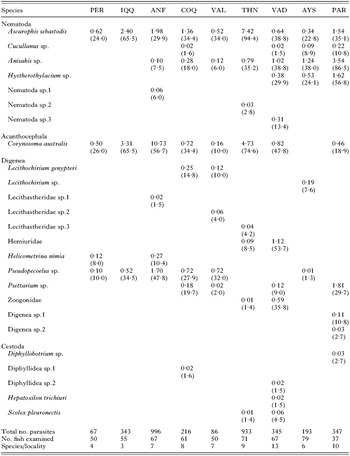
Table 2. Mean abundances and prevalence (%) of the endoparasites recorded in Sebastes capensis from different localities along the southeastern Pacific
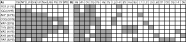
Fig. 3. Matrix presence (dark square) and absence (white square) of the parasites recovered of Sebastes capensis across its latitudinal range. (A) Ectoparasites. Cal: C. cheilodactylus; Mi1: Microcotyle sp.1; Lch: L. chilensis; Gna: Gnathia sp.; Ich: I. chilensis; Neo: Neobenedenia sp.; Udo: U. australis; Pis: Piscicolidae; Cir: Cirolana sp.; Mi2=Microcotyle sp.2. (B) Endoparasites. As: A. sebastodis; An: Anisakis sp., Co: C. australis; Ps: Psettarium sp.; Hy: Hysherothylacium sp.; Cu: Cucullanus sp.; Lg: L. genypteri; Hn: H. nimia; Zo: Zoogonidae; He: Hemiuridae; Sp: S. pleuronectis; L1, L2, L3: Lecithastheridae spp.; D1, D2: Digenea spp., Dp: Diphyllobothrium sp, Ht: H. trichiuri; Dy: Dyphillidea. Abbreviations of locality name are as in Fig. 1.
 You have
Access
- 29
- Cited by