Implications: This work is the first evaluation of the effects on a wide range of carcass traits in a commercially relevant population of crossbred lambs of a quantitative trait locus (QTL) affecting loin muscling. The work is important in providing information to the commercial sheep industry of the effects of this QTL and, along with other work on the effects on meat quality and lambing ease and lamb vigour, will form the basis of the recommendations to the sheep industry on the best way in which this QTL might be included in selection programmes if appropriate.
Introduction
The advent of genomics offers new opportunities to produce faster genetic improvement in traits of commercial importance in livestock populations, and to more accurately estimate genetic merit in traits that are difficult or expensive to measure. Increasing numbers of potentially exploitable genes and quantitative trait loci (QTL) with identifiable effects on production traits are being discovered. Pleiotropy, caused by a single gene affecting multiple phenotypic traits, and epistasis due to interactions between genes can affect the expression and magnitude of the effects of a gene or QTL. Therefore, if the commercial populations in which the gene or QTL may be used differ from those in which it was detected, it is advisable to confirm the effects of a gene or QTL in these commercial populations before widespread use can be recommended. It is also helpful to identify what positive or negative pleiotropic effects these genes or QTLs may have.
Walling et al. (Reference Walling, Visscher, Wilson, McTeir, Simm and Bishop2004) identified a QTL in purebred UK Texel sheep on ovine chromosome 18, one copy of which led to an increase of 1.2–2.0 mm in loin muscle depth as measured by ultrasound scanning at the third lumbar vertebra. This QTL, confirmed by Matika et al. (2006), was later known as the Texel muscling QTL (TM-QTL) and is of interest in the sheep industry as a potential tool to increase carcass value. However, the stratified nature of the sheep industry in the UK means that a large proportion (~70%) of slaughter lambs are crossbred animals produced from a cross between a terminal sire breed (of which the Texel is the most widely used) and a maternal crossbred ewe (mainly Mule, i.e. Bluefaced Leicester × Hill), rather than purebred animals (Pollott and Stone, 2006). As such it is necessary to identify whether TM-QTL has similar effects on loin muscle traits in crossbred progeny of Texel sires and Mule ewes. It is also important to determine whether TM-QTL only affects meat yield of the loin area, or whether it also affects other parts of the carcass.
Walling et al. (Reference Walling, Visscher, Wilson, McTeir, Simm and Bishop2004) suggest that the value of TM-QTL may be to provide carcasses with greater lean meat yield (LMY) in the loin area. As such, carcass dissection provides the most direct measurement of the value of TM-QTL. However, X-ray computed tomography (CT) is a sophisticated imaging technique that is able to provide detailed and accurate information on specific carcass regions such as the loin area, including muscle depths, widths and areas measured on cross-sectional scans (Jones et al., Reference Jones, Lewis, Young and Wolf2002). Additionally, muscle volume (Navajas et al., Reference Navajas, Glasbey, McLean, Fisher, Charteris, Lambe and Bunger2006) and muscularity (describing muscle shape and quantified using an index relating muscle volume to spine length; Navajas et al., Reference Navajas, Lambe, McLean, Glasbey, Fisher, Charteris, Bunger and Simm2007) may also be assessed using spiral CT scanning techniques. Clearer definitions of the effects of TM-QTL on the different attributes of the loin region in the live animal are therefore possible using CT in contrast to the limited measures of muscle and fat depths in the loin region provided by ultrasound scanning.
This work aims to use ultrasound scanning to quantify the effect of TM-QTL on loin muscling in crossbred lambs to facilitate a comparison with the original work by Walling et al. (Reference Walling, Visscher, Wilson, McTeir, Simm and Bishop2004) and Matika et al. (2006) in purebred Texel sheep. In addition, CT scanning data will be used to determine the way in which TM-QTL affects muscling (quantity of muscle) and muscularity (muscle shape) in the loin and hind leg. Finally, carcass dissection data will be analysed to quantify the effect of TM-QTL on carcass and joint composition, distribution of lean meat across the carcass, and LMYs of different carcass regions.
Material and methods
Animals and their management
All procedures involving animals were approved by the Scottish Agricultural College (SAC) Animal Ethics Committee and were performed under UK Home Office licence, following the regulations of the Animals (Scientific Procedures) Act 1986. Two-year-old Mule ewes (Bluefaced Leicester × Scottish Blackface) (n = 186) were acquired from a commercial flock and mated using artificial insemination to four Texel sires expected to be heterozygous for TM-QTL based on genotypes at the appropriate markers on chromosome 18 (see genotyping section below). The Texel sires were sourced from the resource population in which TM-QTL had been reported to be segregating (Walling et al., Reference Walling, Visscher, Wilson, McTeir, Simm and Bishop2004; Matika et al., 2006). Lambs from 102 of the ewes mated (n = 182) were followed throughout growth until slaughter. Lambs and ewes grazed on pasture and the lambs were weighed every 5 weeks from birth to slaughter.
Live-animal measurements
At around 20 weeks of age, all surviving lambs that had been naturally reared (as opposed to hand-reared) and suffered no obvious growth checks (n = 166; 137 twins, 29 singles; 81 castrated males, 85 females) were scanned using ultrasound and CT. Ultrasound scanning (average age = 141 days, minimum = 131 days and maximum = 149 days) was performed, using a Dynamic Imaging Concept MLV ultrasonic scanner with a 3.5 mHz transducer, at the third lumbar vertebra to measure muscle depth and fat depth. Muscle depth was measured vertically at the deepest point. Three fat depths were measured on each scan: the first above the boundary between M. longissimus lumborum (MLL) and the vertebral spinous process, and the others at progressively lateral intervals of around 2 cm. This resulted in fat depths that, for most animals, spanned the longissimus muscle. These fat depths were averaged to provide a single measure of ultrasound fat depth for use in the analysis of the effect of TM-QTL on this trait.
Lambs were CT scanned using spiral CT scanning (Navajas et al., Reference Navajas, Glasbey, McLean, Fisher, Charteris, Lambe and Bunger2006) with a Siemens Somatom Esprit CT scanner at the Scottish Agricultural College and Biomathematics and Statistics Scotland (SAC-BioSS) CT scanning unit either 1, 2 or 3 days after ultrasound scanning (average age = 144 days, minimum = 132 days and maximum age = 152 days). Images were analysed using STAR software (Mann et al., 2003) to provide both two- (2D) and three-dimensional (3D) measurements in the loin region and the leg region.
2D CT measurements taken in the loin were depth (D), width (W) and area (A) of the MLL in a cross-sectional scan taken at the fifth lumbar vertebra (Jones et al., Reference Jones, Lewis, Young and Wolf2002). Both left and right sides were measured and the average of these used in analyses. In the leg, the 2D CT measurements were width (W) and length (L) of the hind leg (HL) muscle on a cross-sectional scan taken at the ischium as described by Jones et al. (Reference Jones, Lewis, Young and Wolf2002). Measurements were made on both right (r) and left (l) legs and the average used in analyses. A 2D gigot shape score was also calculated as 10 × (HLW r + HLW l) / (HLL r + HLL l).
Measurements taken using the 3D capabilities of the CT scanner were loin muscle volume (LRMV), lumbar spine length (LSL), hind leg muscle volume (HLMV) and femur length (FL). These allowed calculation of a muscularity index as described by Navajas et al. (Reference Navajas, Lambe, McLean, Glasbey, Fisher, Charteris, Bunger and Simm2007) for both the loin and hind leg regions. This index relates the weight of muscle in a region (equivalent to muscle volume because muscle density is close to 1 g/cm3) to the length of the bone in that region and thus provides an assessment of muscularity independent of fatness at a constant carcass weight. The CT muscularity index for the hind leg (HLMI) was calculated as 10 × [√(HLMV/FL3)] and that for the loin region (LRMI) was calculated as 10 × [√(LRMV/LSL3)].
Carcass measurements
After CT scanning, the 166 lambs were transported to the Welsh Country Foods abattoir in Anglesey for slaughter (average age = 151 days, minimum age = 141 days and maximum age = 159 days). The carcasses were then returned to SAC in a refrigerated lorry and split into primal cuts. The first cut was made between the sixth and seventh rib to remove the fore-end, a second cut was made between the fifth and sixth lumbar vertebrae to remove the hind legs, and the kidney and knob and channel fat were removed. The fore-end (shoulders), saddle (loin and breast) and hind leg sections were then split into right and left sides and each was individually weighed. Chump joints were removed from each of the right and left hind legs by removing the knuckle from the tibia (below the calcaneal tuber) and the point end of the chump. The left and right saddles were separated into breast and loin joints by cutting parallel to the backbone from a point approximately twice the length of the eye muscle at the anterior end (best end of the neck) of the loin.
The left leg, chump, breast, loin and shoulder joints were dissected into lean meat (muscle), fat (including subcutaneous fat and intermuscular fat) and bone. The right leg, chump, breast, loin and shoulder joints were butchered into retail joints to conform to a supermarket specification with fat trimmed to a maximum of 6 mm at any point on the cut. Accordingly, the right chump was separated into boneless chump, ‘very lean’ chump trimmings, and bone and fat trim, and the right leg joint was separated into shank-off leg joint, leg fillet, and bone and fat trim. The back strap (ligamentum nuchae) and the knuckle ends (below the carpus of the radius and ulna) were removed from the right shoulder joint and it was then partitioned into a blade side cut, a knuckle side cut, and bone and fat trim. The right loin was subdivided into loin chops, and bone and fat trim.
The left and right MLL, and the left and right hind leg knuckle muscles (from the cranial side of the hind leg including M. quadriceps femoris only), were removed and weighed separately during the dissection and butchery processes. LMY in the left half carcass was calculated as the sum of LMY in each of the joints in the left carcass side. The saleable meat yield (SMY) in the right half of the carcass was calculated as the sum of the boneless chump, ‘very lean’ chump trimmings, hind leg shank-off, hind leg fillet, chops, breast, shoulder knuckle side and shoulder blade side cuts of the right carcass side.
Genotyping and classification of TM-QTL carrier/non-carrier status
All animals (sires, dams and lambs) were blood sampled and blood-spotted onto FTA® cards. The causal gene(s) responsible for the TM-QTL is/are as yet unknown; therefore it was necessary to use microsatellite markers around the region of interest to classify the likely QTL genotype for each animal. Blood samples were genotyped for five microsatellite markers on chromosome 18 (IDVGA30, MCMA26, OARTMR1, OY5 and OY3) at the AgResearch Molecular Biology Unit in Dunedin, New Zealand. One of these markers (IDVGA30) proved difficult to genotype and so was not used in the final TM-QTL genotype classification. Data from the initial 166 lambs with live weights and carcass data available were edited for marker inconsistencies, resulting in 151 lambs with informative marker data. All animals were also genotyped for the g + 6723G-A mutation in the Myostatin gene (on chromosome 2) reported by Clop et al. (Reference Clop, Marcq, Takeda, Pirottin, Tordoir, Bibe, Bouix, Caiment, Elsen, Eychenne, Larzul, Laville, Meish, Milenkovic, Tobin, Charlier and Georges2006), using the MyoMAX® test (Catapult Genetics Ltd, Dunedin, New Zealand). The increase in carcass muscling and reduced carcass fatness that are characteristic of MyoMAX® (Broad et al., Reference Broad, Glass, Greer, Robertson, Bain, Lord, McEwan and Peterson2000; Marcq et al., 2002; Laville et al., Reference Laville, Bouix, Sayd, Bine, Elsen, Larzul, Eychenne, Marcq and Georges2004; Johnson et al., Reference Johnson, McEwan, Dodds, Purchas and Blair2005) are caused by a single G to A transition in the 3′ untranslated region of the Myostatin gene (also known as GDF8, Growth and Differentiation Factor 8) (Clop et al., Reference Clop, Marcq, Takeda, Pirottin, Tordoir, Bibe, Bouix, Caiment, Elsen, Eychenne, Larzul, Laville, Meish, Milenkovic, Tobin, Charlier and Georges2006). Genotyping for this mutation was done in order to exclude the possibility of the known effects of this mutation on carcass traits confounding the data in this study.
Marker data were used to define, within sire families, haplotypes (combinations of marker alleles) that were associated with the favourable allele of TM-QTL. All dams were non-carriers for TM-QTL. Marker alleles and haplotypes did not always correspond with those previously found by Walling et al. (Reference Walling, Visscher, Wilson, McTeir, Simm and Bishop2004); hence, it was necessary to use data from the current study to redefine TM-QTL haplotypes. Firstly, half-sib regression interval mapping techniques using QTL Express software (Seaton et al., Reference Seaton, Hayley, Knott, Kearsey and Visscher2002) were used to verify that the QTL was indeed segregating in the experimental population. Having demonstrated a significant QTL for muscle depth segregating at the expected chromosomal location, at the 5% chromosome-wide significance threshold, individual sires likely to be segregating for the QTL were then determined. The criteria for an individual sire to be considered segregating was that the sire-specific t-value for the QTL was >1.96, and two of the four sires met this criterion. One of the two sires not meeting this criterion, however, had a t-value between 1 and 2, and examination of the data showed that there was some evidence of a QTL segregating among his progeny.
Data from all sires were then subjected to variance component estimation procedures. The phenotypic data, along with the pedigrees, were used to calculate estimated breeding values (EBVs) for muscle depth. The proportions of genes identical-by-descent (IBD) between all individuals at the QTL location were then estimated using a deterministic method (Pong-Wong et al., Reference Pong-Wong, George, Woolliams and Haley2001). Combining the phenotypic information and marker data, the EBVs were then partitioned into background (polygenic) and QTL components using MA-BLUP (Fernando and Grossman, Reference Fernando and Grossman1989). Marker data were then used to define haplotypes present in the lamb population and, for each lamb, to identify paternal and maternal haplotypes. The QTL-EBVs were then further decomposed into the component inherited from the sire and the component inherited from the dam. The sire haplotypes were then matched to the sire QTL-EBV and, for the three sire families in which the QTL was believed to be segregating, the haplotypes linked to high QTL-EBVs were assigned TM-QTL carrier status, those linked with low QTL-EBVs were assigned non-carrier status and those linked with a medium or variable EBV were assigned an unclear status: ‘unknown’ genotype. Lambs from the family that appeared not to be segregating for the QTL were also defined as being of ‘unknown’ genotype.
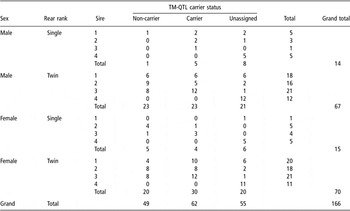
Of the 166 animals with live-animal and carcass measurements, 49 were classed as non-carriers, 62 classed as carriers and 55 were classed as having unknown TM-QTL carrier status, coming from a non-segregating sire or not having informative marker information. The number of lambs classified as carriers, non-carriers or unassigned within each sire, rearing rank and sex group are shown in Table 1. It should be noted that genotyping for the g + 6723G-A mutation in the Myostatin gene confirmed that all sires used in this study were homozygous for the ‘A’ allele and all their crossbred progeny carried a single copy (as Mule ewes were homozygous for the ‘G’ allele). Therefore, there were no differences in the frequency of this mutation between TM-QTL carrier and non-carrier lambs.
Classification of TM-QTL carrier status by sex, rearing type and sire for animals

TM-QTL = Texel muscling quantitative trait locus.
Statistical analysis
The data set analysed was restricted to those animals classified as either a carrier or a non-carrier. Animals for whom a genotype could not be determined with sufficient confidence (unknown or from families that were not clearly segregating) were removed from the data set. A general linear mixed model using the residual maximum likelihood procedure (REML) in GenStat 9 (2006) was fitted to determine the effect of TM-QTL genotype on ultrasound, CT and dissection measurements. Sire was fitted as a random effect, rearing rank, sex and TM-QTL carrier status fitted as fixed effects, and either live weight (for the in vivo measurements) or carcass weight (for measurements taken on the carcass) were fitted as a covariate where appropriate. No weight covariate was fitted for proportion variables or for carcass weight. Age at scanning or slaughter was also tested instead of live weight or carcass weight as a covariate but was not significant in most cases and thus only live weight or carcass weight was used as a covariate in the analyses.
Two- and three-way interactions between the fixed effects, and weight where appropriate, were also tested. Only for a few variables was there either a significant sex × rearing rank, sex × weight or sex × rearing rank × weight interaction, and there were no cases of significant interactions involving TM-QTL status. The sex × rearing rank interaction was significant for MLL muscle depth, LRMV, leg muscle width, HLMV and HLMI all as measured by CT scanning (all P < 0.05), and the dissected weight of fat in both the left loin and the right chump (P < 0.05). The sex × weight interaction was significant for weight of fat in the left leg-chump (P < 0.01), weight of ‘very lean’ trimmings in the right chump (P < 0.05). The sex × rearing rank weight interaction was significant for weight of fat in the left loin (P < 0.05), weight of fat in the right loin (P < 0.05), weight of meat yield in the left loin (P < 0.05) and weight of fat in the right carcass side (P < 0.01). In each case where interactions between sex and rearing rank, sex and weight, or sex, rearing rank and weight were significant, the effects on the TM-QTL status significance level and predicted means were negligible. Therefore these interactions were ignored in reporting the results to aid clarity. Least-square means (LSM) for carriers and non-carriers of the TM-QTL and standard errors of the difference (s.e.d.) between these groups were generated for each trait of interest.
The model used is shown below:

where yi is the variable of interest for lamb i (i = 1, 2, 3, …, 111) of TM-QTL genotype t (j = carrier or non-carrier) and sex s (k = female or castrate male), reared as r (l = single or twin) and sired by sire f (m = sire 1, sire 2, sire 3) and, if appropriate, with live weight or carcass weight w, and the interaction between sex and rearing rank (sk*rl). The intercept is a and the error is ε.
Results
Muscling characteristics
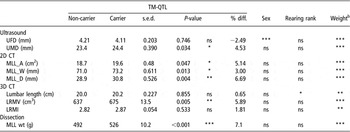
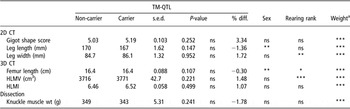
Table 2 shows the effects of TM-QTL carrier status, rearing rank and sex on the various measurements of loin muscling and muscularity. Depth of the MLL measured by ultrasound scanning at the third lumbar vertebra (UMD) was +4.5% greater in TM-QTL carrier lambs compared to non-carriers (P < 0.05). This effect was confirmed by CT measurements of MLL depth (MLL_D) at the fifth lumbar vertebra (carriers +6.7% greater muscle depth than non-carriers; P < 0.01). CT measurements of MLL width (MLL_W) and area (MLL_A) were also slightly greater in TM-QTL carrier lambs compared to non-carriers (+3.0%; P < 0.05 and +5.1%; P < 0.05, respectively). 3D measurements taken in the loin region using CT scanning showed that LRMV was +5.9% greater in TM-QTL carriers compared to non-carriers (P < 0.01; Table 2). Lumbar length was similar between the two groups but the loin region muscularity index (LRMI) was only +1.8% higher in carriers compared to non-carriers, which was not statistically significant (Table 2). The average dissected weight of the left and right MLL (MLL wt) was +7.1% heavier in TM-QTL carriers compared to non-carriers (P < 0.001; Table 2). CT and dissection results from the hind leg region showed no significant effect of the TM-QTL (Table 3).
Least-square means and standard errors for the difference (s.e.d.) for TM-QTL carrier status for ultrasound, CT and dissection measurements in the loin regionFootnote a (percentage difference of TM-QTL carrier v. non-carrier is also shown for each variable)

TM-QTL = Texel muscling quantitative trait locus; CT = computed tomography.
a UMD is ultrasonically measured muscle depth and UFD is ultrasonically measured fat depth. MLL_A, MLL_W and MLL_D are area, width and depth, respectively, of the M. longissimus lumborum measured using CT scanning. LRMV is loin region muscle volume and LRMI is loin region muscularity index measured using spiral CT scanning and MLL wt is the average weight of the left and right M. longissimus lumborum.
b Weight covariate was either live weight (average 39.5 kg) for ultrasound and CT measurements or carcass weight (average 18.3 kg) for dissected MLL weight.
Least-square means and s.e.d. for TM-QTL carrier status for two- (2D) and three-dimensional (3D) CT scanning measurements taken on the hind leg region for muscularity and average weight of the right and left hind leg knuckle muscles measured by dissection

TM-QTL = Texel muscling quantitative trait locus; CT = computed tomography; HLMV = hind leg muscle volume; HLMI = hind leg muscularity index.
aWeight covariate was either live weight (average 39.5 kg) for ultrasound and CT measurements or carcass weight (average 18.3 kg) for dissected knuckle muscle weight.
Carcass and joint weights and composition
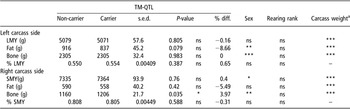
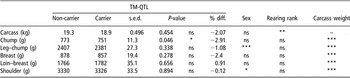
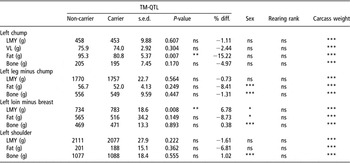
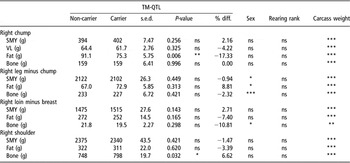
Most carcass composition traits measured by dissection were not significantly different between carriers and non-carriers (Table 4). Fat weight, although not significantly different between carriers and non-carriers, was consistently lower in carriers (Table 4). There were no significant differences in live weight (carriers 39.75 kg v. non-carriers 40.65 kg; s.e.d. 0.805 kg) or carcass weight (Table 5) between TM-QTL carriers and non-carriers, and the only significant difference in joint weights adjusted for carcass weight was in the chump joint, with carriers having a lower chump joint weight compared to non-carriers (−2.9%; P < 0.05). TM-QTL carriers had more LMY in the loin joint (734 v. 783 g; s.e.d. 18.6 g; P < 0.05; Table 6) but a significant difference was not seen when comparing carriers with non-carriers on the basis of SMY in the loin joint (1475 v. 1515 g; s.e.d. 27.6 g; P = 0.143; Table 7). The different butchery techniques employed for the right and left carcass sides probably explain why similar effects were not found on both carcass sides. TM-QTL carriers also had a lower proportion of fat in both left and right chump joints than non-carriers (P < 0.05; Tables 6 and 7).
Least-square means and s.e.d. for TM-QTL carriers and non-carriers for weightsFootnote a of lean meat yield (LMY), fat and bone measured by dissection of the left carcass sides, proportion of left carcass side that was LMY (% LMY), and weightsFootnote a of saleable meat yield (SMY), fat and bone measured by dissection of the right carcass sides and proportion of right carcass side that was SMY (% SMY)

TM-QTL = Texel muscling quantitative trait locus.
a Carcass weight was fitted as a co-variate (average 18.3 kg).
Least-square means and s.e.d. for TM-QTL carriers and non-carriers for carcass weight and average weight of chump, leg minus chump, breast, loin minus breast and shoulder joints from the left and right carcass sidesFootnote a

TM-QTL = Texel muscling quantitative trait locus.
a Model for joint weights included carcass weight as a covariate.
Least-square means, s.e.d. and percent difference for TM-QTL carriers and non-carriers for weight of lean meat yield (LMY), very lean meat trim (VL), fat and bone in the dissected joints from the left carcass side (all weights are adjusted to a common carcass weight (18.3 kg))

TM-QTL = Texel muscling quantitative trait locus.
Least-square means, s.e.d. and percent difference for TM-QTL carriers and non-carriers for weight for weight of saleable meat yield (SMY), very lean meat trim (VL), fat and bone in the joints from the right carcass side butchered to supermarket specification (all weights are adjusted to a common carcass weight (18.3 kg))

TM-QTL = Texel muscling quantitative trait locus.
LMY and SMY distribution
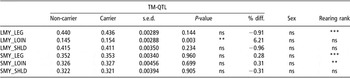
Proportion of the total carcass LMY that was contained within the loin joint was significantly higher in TM-QTL carriers than in non-carriers (0.154 v. 0.145; P < 0.01; Table 8), but this difference, together with the small proportion of the carcass accounted for by the loin, was too small to have a significant effect on the proportion of the LMY that was held in the other two regions. Distribution of SMY was not affected by TM-QTL carrier status.
Least-square means and s.e.d. for TM-QTL carriers and non-carriers for proportion of the total lean meat yield (LMY) from the left side of the carcass, and proportion of the total saleable meat yield (SMY) from the right side of the carcass, contained within the leg, loin and shoulder regions

TM-QTL = Texel muscling quantitative trait locus.
Discussion
Walling et al. (Reference Walling, Visscher, Wilson, McTeir, Simm and Bishop2004) reported that commercial Texel sheep carrying a single copy of TM-QTL had 1.15 to 2.00 mm (4% to 7%) greater ultrasound muscle depth compared to non-carriers (average muscle depth of 28.7 mm, s.d. 3.28 mm). In the different genetic background of the crossbred lambs studied here, TM-QTL conferred a +4% increase in ultrasound muscle depth at the third lumbar vertebra (+1 mm; average muscle depth 24.1 mm, s.d. 2.45 mm), indicating that a single copy of TM-QTL produces a similar relative effect on loin muscle depth in both Texel and crossbred lambs.
The difference between carriers and non-carriers of TM-QTL was larger and even more significant when measured using CT. It should be noted that muscle depth measured using CT scanning was greater than that measured by ultrasound, which could be due to both the use of a slightly different measurement site (fifth v. third lumbar vertebra) and CT providing a clearer image and more precise measurement than ultrasound.
Walling et al. (Reference Walling, Visscher, Wilson, McTeir, Simm and Bishop2004) concluded that the primary effect of the TM-QTL was likely to be on muscle shape since the significance of the effect was stronger when adjusted for live weight. Using CT scanning it is possible to obtain accurate measures of loin muscle shape using both 2D measurements on a cross-sectional scan (Jones et al., Reference Jones, Lewis, Young and Wolf2002) and spiral scanning to produce 3D measurements of muscle volume (Navajas et al., Reference Navajas, Lambe, McLean, Glasbey, Fisher, Charteris, Bunger and Simm2007). These techniques confirmed that the effect of TM-QTL was on muscle shape, with the greatest effect on loin muscle characteristics being on muscle depth. Effects of TM-QTL on muscle width, area and volume were also significant but smaller in magnitude. Length of the loin region was not affected by the TM-QTL, so the increase in the dissected weight of the MLL, which had the largest effect of the TM-QTL on the loin region (+7.1%), can be attributed to the increase in depth and width of the MLL rather than to increased muscle length. This will impact on the shape of chops cut from the loin, which can influence the attractiveness to consumers, who tend to prefer plump leg joints and large round chops (Laville et al., Reference Laville, Bouix, Sayd, Bine, Elsen, Larzul, Eychenne, Marcq and Georges2004).
The loin region muscularity index for animals in this study was approximately 2.8 units, which is intermediate to the values reported for Texel (3.16 units) and Scottish Blackface (2.66 units) lambs in the study where this index was first described (Navajas et al., Reference Navajas, Lambe, McLean, Glasbey, Fisher, Charteris, Bunger and Simm2007). However, the average value for the hind leg muscularity index for lambs in this study (6.5 units) was closer to that reported for Scottish Blackface (6.79 units) than that for Texel (8.06 units) (Navajas et al., Reference Navajas, Lambe, McLean, Glasbey, Fisher, Charteris, Bunger and Simm2007). The differences in these values may relate either to the lambs in this study having longer bone lengths and/or lower muscle volumes since the lambs were of a different breed type and were also on average heavier (average carcass weight 19.1 v. 14.4 kg for Scottish Blackface and 17.1 kg for Texel).
TM-QTL effects are predominantly localised in the loin region, indicating that carriers have increased muscle weight in the loin, the highest value part of the carcass. There were no significant effects of TM-QTL on muscularity in the hind leg, carcass weight, total carcass LMY, SMY or joint weights, except that carriers had lighter chump joints. However, the weight of LMY in the loin joint (adjusted to equal carcass weight) was slightly higher in TM-QTL carriers and the proportion of the total LMY in the carcass that was contained in the loin region was also slightly higher in TM-QTL carriers. The only consistently significant effects of TM-QTL outwith the loin region were that TM-QTL carriers had lighter chump joints and less fat in the chump joint than non-carriers at equal carcass weights. Overall, carcass fat content tended to be lower in TM-QTL carriers although differences were seldom significant. Weight and distribution of SMY was not affected by TM-QTL genotype. SMY is a trait of major importance for meat processors and producers. This result suggests that the benefit of a single copy of TM-QTL in increased loin muscle weight may not be sufficiently large to provide an economic advantage to the lamb producer, in terms of significant differences in SMY. However, processors and retailers are likely to benefit from an increased weight of lean meat (LMY) in the high-priced loin cut, whilst consumers are likely to benefit with greater chop width and depth, as noted above, which may in turn lead to better consumer satisfaction and more repeat purchases. Determining an appropriate reward for producers for breeding animals that carry TM-QTL, and thus provide benefits to those further down the processing chain, is important and would need to be addressed should the sheep industry as a whole value the advantages TM-QTL can offer.
Several other genes and QTL affecting muscle traits in sheep have been identified. QTL for increased muscling and decreased fat have been reported on chromosome 2 in both Belgian Texels (Marcq et al., 2002; Laville et al., Reference Laville, Bouix, Sayd, Bine, Elsen, Larzul, Eychenne, Marcq and Georges2004) and New Zealand Texels (Broad et al., Reference Broad, Glass, Greer, Robertson, Bain, Lord, McEwan and Peterson2000; Johnson et al., Reference Johnson, McEwan, Dodds, Purchas and Blair2005). In Belgian Texels it was reported that a single G to A transition in the 3′ untranslated region of the Myostatin gene was responsible for the QTL effect (Clop et al., Reference Clop, Marcq, Takeda, Pirottin, Tordoir, Bibe, Bouix, Caiment, Elsen, Eychenne, Larzul, Laville, Meish, Milenkovic, Tobin, Charlier and Georges2006). The same mutation has been identified in both Australian and New Zealand Texels, where it was also associated with significant effects on muscling and fatness (Kijas et al., Reference Kijas, McCulloch, Edwards, Oddy, Lee and van der Werf2007; Bain et al., Reference Bain, Johnson, Greer, Dodds, McLean, McLaren, Galloway, van Stijn and McEwan2008).
The myostatin mutation is thought to be widespread in UK Texels and genotyping confirmed that all Texel sires used in this study were homozygous for the ‘A’ allele, passing on a single copy to all their progeny who were, as a result, heterozygous for this allele. The Texel is a muscular breed and it is therefore likely that many mutations affecting muscling are fixed or at high frequencies. In contrast, the TM-QTL has only been found to segregate in a small proportion of the sire families studied by Walling et al. (Reference Walling, Visscher, Wilson, McTeir, Simm and Bishop2004) and Matika et al. (2006), suggesting that it is either not widespread within the industry population of purebred UK Texel or possibly approaching fixation. If it is currently at a low frequency, and assuming that the UK sheep industry values the benefits of TM-QTL on loin muscle traits, then selecting for it is likely to offer greater potential benefit to the UK sheep industry than the above-mentioned myostatin mutation, which is already largely fixed within the Texel population.
Two other genes/QTL affecting muscling in sheep have been found in the same region of chromosome 18 in which TM-QTL resides: the Callipyge gene and the Carwell QTL. Callipyge displays a complex mode of inheritance with both paternal imprinting and polar overdominance (Georges and Cockett, Reference Georges and Cockett1996). Animals inheriting a single, paternal copy of Callipyge exhibit increased pelvic and torso muscle weights (up to 46%), reduced fatness (on average back fat depth is reduced by 26% in animals displaying the Callipyge phenotype), increased M. longissimus dorsi area (~30%) and increased leg score (Jackson et al., Reference Jackson, Miller and Green1997a and Reference Jackson, Miller and Green1997b), although the meat is significantly less tender (Koohmaraie et al., Reference Koohmaraie, Shackelford, Wheeler, Lonergan and Doumit1995; Duckett et al., Reference Duckett, Snowder and Cockett2000). The mutation underlying Callipyge is a single A to G transition approximately 32 kb upstream of the GTL2 gene, and appears to affect the expression of a closely linked cluster of imprinted genes (Freking et al., Reference Freking, Murphy, Wylie, Rhodes, Keele, Leymaster, Jirtle and Smith2002; Smit et al., Reference Smit, Segers, Carrascosa, Shay, Baraldi, Gyapay, Snowder, Georges, Cockett and Charlier2003). We have previously confirmed that the Callipyge mutation was not present in sires carrying the TM-QTL (unpublished results).
The Carwell QTL, identified in Australian Poll Dorsets, has a more moderate effect, increasing the area and weight of the M. longissimus dorsi by 11% and 7%, respectively (Banks, Reference Banks1997; Nicoll et al., Reference Nicoll, Burkin, Broad, Jopson, Greer, Bain, Wright, Dodds, Fennessy and McEwan1998). It has minor negative impacts on tenderness, which can be removed by appropriate post-slaughter treatment (Jopson et al., Reference Jopson, Nicoll, Stevenson-Barry, Duncan, Greer, Bain, Gerard, Glass, Broad and McEwan2001). TM-QTL effects and estimated position (~2 cM telomeric of marker CSSM18 (Walling et al., Reference Walling, Visscher, Wilson, McTeir, Simm and Bishop2004)) are similar to those of the Carwell QTL, which is reported to be between 2 and 6 cM telomeric of marker CSSM18 (Nicoll et al., Reference Nicoll, Burkin, Broad, Jopson, Greer, Bain, Wright, Dodds, Fennessy and McEwan1998). It is therefore possible that TM-QTL is allelic to the Carwell gene. Large-scale industry trials confirmed and validated the effect of Carwell (Campbell and McLaren, Reference Campbell and McLaren2007).
Callipyge and Carwell both demonstrate that genes/QTL affecting muscle growth in sheep can have a range of pleiotropic effects on meat quality. In cattle, a mutation in the myostatin gene that causes double-muscling also reduces intramuscular fatness but improves tenderness, and in addition has negative impacts on fertility, dystocia and calf survival (review by Arthur, Reference Arthur1995). It is important that information is available on the indirect effects of a single copy of TM-QTL on both meat quality (e.g. tenderness, intramuscular fat) and animal health and welfare (e.g. lambing difficulties, lamb survival) before optimal recommendations can be made for the use of TM-QTL in the UK sheep industry.
TM-QTL could offer potential to the UK sheep industry to increase the LMY of the high-valued loin region. However, if the UK sheep industry values the benefits TM-QTL can provide, some consideration is required of whether genotyping commercial breeding animals for TM-QTL would be necessary to realise such benefits or whether the effects of TM-QTL could be selected for within conventional quantitative genetic breeding programmes. Currently many of the performance-recorded UK Texels are selected based on a lean tissue growth index that aims to increase lean weight with little or no associated increase in carcass fatness (Simm and Dingwall, Reference Simm and Dingwall1989) using live weight, ultrasound muscle and fat depths and total carcass lean and fat weights measured by CT. It is likely that such an index would favour carriers of the TM-QTL due to the effect of TM-QTL on muscle depth, although not with complete accuracy. Selection on the TM-QTL genotype alongside such an index might increase response in loin muscle traits. Selection for a specific muscularity index (e.g. Navajas et al., Reference Navajas, Lambe, McLean, Glasbey, Fisher, Charteris, Bunger and Simm2007) may be more likely to encompass the variation provided by TM-QTL and favour TM-QTL carriers and thus negate the need for genotyping, although in this study the loin region muscularity index was not significantly greater in TM-QTL carriers compared to non-carriers.
Results on double-muscling in cattle and mice show that an initial moderate effect of a muscle growth-enhancing gene/QTL (e.g. Arnold et al., Reference Arnold, Della-Fera and Baile2001; Bünger et al., Reference Bünger, Ott, Varga, Schlote, Rehfeldt, Renne, Williams and Hill2004) can be enhanced due to epistatic effects if it is given greater emphasis in selection. By increasing selection pressure on muscle traits, the frequency of alleles at epistatic loci would likely be changed in a favourable direction, thereby enhancing the original effect of the QTL/gene of interest. As such, it is important that quantitative genetic selection be continued, even if genotyping for TM-QTL is implemented in the UK sheep industry to increase loin meat yield.
Conclusions
This study has shown that TM-QTL has small positive effects on loin muscle traits (+3% to +7%) and thus increases yield of the high-value loin muscle in crossbred lambs. Before the benefits of TM-QTL can be exploited by the UK commercial sheep industry, it will be important to give consideration to (i) the effects of TM-QTL on meat quality and animal health and welfare, (ii) the effects of TM-QTL on the background of other commonly used ewe breeds and crosses and (iii) how best to incorporate TM-QTL within existing breeding programmes.
Acknowledgements
Financial support of BBSRC (project no. BB/E018963/1) and Defra for this research through the LINK Sustainable Livestock Production programme (project no. LK0670) is gratefully acknowledged. We wish to thank our industry sponsors and project partners: EBLEX, HCC, QMS, LMCNI, Catapult Genetics, Innovis Genetics Ltd, Welsh Country Foods, EplusV/Germany, ASDA stores, SAMW, Suffolk Sire Referencing Scheme Ltd, British Texel Sheep Society Ltd, and Charollais Sire Reference Scheme. Thanks are also extended to Tracy van Stijn and Fiona Sanggang at the AgResearch Molecular Biology Unit in Dunedin, New Zealand, who carried out all TM-QTL marker genotyping. We are grateful for the technical contributions of SAC colleagues: Laura Nicoll, Claire Anderson, Mark Ramsay, Elizabeth Goodenough, John Gordon, Joanne Donbavand, Ruth Turl and Jack FitzSimons. E. Rius-Vilarrasa’s PhD studentship was funded by MLC. SAC receives financial support from the Scottish Government Rural and Environment Research and Analysis Directorate (RERAD).