




Key take home
-
• The existence of physical infrastructures for delivering PHC in Bangladesh is paralleled by reasonable accessibility; however, the availability of services is still poor in a region with lower health outcomes.
-
• As per consumer perceptions, diagnostics top the list of unavailable services, followed by HE-HP, basic emergency, essential drug supply, and proper referral.
-
• There is a large proportion (around 50%) drop-out in the process of availing the advised diagnostic services outside the PHCFs, and 24% are reported to be directly referred from PHCFs to private facilities.
-
• Around a quarter of health service consumers visit private health care facilities on direct referral from the PHCFs.
-
• Different degrees of disparities exist in the availability of PHC services, and gender, as well as location and socioeconomic status, are important factors modulating the availability and accessibility of PHC services.
-
• Female gender, rural location and poorer socioeconomic status contribute towards inequities in service availability, and the same factors contribute to inequities in accessibility, except that urban consumers have relatively poor access as compared to rural ones.
Introduction
Primary Health Care (PHC) is now well recognized as the base of a strong and fair health system, and this is considered to be central in achieving Universal Health Coverage (UHC) as well as the health-related Sustainable Development Goal 3 (Chotchoungchatchai et al., Reference Chotchoungchatchai, Marshall, Witthayapipopsakul, Panichkriangkrai, Patcharanarumol and Tangcharoensathien2020). Traditionally, it has several components like availability, accessibility, quality and finance (WHO, 2018; Kruk et al., Reference Kruk, Gage, Arsenault, Jordan, Leslie, Roder-DeWan and Pate2018; Penchansky and Thomas, Reference Penchansky and Thomas1981; Primary Care Collaborative, 2023; The Lancet Regional Health – Southeast Asia, 2025).
Overall, PHC focuses on needed health care that is universal and accessible, encouraging intersectoral action and social justice in addition to community participation as guiding values (Starfield, Reference Starfield1994; WHO, 2021). Bangladesh has always remained committed to the implementation of the PHC-related principles and guidelines since the Alma-Ata Declaration (WHO, 1978) and the commitment has also been renewed recently through the signing of the Declaration of Astana (WHO and UNICEF, 2018) and endorsement of the South-East Asian Regional Primary Health Care Strategy (WHO-SEARO, 2022). In line with these commitments, Bangladesh adopted several initiatives to promote PHC in its national programmes (such as Health, Population and Nutrition Sector Program) which aimed at reinforcing the primary care infrastructure, expanding the scope of care coverage, and reducing the financial burden to access services (MoHFW, 2021). Nevertheless, gaps in the provision of PHC services have been shown to persist, which, in turn, create substantial barriers in the access and fair distribution of such services (Ahmed et al., 2015; WHO, 2015; Kruk et al., Reference Kruk, Gage, Arsenault, Jordan, Leslie, Roder-DeWan and Pate2018).
Updated data on the status and covariates of PHC, among diverse groups, is required for the planning of evidence-based reform in PHC services. A few important official reports, like the Bangladesh Health and Demographic Survey or BDHS (NIPORT and ICF, 2024) and Bangladesh Health Facility Survey or BHFS (NIPORT and icddr,b, 2024), are periodically published in Bangladesh, which generate valuable data on health service delivery on a national scale. The BDHS is a nationally representative, population-based household survey generating standardized health, demographic, and equity indicators at national and subnational levels. The BHFS, on the other hand, concentrates on the gaps in facility readiness such as the lack of trained health workers, essential medicines and diagnostic capacity, which may impact the patient experience and satisfaction in care. Highly useful elements of the availability and accessibility components of PHC can be extracted from these Reports. Those, however, are based mainly on physical surveys and perceptions of the targeted beneficiaries (the PHC service users) are not the primary focus in these surveys. Consumer perceptions offer a great understanding of the inner dynamics of a health system through the revelation of the feelings of the community as well as through the appreciation of whether the services are efficient in serving the needs of the population (Levesque et al., Reference Levesque, Harris and Russel2013; Russell et al., Reference Russell, Humphreys, Ward, Chisholm, Buykx, McGrail and Wakerman2013). Apart from official reports, a few studies (Adhikary et al., Reference Adhikary, Shawon, Ali, Shamsuzzaman, Ahmed, Shackelford, Woldeab, Alam, Lim, Levine, Gakidou and Uddin2018; Chowdhury et al., Reference Chowdhury, Islam, Rahman, Al Zabir, Khan, Azizi and Nurunnabi2023) have reported perceptions, attitudes and satisfaction of patients at PHC levels in Bangladesh. The studies, however, are not PHC facility-specific and it is difficult to discuss PHC-component-wise issues from their data.
Under the above context, the present study has been designed to explore the status and covariates of two of the basic components of PHC (availability and accessibility) among the people of a health-related low-performing area in Bangladesh, as viewed by the actual Consumers. Through segregated analysis based on gender, demography, and socioeconomic status, an attempt has also been made in the study to explore the factors affecting equity and social justice within the community under study. The consumer-perception-based information may play a complementary role to the national reports on health service delivery in Bangladesh.
Methods
Design, setting and population
-
Design: A cross-sectional observational study was conducted in the Moulvibazar district, located in a northeastern area of Bangladesh.
-
Setting : The area was chosen from the list of districts with average and below average human development as suggested in the Human Development Index (HDI, 2023). From the list, districts with a higher than the national average of both maternal mortality ratio or MMR and neonatal mortality rate or NMR (DGHS, 2023) were selected first. These indicators are often viewed as accurate measures of the efficacy, fairness and equity of any healthcare system anywhere in the world (Liang et al., Reference Liang, Kornas, Bornbaum, Shuldiner, De Prophetis, Buajitti, Pach and Rosella2023). From this second list, the Moulvibazar district was chosen by lottery method. The district has 7 Upazillas; among those 4 Upazillas (Kamolganj, Kulaura, Juri and Barlekha) were selected on a convenience basis (Figure 1). In addition to the 4 Upazilla Health Complexes (UzHCs), 2 Union Health Centers (UHCs) and 2 Community Clinics (CCs) from each Upazilla were selected by convenience sampling technique (Adhikari et al., Reference Adhikari, Paneru and Pokhrel2024; Peoples et al., Reference Peoples, Gong, Gautam, Khanal, Kohrt, Koirala, Amatya, Xiong, Østbye, Moe, Long and Yan2021), and those were termed as PHC Facilities (PHCFs).
-
Population : Adult patients or accompanying persons (male or female), aged ≥18 years, attending the above-mentioned PHC facilities, were the target population in this study and they were termed as health care consumers (HCCs). When enrolling an accompanying person in the study, it was ensured (by asking) that they are from the same locality, do not belong to the same family unit (not eating from the same cooking pot), and a user of the PHCF where the interview has been taken.
-
Sample size and sampling technique: With a plan to explore the confounder-adjusted associations of the individual independent variables with the availability and accessibility scores, the sample size was calculated by the regression analysis-based formula (Green, Reference Green1991).
Location map of the PHC facilities under the study.

The equation is n = 50 + 8m, where ‘m’ is the number of independent variables. With 9 confounders in the current study (as mentioned in the conceptual design subsection), the calculated sample size was 122. To generate enough power during gender-, location-, and socioeconomic status-based analysis, the number was multiplied by 3 times and the derived number of 366 was rounded to 400. Representativeness of the study in similar jurisdictions with increased replicability was a major concern, and increasing statistical power was conceived as a tool for that.
The participants were purposively selected in all the PHCFs.
Variables and conceptual framework
The dependent and independent variables are mentioned below. The process of deriving the variables and their subcomponents is provided in the Supplementary File 1.
The dependent variables were the availability and accessibility scores (as elaborated in the next section)
-
• Service Availability Score (SRAvS)
-
• Service Accessibility Score (SRAcS)
The predictor or independent variables were as follows:
-
• Age
-
• Gender
-
• Education
-
• Occupation
-
• Marital status
-
• Rural–Urban residence
-
• Annual household income
-
• Per capita annual income
-
• PHCF level
Scoring of the availability and accessibility data
The availability and accessibility of the PHC services were planned to be scored, separately, on a scale of 0–100% based on several subcomponents adapted from the issues of the respective UHC components, as suggested by WHO-SEARO (2022). Each subcomponent was assigned a weightage (within a range of 0–10 points) as per its significance fixed by the average opinion of 5 independent Public Health Experts consulted through focused in-depth interviews. The process of deriving the Scores are provided in Supplementary File 2.
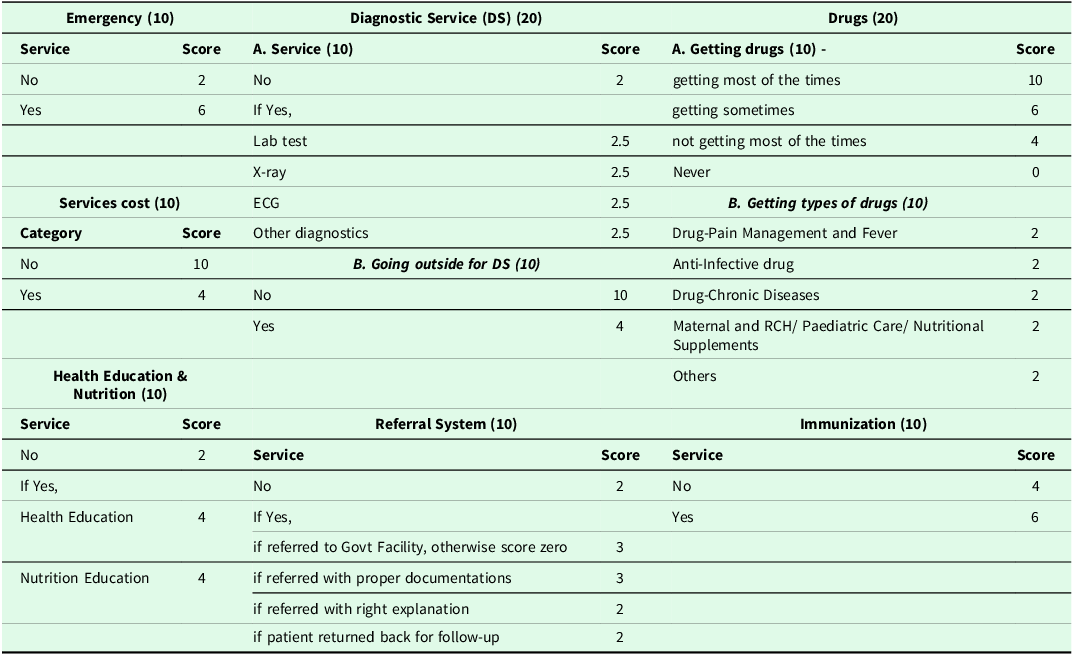
The different services included in the Self-reported Availability Score (SRAvS) were referral system, diagnostic, basic emergency, health and nutrition education, immunization facilities, essential drugs, and need for alternate providers beyond the facility (Table 1).
Subcomponents and their weightage in developing SRAvS

Table 1. Long description
The table is structured to show the different services included in the Self-reported Availability Score (SRAvS) and their respective weightage. It has multiple columns and rows detailing the scores and categories for each service. The services listed include Emergency, Diagnostic Service, Drugs, Health Education & Nutrition, Referral System, and Immunization. Each service is broken down into subcomponents with specific scores. For example, under Emergency, there are categories for Service and Services cost, with scores ranging from 2 to 10. Diagnostic Service is divided into A. Service, B. Going outside for DS, and includes subcategories like Lab test, X-ray, and ECG, with scores ranging from 2 to 10. The Drugs section is split into A. Getting drugs and B. Getting types of drugs, with scores ranging from 0 to 10. Health Education & Nutrition includes Health Education and Nutrition Education, each with a score of 4. The Referral System section details different scenarios with scores ranging from 2 to 3. Immunization is scored based on the availability of the service, with scores of 4 or 6. The table provides a comprehensive breakdown of the components and their weightage in developing the SRAvS.
SRAvS, Self-Reported Availability Score; developed by desk review and finalized by experts opinion.
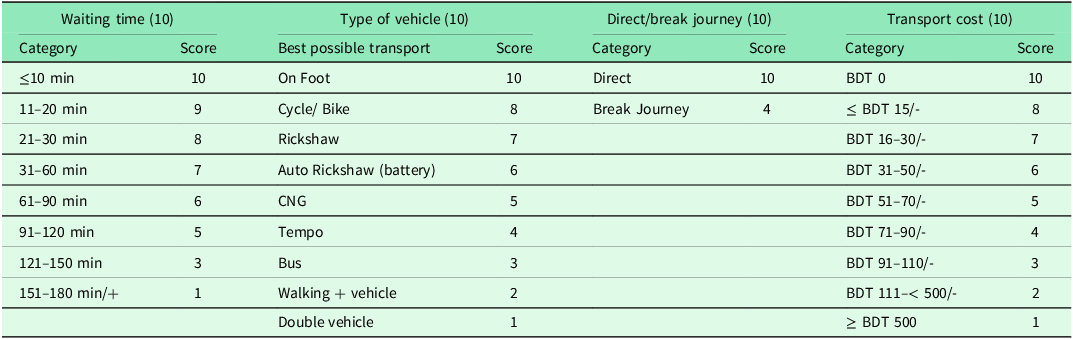
A technique, similar to that used for scoring SRAvS, was used to estimate the Self-reported Accessibility Score (SRAcS), where the subcomponents were travel time, use of vehicle, type of vehicle, direct or break journey, and transport cost (Table 2).
Subcomponents and their weightage in developing SRAcS

Table 2. Long description
A table comparing subcomponents and their weightage in developing SRAcS. The table has four columns: Waiting time, Type of vehicle, Direct/break journey, and Transport cost, each with a score out of 10. The rows list categories and scores for each subcomponent. Row 1: Waiting time, Category: <=10 min, Score: 10; Type of vehicle, Best possible transport: On Foot, Score: 10; Direct/break journey, Category: Direct, Score: 10; Transport cost, Category: BDT 0, Score: 10. Row 2: Waiting time, Category: 11-20 min, Score: 9; Type of vehicle, Best possible transport: Cycle/Bike, Score: 8; Direct/break journey, Category: Break Journey, Score: 4; Transport cost, Category: <= BDT 15, Score: 8. Row 3: Waiting time, Category: 21-30 min, Score: 8; Type of vehicle, Best possible transport: Rickshaw, Score: 7; Direct/break journey, Category: N/A, Score: N/A; Transport cost, Category: BDT 16-30, Score: 7. Row 4: Waiting time, Category: 31-60 min, Score: 7; Type of vehicle, Best possible transport: Auto Rickshaw (battery), Score: 6; Direct/break journey, Category: N/A, Score: N/A; Transport cost, Category: BDT 31-50, Score: 6. Row 5: Waiting time, Category: 61-90 min, Score: 6; Type of vehicle, Best possible transport: CNG, Score: 5; Direct/break journey, Category: N/A, Score: N/A; Transport cost, Category: BDT 51-70, Score: 5. Row 6: Waiting time, Category: 91-120 min, Score: 5; Type of vehicle, Best possible transport: Tempo, Score: 4; Direct/break journey, Category: N/A, Score: N/A; Transport cost, Category: BDT 71-90, Score: 4. Row 7: Waiting time, Category: 121-150 min, Score: 3; Type of vehicle, Best possible transport: Bus, Score: 3; Direct/break journey, Category: N/A, Score: N/A; Transport cost, Category: BDT 91-110, Score: 3. Row 8: Waiting time, Category: 151-180 min, Score: 1; Type of vehicle, Best possible transport: Walking + vehicle, Score: 2; Direct/break journey, Category: N/A, Score: N/A; Transport cost, Category: BDT 111-< 500, Score: 2. Row 9: Waiting time, Category: N/A, Score: N/A; Type of vehicle, Best possible transport: Double vehicle, Score: 1; Direct/break journey, Category: N/A, Score: N/A; Transport cost, Category: >= BDT 500, Score: 1.
SRAcS, Self-Reported Accessibility Score; developed by desk review and finalized by experts opinion.
Both for SRAvS and SRAcS, the sum of scores from the subcomponents was the total score (expressed as %) of the respective component.
Data collection
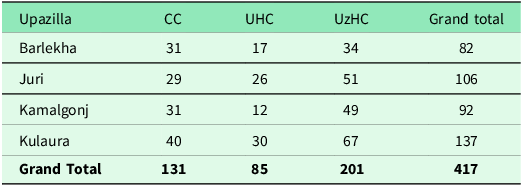
The total number of HCCs participating in the study was 417. Their distribution by individual UzHCs, UHCs and CCs is shown in Table 3.
Distribution of the HCCs by UzHCs, HCCs and CCs in different Upazillas of Moulvibazar District (n = 417)

Table 3. Long description
The table presents the distribution of HCCs by UzHCs, UHCs, and CCs in different Upazillas of Moulvibazar District. It consists of 5 rows and 5 columns, including the header row. The columns are labeled Upazilla, CC, UHC, UzHC, and Grand total. The rows list the Upazillas: Barlekha, Juri, Kamalgonj, Kulaura, and Grand Total. The values in the table are as follows: Row 1: Barlekha, 31, 17, 34, 82. Row 2: Juri, 29, 26, 51, 106. Row 3: Kamalgonj, 31, 12, 49, 92. Row 4: Kulaura, 40, 30, 67, 137. Row 5: Grand Total, 131, 85, 201, 417. The table shows the total number of HCCs participating in the study, distributed by individual UzHCs, UHCs, and CCs in different Upazillas of Moulvibazar District.
UzHC-Upazila Health Complex; UHC-Union Health Centers; HCC-Heath Care Consumer and CC-Community Clinic.
Data were collected by face-to-face interviews by trained data collectors using a pretested semistructured questionnaire. During the training and pretesting sessions, the Interviewers were cautioned regarding the difficulty in remembering some facts, especially by the elderly participants. Accordingly, they were trained to repeat the questions with some pertinent threads. In case of any suspicion about the capacity of the participant to remember, help from the Accompanying Persons was sought. Confusion/ incompleteness remained even after this step in some cases; further clarification/ confirmation was then tried to be made by calling a responsible family member of the Participant (multiple phone numbers were recorded in the Data Collection Form). The interviews were conducted both at out-patient and in-patient settings at the facilities.
Data collection instruments
The questionnaire covered sociodemographic information and subcomponent-related perceptions as relevant to the availability and accessibility components of PHC services.
Data analysis
The data were computed in the Windows-based SPSS software (IBM Corp., 2019). IBM SPSS Statistics for Windows, Version 26.0. Armonk, NY: IBM Corp) and the descriptive values were expressed as frequency and percentages, or as median and range. Comparisons between male–female, urban–rural and InQ groups were done by using the Mann–Whitney U test. Associations between two variables were further explored using Spearman correlation analysis. The independent association of selected individual independent variables with the dependent variables was explored by using linear regression, adjusting for the effects of the confounders. A significance level of p ≤ 0.05 was taken to be statistically significant.
Results
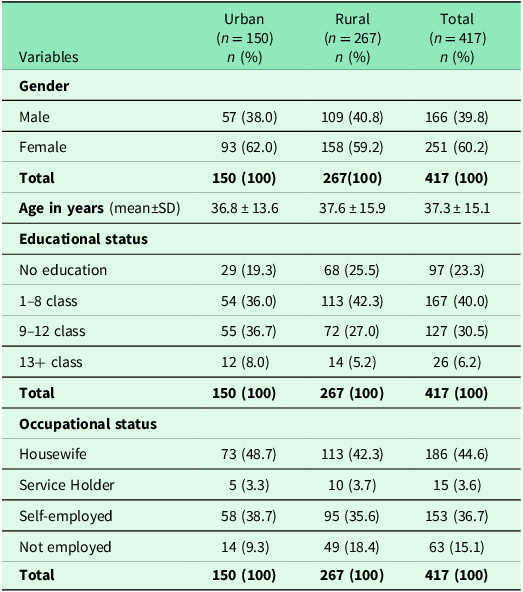
The present observational study was designed to explore consumer perception on the availability and accessibility of services at the PHC-level facilities in Moulvibazar district of Bangladesh. A total of 417 HCCs participated in the study (Table 4) and most of them were middle-aged (age, years, M±SD, 37.3 ± 15.1). There were more females (60%) compared to males, and 64% of the participants were from rural areas. The majority of the females were housewives, and 15.1% of the total participants were unemployed. The distribution of age, gender, educational status and occupation were almost similar between urban and rural areas.
Sociodemographic profile of HCCs

Table 4. Long description
A table comparing sociodemographic profiles of healthcare consumers in urban and rural areas. The table has 12 rows and 7 columns. Column headers are Variables, Urban (n=150), Rural (n=267), and Total (n=417). Row labels include Gender, Age in years (mean±SD), Educational status, and Occupational status. Row 1: Gender, Male, Urban: 57 (38.0 percent), Rural: 109 (40.8 percent), Total: 166 (39.8 percent). Row 2: Gender, Female, Urban: 93 (62.0 percent), Rural: 158 (59.2 percent), Total: 251 (60.2 percent). Row 3: Total, Urban: 150 (100 percent), Rural: 267 (100 percent), Total: 417 (100 percent). Row 4: Age in years (mean±SD), Urban: 36.8 ± 13.6, Rural: 37.6 ± 15.9, Total: 37.3 ± 15.1. Row 5: Educational status, No education, Urban: 29 (19.3 percent), Rural: 68 (25.5 percent), Total: 97 (23.3 percent). Row 6: Educational status, 1–8 class, Urban: 54 (36.0 percent), Rural: 113 (42.3 percent), Total: 167 (40.0 percent). Row 7: Educational status, 9–12 class, Urban: 55 (36.7 percent), Rural: 72 (27.0 percent), Total: 127 (30.5 percent). Row 8: Educational status, 13+ class, Urban: 12 (8.0 percent), Rural: 14 (5.2 percent), Total: 26 (6.2 percent). Row 9: Total, Urban: 150 (100 percent), Rural: 267 (100 percent), Total: 417 (100 percent). Row 10: Occupational status, Housewife, Urban: 73 (48.7 percent), Rural: 113 (42.3 percent), Total: 186 (44.6 percent). Row 11: Occupational status, Service Holder, Urban: 5 (3.3 percent), Rural: 10 (3.7 percent), Total: 15 (3.6 percent). Row 12: Occupational status, Self-employed, Urban: 58 (38.7 percent), Rural: 95 (35.6 percent), Total: 153 (36.7 percent). Row 13: Occupational status, Not employed, Urban: 14 (9.3 percent), Rural: 49 (18.4 percent), Total: 63 (15.1 percent). Row 14: Total, Urban: 150 (100 percent), Rural: 267 (100 percent), Total: 417 (100 percent).
Under the present context of availability and accessibility, UzHCs and CCs were the most preferred facilities to receive PHC, as expressed by 43.9% and 31.4% of the HCCs, respectively (Figure 2).
Preferred facilities to receive PHC by the HCCs. CC, Community Clinic; UHC, Union Health Centre; UzHC, Upazilla Health Complex; DH, District Hospital.

Availability of PHC services
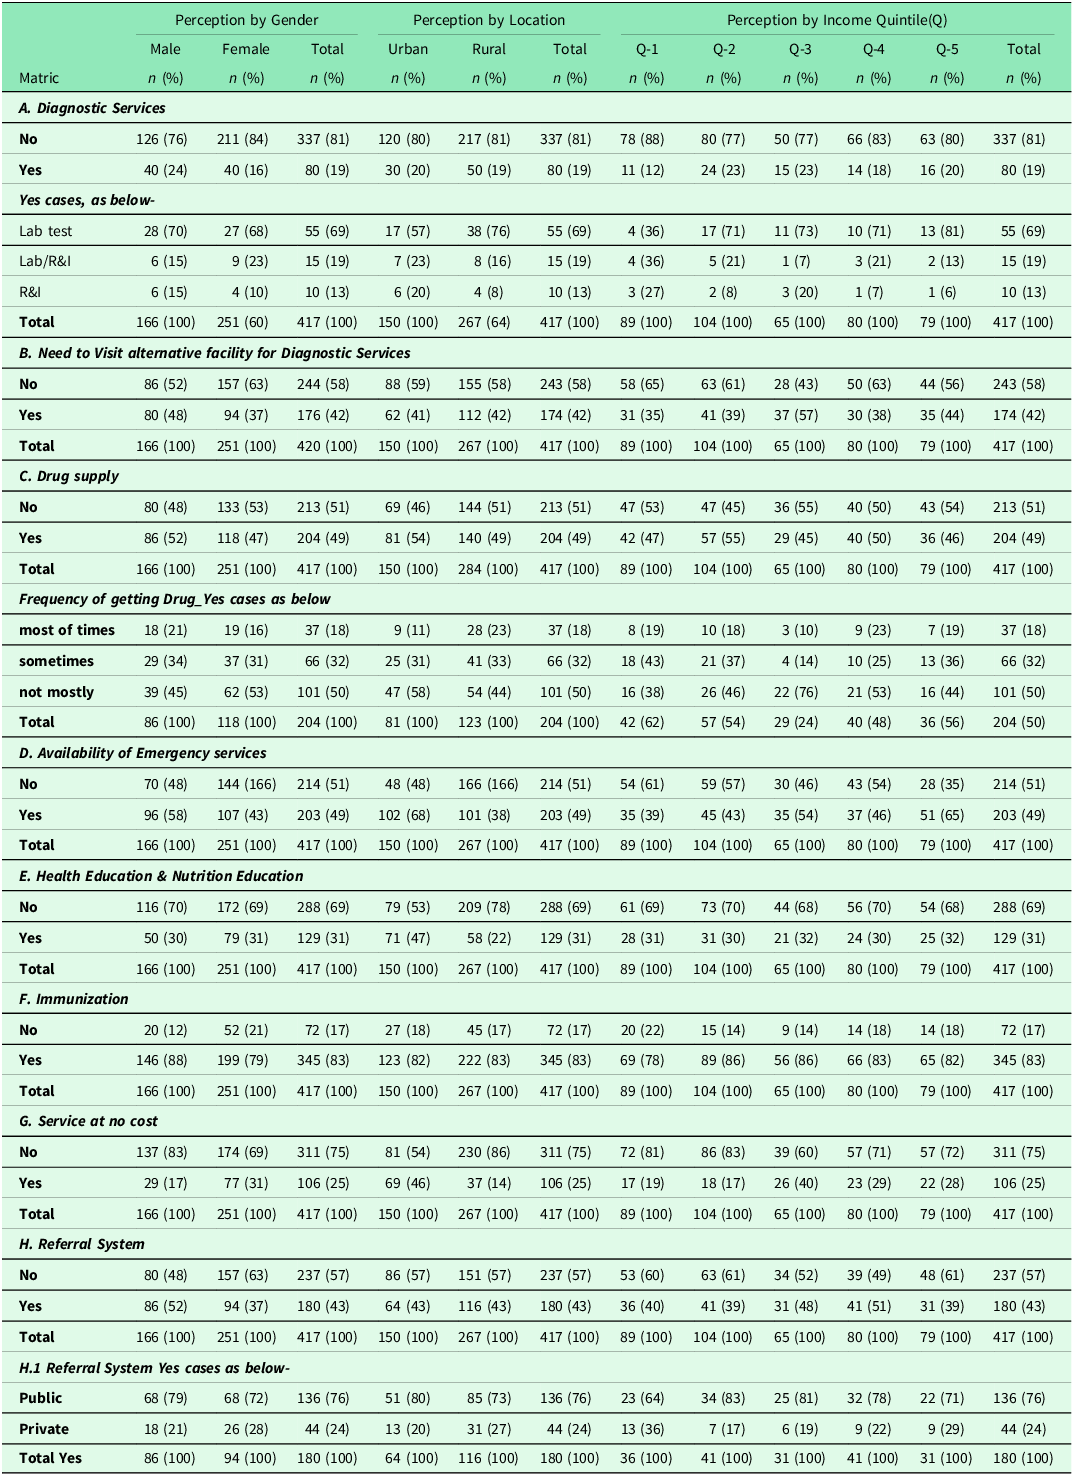
As shown in Table 5, only 19% of the total HCCs received diagnostic services; of them, 69% (ie,13% the total participants) reported the availability of laboratory (lab) tests, 13% (ie, 2% of the total participants) received radiology-imaging (RI) and 19% (ie, 4% of total participants) received combined lab-RI services. All the HCCs without diagnostic services could not afford alternate diagnostic facilities, as only 42% of them reported the visit to alternate ones. There was a large proportion (around 50%) of drop-outs in the process of availing the advised diagnostic services outside the PHCFs, and 24% were reported to be directly referred from PHCFs to private facilities.
Subcomponent-wise PHC service availability as per perceptions of HCCs by gender, location and income quintile (InQ)

Table 5. Long description
The table presents data on the perception of primary health care service availability, segmented by gender, location, and income quintile. It includes various metrics such as diagnostic services, need to visit alternative facilities, drug supply, availability of emergency services, health education and nutrition education, immunization, service at no cost, and referral system. The table has 10 columns: Perception by Gender (Male, Female, Total), Perception by Location (Urban, Rural, Total), and Perception by Income Quintile (Q1, Q2, Q3, Q4, Q5, Total). Each row represents a different metric and sub-metric, with percentages indicating the proportion of respondents. For example, under diagnostic services, 81% of the total respondents did not receive any diagnostic services, while 19% did. The table also breaks down the types of diagnostic services received, such as lab tests, radiology and imaging (RI), and combined lab-RI services. The need to visit alternative facilities is also analyzed, with 58% of respondents indicating no need and 42% indicating a need. The table further explores the frequency of drug supply, availability of emergency services, health education and nutrition education, immunization, service at no cost, and the referral system. Each metric is detailed with percentages for different segments, providing a comprehensive view of the perceptions across various demographics.
SRAvS, Self-Reported Availability Score; R&I, Radiology & Imaging.
Health and nutrition education were provided to only 31%, and basic emergency services (in UzHCs) were available to only 49% of the HCCs. In contrast, most of the HCCs (83%) reported the availability of immunization services.
Regarding the supply of drugs, only 49% of all the HCCs could ever get the prescribed drugs from the HCFs; among them, only 18% (ie, 9% of total) reported most-time availability and 50% (ie, 24.5% of total) reported unavailability most of the time.
Among the total HCCs, 25% reported the availability of ‘full-free’ services at the Facility.
All the factors, as stated above, led to the necessity of referral of a substantial proportion of patients (43%) to other facilities; among them, 24% were directly advised to visit private facilities.
Accessibility of PHC services
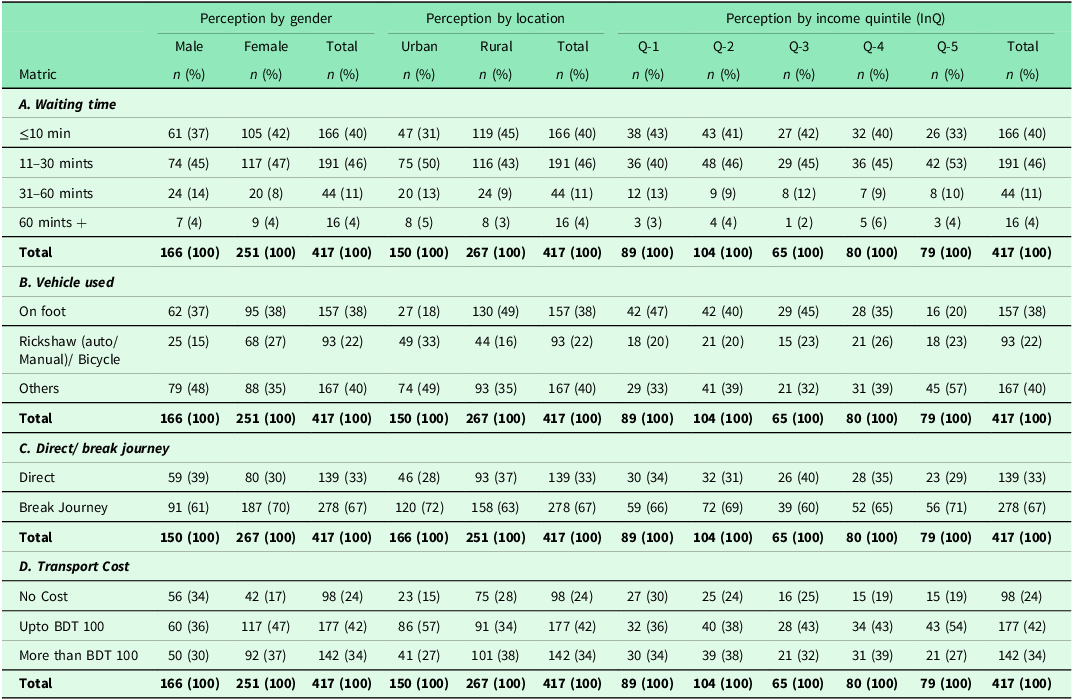
In contrast to availability, a fairly good proportion of the total participants reported that the services are accessible. Only a negligible proportion (4%) of the participants had to wait more than an hour and 60% could access a PHC facility by walking or by simple vehicles. Only one-third of the HCCs (34%) reported more than 0.9 US$ expenditure (up and down travel) to reach the facility, others had no cost or spent less than US$ 0.9 (Table 6).
Subcomponent-wise PHC service accessibility as per perceptions of HCCs by gender, location and income quintile (InQ)

Table 6. Long description
The table presents data on perceptions of primary healthcare service accessibility, broken down by gender, location, and income quintile. It includes four main sections: waiting time, vehicle used, direct/break journey, and transport cost. Each section is further divided into subcategories. The table has 4 rows and 13 columns. Column headers include Perception by gender, Perception by location, and Perception by income quintile (InQ). Row labels include categories such as waiting time, vehicle used, direct/break journey, and transport cost, with subcategories under each. The table captures the number and percentage of participants in each category. For example, under waiting time, 40 percent of participants waited 10 minutes or less, 46 percent waited 11 to 30 minutes, 11 percent waited 31 to 60 minutes, and 4 percent waited more than 60 minutes. The vehicle used section shows that 38 percent walked, 22 percent used a rickshaw or bicycle, and 40 percent used other means. The direct/break journey section indicates that 33 percent had a direct journey and 67 percent had a break in their journey. The transport cost section reveals that 24 percent incurred no cost, 42 percent spent up to 100 BDT, and 34 percent spent more than 100 BDT. The table provides a detailed breakdown of these perceptions across different demographics.
SRAcS, Self-Reported Accessibility Score.
Gender-, location-, and InQ-based factors affecting availability
As shown in Table 5, the proportion of females perceiving diagnostic service availability was less than that of their male counterparts (16% vs 24%). In contrast, the need to visit alternate facilities for diagnostic services was reported by a higher proportion of males as compared to females (48% vs 37%). The proportion of females reporting the availability of basic emergency services was also lower than the proportion of male participants (43% vs 58%).
Lower proportions of rural HCCs reported the availability Lab-RI (16%) and RI (only 8%) services as compared to the urban HCCs (23% and 20%, respectively) (Table 5). However, the needs to visit alternate centres were reported by almost similar proportion of participants (41% urban vs 42% rural). The perceived availability of health and nutrition education services by HCCs differed substantially between the two locations (47% in urban vs 22% in rural). Similar differences were observed when the perceptions about ‘services at no cost’ were explored. Only 14% HCCs reported absolutely ‘no-cost’ services in the rural locations, as compared to 46% in the urban ones.
The Income Quintile (InQ) Gr 1 reported the lowest availability of diagnostic services (12% of the HCCs) as compared to the higher InQs (20%). Also, ‘services at no cost’ was reported by a lower proportion (19% in InQ-1 and 17% in InQ-2) of HCCs as compared to InQ 3–5 (28–40%) HCCs.
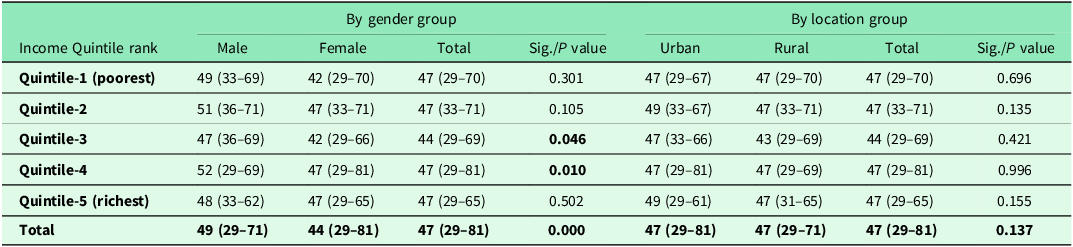
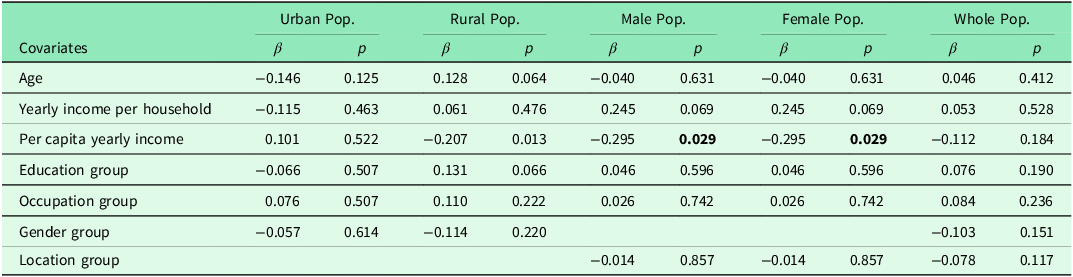
As shown in Table 7, the SRAvS values were consistently low among the total (median value, 42–52) as well as among the subgroup-based HCCs. On group comparison using the Mann–Whitney test, SRAvS did not differ significantly between any of the two gender-, location-, or income-subgroups. On Spearman rho analysis (data shown in Table 7a of Supplementary File 3), no significant correlation of SRAvS with household or per capita incomes was found in the whole group or in any of the subgroups. There was also no significant association of SRAvS with any of the independent variables when the effects of the confounders were adjusted (Table 8).
Comparison of SRAvS by gender & location among different InQ groups

Table 7. Long description
A table comparing SRAvS values by gender and location among different income quintiles. The table has 6 rows and 10 columns. The columns are labeled as Income Quintile rank, Male, Female, Total, Sig./P value, Urban, Rural, Total, and Sig./P value. The rows are labeled as Quintile-1 (poorest), Quintile-2, Quintile-3, Quintile-4, Quintile-5 (richest), and Total. Each cell contains values representing SRAvS values and significance levels. Notable trends include varying SRAvS values across different income quintiles and gender groups, with some significant differences indicated by P values.
SRAvS, Self-Reported Availability Score; data explored by Mann–Whitney U Test.
Association of SRAvS with independent variables as explored by multiple linear regression analysis

Table 8. Long description
A table comparing the association of SRAvS with independent variables across different population groups. The table has 8 rows and 12 columns. The columns are labeled as Urban Pop., Rural Pop., Male Pop., Female Pop., and Whole Pop., each with beta and p values. The rows are labeled with covariates: Age, Yearly income per household, Per capita yearly income, Education group, Occupation group, Gender group, and Location group. Each cell contains beta and p values for the respective covariates and population groups. Notable trends include the beta and p values for each covariate across different population groups, indicating the association strength and significance.
SRAvS, Self-Reported Availability Score; data explored by multiple linear regression analysis.
Gender-, location and InQ-based factors affecting accessibility
As per Table 6, the proportion of female HCCs using vehicles was higher and, consequently, they had to spend more (Up to US$ 0.90 by 47% and >US$ 0.90 by 37% as compared to male counterparts (36% and 30%, respectively). The urban HCCs had to spend more (84% spending 0.01->0.90 US$) as compared to the rural ones (corresponding proportion 72%). The waiting time, use of vehicles, and transport-related expenditures did not differ among the income quintile groups (InQs).
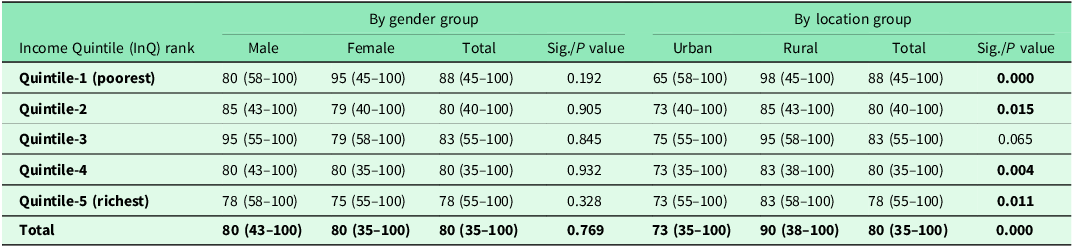
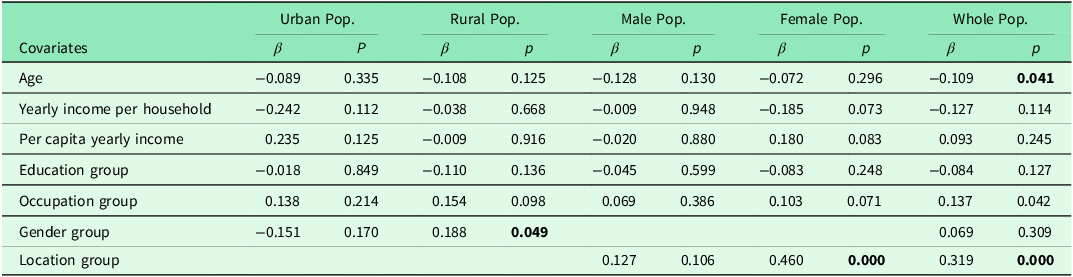
On group comparison using the Mann–Whitney test (Table 9), the median SRAcS did not differ between males and females in any of the InQ subgroups; however, the value was consistently lower in the urban subgroup across all the InQ subgroups (p ≤ 0.001–0.015; Table 9). On Spearman correlation analysis (Table 10), the household income correlated negatively with SRAcS in the whole (r = −0.134; p = 0.006) as well as in the female subgroup (r = −0.186, p = 0.003). On multiple linear regression analysis (Table 11), SRAcS was found to have a significant negative association with age (β = −0.109; p = 0.041) and a significant positive association with rural location (β = 0.319; p < 0.001) when the whole population was considered. When analysed in the subgroups, significant positive associations of SRAcS were observed with rural location among females (β = 0.460; p < 0.001) and with female gender among rural HCCs (β = 0.188; p < 0.049).
Comparison of SRAcS by gender & location among different InQ groups

Table 9. Long description
The table presents a comparison of SRAcS by gender and location among different income quintile groups. It includes data for males, females, and totals by gender group, as well as urban and rural locations. The table has 6 rows and 9 columns. Column headers are Income Quintile (InQ) rank, Male, Female, Total, Sig./P value, Urban, Rural, Total, and Sig./P value. Row labels are Quintile-1 (poorest), Quintile-2, Quintile-3, Quintile-4, Quintile-5 (richest), and Total. Row 1: Quintile-1 (poorest), Male, 80 (58-100); Female, 95 (45-100); Total, 88 (45-100); Sig./P value, 0.192; Urban, 65 (58-100); Rural, 98 (45-100); Total, 88 (45-100); Sig./P value, 0.000. Row 2: Quintile-2, Male, 85 (43-100); Female, 79 (40-100); Total, 80 (40-100); Sig./P value, 0.905; Urban, 73 (40-100); Rural, 85 (43-100); Total, 80 (40-100); Sig./P value, 0.015. Row 3: Quintile-3, Male, 95 (55-100); Female, 79 (58-100); Total, 83 (55-100); Sig./P value, 0.845; Urban, 75 (55-100); Rural, 95 (58-100); Total, 83 (55-100); Sig./P value, 0.065. Row 4: Quintile-4, Male, 80 (43-100); Female, 80 (35-100); Total, 80 (35-100); Sig./P value, 0.932; Urban, 73 (35-100); Rural, 83 (38-100); Total, 80 (35-100); Sig./P value, 0.004. Row 5: Quintile-5 (richest), Male, 78 (58-100); Female, 75 (55-100); Total, 78 (55-100); Sig./P value, 0.328; Urban, 73 (55-100); Rural, 83 (58-100); Total, 78 (55-100); Sig./P value, 0.011. Row 6: Total, Male, 80 (43-100); Female, 80 (35-100); Total, 80 (35-100); Sig./P value, 0.769; Urban, 73 (35-100); Rural, 90 (38-100); Total, 80 (35-100); Sig./P value, 0.000. The table shows the median SRAcS values and their significance across different groups.
SRAcS, Self-Reported Accessibility Score; data explored by Mann–Whitney U Test.
Correlations between SRAcS and other covariates (Spearman’s rho)

Table 10. Long description
A table with five rows and six columns comparing correlations between SRAcS and other covariates using Spearman’s rho. The columns are labeled Urban Pop., Rural Pop., Male Pop., Female Pop., and Whole Pop., each with sub-columns for r and p values. The rows are labeled Age, Yearly Income per household, Per capita yearly income, and Health Centre Type. Each cell contains numerical values representing the correlation coefficients and p-values. Notable trends include negative correlations for Health Centre Type across all population groups and a negative correlation for Yearly Income per household in the Female Pop. and Whole Pop. groups.
SRAcS, Self-Reported Accessibility Score; data explored by Spearman’s rho correlation analysis.
Association of SRAcS with independent variables as explored by multiple linear regression analysis

Table 11. Long description
A table with 8 rows and 12 columns showing the association of SRAcS with independent variables across different population groups. The columns are labeled as Urban Pop., Rural Pop., Male Pop., Female Pop., and Whole Pop., each with beta (β) and p (P) values. The rows are labeled with covariates: Age, Yearly income per household, Per capita yearly income, Education group, Occupation group, Gender group, and Location group. Each cell contains specific beta and p values for the respective covariates and population groups. Notable trends include significant negative association of SRAcS with age in the whole population and significant positive association with rural location in the whole population and among females.
SRAcS, Self-Reported Accessibility Score; data explored by multiple linear regression analysis.
Discussion
Bangladesh is cited to have one of the best rural networks of physical facilities for PHC delivery among the low- and middle-income countries (LMICs) (Islam and Biswas, Reference Islam and Biswas2014; World Bank, 2022; Chowdhury et al., Reference Chowdhury, Karim, Hasan, Ali, Khan, Siraj, Monirul Ahasan and Emdadul Hoque2022; Perry and Chowdhury, Reference Perry and Chowdhury2024; NIPORT and icddr,b, 2024). The present study shows that, from the users’ points of view, the availability of the actual services in these facilities is still poor. The most neglected area is the diagnostic one, which is available in only 19% of the HCCs and a majority (69%) of them received only laboratory services. The only RI and combined lab-RI services were also perceived to be received by negligible proportions (13% and 19%, respectively) of the diagnostic service availing HCCs. In practice, when getting advice for investigations, people prefer to go to a single facility for all the services. Accordingly, such dissociation in the availability of lab-RI services usually leads to the referral of the patients to alternate facilities and private centres become a major target. This is evidenced in the present study by direct advice to visit such facilities reported by about a quarter of the referred HCCs (Table 5). The BHFS ((NIPORT & icddr,b, 2024)) has also reported the lack of diagnostics as a major gap in health facility readiness in the country.
Next to the diagnostic services, the most neglected service is the preventive and promotive health services, as evidenced through the perceived availability of health and nutrition education services by only 31% of the HCCs. Preventive health is a major pillar of PHC (Marcotte et al., Reference Marcotte and Dugdale2019; Zakrzewska et al., Reference Zakrzewska, Parda and Rosińska2017) and health and nutrition education are central elements of such preventive services. The Alma-Ata as well as Astana Declarations (WHO, 2018; WHO and UNICEF, 2018) put special focus on them, and those are proven as cost-effective as well as contributing to the improvement of long-term health outcomes (Nutbeam, Reference Nutbeam2008; WHO and UNICEF, 2018). The PHC foundations are not strong without the focus on health literacy and behavioural change (WHO-SEARO, 2022). As per data from the present study, these services are perceived by only one-third of the consumers and this, in turn, shows a neglect of such services.
Basic emergency services are perceived to be received by only 49% Consumers at UzHC levels (Table 5). The last Health Facility Survey, conducted by NIPORT and icddr,b (2024), does not mention any infrastructure for such services. A basic emergency unit is known to be present (from the very design) at the UzHC levels; however, the present data show its poor utilization. Such deficiencies are in line with the general trends in LMICs, in which the emergency preparedness in PHC are constrained by infrastructural and operational shortcomings (Nakahara et al., Reference Nakahara, Ichikawa and Sakamoto2019).
Supply of drugs is another area where only 49% of the respondents report the availability; out of them, only18% get the drugs ‘most of the time’, and 50% do not get them ‘most of the time’. Even lower a proportion (25%) reports ‘full-free’ availability. The BHFS ((NIPORT & icddr,b, 2024)) has also shown the gaps in facility readiness where lack of essential medicines is a major component. The cost of drugs is the number one contributor to out-of-pocket expenditures (Mahumud et al., Reference Mahumud, Sarker, Sultana, Islam, Khan and Morton2017; Khan, Reference Khan, Sehrin, Quayyum, Sarker and Rahman2025). The present data indicate that not even the essential drugs are optimally available in the PHC facilities. The periodical necessity of medications, especially for non-communicable diseases, reveals breaches in the control of the chain of products and constant underspending. This has also been shown in previous publications on discussing access to essential medicines in South Asia, as manifested in NCD management in particular (Bigdeli et al. Reference Bigdeli, Jacobs, Tomson, Laing, Ghaffar, Dujardin and Van Damme2013; WHO, 2021).
For the smooth functioning of a health system and for getting better health outcomes in a country, strengthening the referral system among different levels of health facilities, starting from the primary level, is essential (Jamal et al., Reference Jamal, Ahmadini, A., Hassan, Sami, Ameeq and Naeem2024; Kakakhel et al., Reference Kakakhel, Mahmood, Khan, Makey, Arif, Jamil, Habib, Raisani, Shaheen and Diba2023). The present data, with 43% referral rates, show that this subcomponent is not properly operating in the district under study. There is a large dropout of the referred cases, meaning that there is no follow-up system. The high proportion of the participants (24%) with direct advice to visit private facilities is also unfortunate, as, in turn, it becomes the root of unethical medical practice as well as a principal contributor to the unusually high OOPs reported for Bangladesh (Khan et al., Reference Khan, Sehrin, Quayyum, Sarker and Rahman2025; Rahman et al., Reference Rahman, Hossain and Nakamura2025).
As recognized all over the world, immunization is the PHC service that is universally provided in Bangladesh and the respondents in the present study also acknowledge the fact. The success may be due to the long-lasting Expanded Programme on Immunization, which has enjoyed dedicated financing, central planning and proper surveillance for long years. It is an illustration that political authority and well-planned programme design are ways of guaranteeing equal service delivery in resource-limited environments (WHO, 2021).
On cumulating the points of various subcomponents into the scoring system, the values of SRAvS are alarmingly low (median value ranging 42–52 among the total s participants; Table 7). This shows that the overall availability status is quite poor in a region with low health outcomes. In isolation, a service (like immunization) may be highlighted, but comprehensive improvement in PHC service delivery is not provided optimally in these facilities.
In Bangladesh, apart from the periodic health facility surveys, scientific reports on service availability are scarce. As per the Health Facility Survey 2022 (NIPORT and icddr,b, 2024), PHC services like immunization and outpatient care, including ANC care, are broadly available, although readiness is still weak. The survey also mentions that Upazila Health Complexes perform better, but community and union facilities are far behind. The present data reveal that the information from facility surveys does not fully match the consumer-reported availability perception in most cases. This dissociation reflects the gaps in the actual utilization of the facilities due to lack of human resources, logistics, supplies, and guidelines, as reported by a number of Authors (Hakim et al., Reference Hakim, Chowdhury, Ahmed and Uddin2022; Khan et al., Reference Khan, Islam Trisha and Rashid2022; Kabir et al., Reference Kabir, Karim and Billah2023; NIPORT and icddr,b, 2024; Huda et al., Reference Huda, Rahman, Mostofa, Sarkar, Islam, Adam, Duc and Al-Sobaihi2024). These results are consistent with the necessity of proper investment in diagnosing infrastructure and human resources, as reported previously to be the key impediments to quality PHC (Kruk et al., Reference Kruk, Gage, Arsenault, Jordan, Leslie, Roder-DeWan and Pate2018; Jubayer et al., Reference Jubayer, Hasan, Luna, Al Mamun, Bhuiyan, Sayem, Amin, Farrell, Moran, Gupta and Choudhury2023; Kabir et al., Reference Kabir, Karim and Billah2023).
The availability component of the PHC services has been persistently shown to be below-standard across many LMICs. In India, facility surveys and programme assessments have reported that only a small number of subcentres (PHCs and CHCs) meet national standards for infrastructure and staffing, and numerous ones lack essential medicines and basic diagnostic equipment, which ultimately hamper service delivery and operation (Sriram et al., Reference Sriram2018; Ugargol et al., Reference Ugargol, Mukherji and Tiwari2023). Gaps in skilled human resources, operational equipment, and essential drugs for maternal, child and NCD care in South Asia and beyond have also been found in other studies, which have shown to generate lower uptake of antenatal, immunization and primary outpatient services (WHO, 2015; Khan et al., Reference Khan, Alam and Chowdhury2024; Krishnan et al., Reference Krishnan, Mathur, Kulothungan, Salve, Leburu, Amarchand, Nongkynrih, Chaturvedi, Ganeshkumar, K.S., Laxmaiah, Boruah, Kumar, Patro, Raghav, Rajkumar, Sarma, Sharma, Tambe, Arlappa, Mahanta, Bhuyan, Joshi, Pakhare, Galhotra, Kumar, Behera, Topno, Gupta, Rustagi, Trivedi, Thankappan, Gupta, Garg and Shelke2021). Facility surveys in Pakistan, Indonesia and other LMICs highlighted the lack of emergency medicines, inadequate diagnostic facilities for obstetric and chronic disease care, and poor transport/referral systems in rural areas, all of which reduce the effective coverage of PHC (Fanda et al., Reference Fanda, Probandari, Yuniar, Hendarwan, Trisnantoro, Jongeneel and Kok2024; Meena et al., Reference Meena, Jayanthi, Ramasamy and Thulasingam2021). These studies, however, have concentrated mostly on the physical availability and service readiness; the consumer perceptions on the actual provision of services have not been found to be explored yet. From the present data, as well as from available information, it is obvious that policy desires in LMICs do not always correspond to the fair provision of PHC services on the ground (Ahmed et al., 2015; Kruk et al., Reference Kruk, Gage, Arsenault, Jordan, Leslie, Roder-DeWan and Pate2018).
Compared to PHC service availability, accessibility is much better, which, in turn, reflects the existence of a good network of physical facilities in rural Bangladesh. Better accessibility is evident in component-wise data (Table 6) as well as in the cumulated SRAcS values (median, 65–95, Table 7), reflecting overall status. However, the cost of access is still high in the opinions of many consumers. To the best of our knowledge, accessibility-specific consumer perceptions have not yet been reported from any LMICs. However, simultaneously considering the physical facility survey results, it may be assumed that accessibility to PHC services in the rural and subdistrict urban areas is fairly good in Bangladesh (NIPORT and icddr,b, 2024). The findings, at the same time, indicate the underutilization of the facilities.
The limited availability of the PHC services is further complicated by the existence of inequity in terms of gender, location, and socioeconomic classes. The inequity in PHC services is generally assumed; however, the present data provide evidence for its existence. The relative deprivation of the females regarding availability is exemplified by less availability of diagnostic and basic emergency services and also a higher drop-out rate on referral to diagnostic services outside the PHCF. The rural consumers receive fewer diagnostic (all types) and health and nutrition education services as compared to their urban counterparts, and they also get fewer ‘free of cost’ services. The inequity among income groups is reflected by the receiving of fewer diagnostic services by the poorer subgroups.
When analysing the accessibility component, the overall score shows a consistent disadvantage for the urban HCCs, with significantly lower SRAcS (as compared to rural) among all the gender and INQ subgroups (Table 9). The lack of coordinated and comprehensive PHC infrastructure in the urban areas is a well-recognized phenomenon in Bangladesh and, consequently, the patient rush and improper management are regularly reported in the media (Anonymous, 2025). Some studies have also addressed the problems of urban PHC services in Bangladesh (Cacciatore et al., Reference Cacciatore, Mao, Nuñez, Massaro, Spadafora, Bernardi, Perone, Sabouret, Biondi-Zoccai, Banach, Calvani, Tosato, Marzetti and Landi2025). On regression analysis, the female gender and the middle socioeconomic class are found to be independently associated with the overall accessibility score. Thus, like affordability, the gender-, location-, and socioeconomic status are important factors modulating PHC service accessibility; however, urban consumers face an opposite trend regarding this component as compared to their rural counterparts.
In conclusion, the present data indicate that the available physical infrastructure is poorly utilized for the PHC services in rural Bangladesh, where special focus needs to be given on diagnostics, health and nutrition education, basic emergency, and essential drug supply services. Accessibility of the services seems to be reasonable in rural areas but not in urban areas, although there is scope for improvement regarding transport-related expenditures. The gender-, location, and socioeconomic equities need to be reviewed with priorities to women, rural people, and poorer classes.
Limitations and strengths
The district and Upazillas under the district were selected randomly; however, the union and community level PHC facilities as well as all participants were selected following a nonrandomized (purposive) technique. There was a slight overrepresentation of females (60.2%), which may impact the perceptions about availability and accessibility when analysis is done on the total sample. While providing novel evidence on factors affecting availability and accessibility of PHC services in low-performing regions, caution should be exercised for generalization as considerable variability is present regarding demographic, socioeconomic status and health care capacity even within the districts with lower health outcomes in Bangladesh.
Face-to-face interviews (as followed in the study) strengthened the validity and completeness of data collection as the interviewer was at hand to remove any ambiguities surrounding questions. The perception-based study probably reflected the actual status of availability and accessibility as compared to surveys that took only stock of existing facilities. Scoring of availability and accessibility reflected the status of the overall component as compared to fragmented perceptions on individual subcomponents. The number of samples allowed multivariate analysis to explore the association of the self-reported availability and accessibility scores, adjusting for the effects of confounding variables.
Supplementary material
The supplementary material for this article can be found at https://doi.org/10.1017/S1463423626101662.
Data availability statement
Data related to this manuscript are available from the corresponding author upon reasonable request.
Acknowledgements
We gratefully acknowledge the support of the University of Science and Technology, Meghalaya (USTM), India, in conducting this study. The authors would like to express appreciation to all the health authorities and service providers who helped us during the data collection as well as to all the Experts who gave us their valuable time in the development of the scoring methodology.
Author contributions
First Author: Conception and design of study; Acquisition of data; Data analysis and/or interpretation; Drafting of manuscript and/or critical revision; Approval of final version of manuscript. Second Author: Conception and design of study; Data interpretation; Critical revision of drafted manuscript; Approval of final version of manuscript. Corresponding Author: Conception and design of study; Supervision of the acquisition of data; Data analysis and interpretation; Critical revision of drafted manuscript; Approval of final version of manuscript.
Funding statement
This study was financially supported by the Ministry of Education, Govt of the Peoples Republic of Bangladesh, under the ‘Grant for Advanced Research in Education’ programme administered by the Bangladesh Bureau of Educational Information and Statistics, (Project/User ID: SD20232863)
Competing interests
The authors declare no conflicts of interest relevant to this work.
Ethical standards
The study received ethical clearance by the Ethical Review Committee of the Pothikrit Institute of Health Studies, Bangladesh. The following ethical concerns were considered. The informed consent of each individual was taken before the interview was conducted; the purpose of the study was explained adequately to the respondents. The data that were obtained with the help of the respondents were held in individual confidentiality.





 Open access

