Introduction
Over the last years, many studies have dealt with Unmanned Aerial Vehicle (UAV) images applied to viticulture (Matese et al., Reference Matese, Primicerio, Di Gennaro, Fiorillo, Vaccari and Genesio2013). Most of these studies focused on single obvious applications such as missing plant detection (Comba et al., Reference Comba, Gay, Primicerio and Aimonino2015), vigour mapping (Mathews and Jensen, Reference Mathews and Jensen2013), photosynthetic activity (Zarco-Tejada et al., Reference Zarco-Tejada, Guillén-Climent, Hernández-Clemente, Catalina, González and Martín2013), canopy height estimation (Burgos et al., Reference Burgos, Mota, Noll and Cannelle2015), plant water status estimation (Baluja et al., Reference Baluja, Diago, Balda, Zorer, Meggio, Morales and Tardaguila2012), disease detection (Di Gennaro et al., Reference Di Gennaro, Battiston, Di Marco, Facini, Matese, Nocentini, Palliotti and Mugnai2016) etc.) at specific stages of the vegetative cycle. These studies usually use dedicated sensors (multispectral, hyperspectral, thermal imagery, etc.) aiming at achieving the best possible information acquisition in combination with specific image processing algorithms that best address the parameter to estimate. As a result, most of these studies have conducted research very similar to those that have been considered with airborne or satellite images.
Considering the specifics of UAVs such as their extreme agility as well as cost of image acquisition and high resolution, these sensor platforms can be used to monitor vine fields all along the vine growing season at a very high spatial resolution (~2.5 cm) and a high temporal resolution (~every 2 weeks). It follows that other useful information, different to that normally considered in the literature, could be extracted from the images. This new information may contribute to decision support to assist growers and advisers (G&A) in their daily tasks. Moreover, this knowledge is important in order to guide new research (i.e. algorithms for extraction of new parameters), to design optimal acquisition conditions (i.e. acquisition date, angle of observation, flight altitude, specific sensor, etc.) or to design new relevant services for the wine industry. To our knowledge, no systematic exploratory experiments have been carried out to analyse the potential applications of the UAV for G&A. Being a new source of information, it is important to explore, as exhaustively as possible, all the information that this new acquisition platform is likely to bring in terms of decision support. In order to answer this question, a holistic and dedicated experimentation has been carried out in south of France. On the basis of expert photo-interpretation from UAV images, the objective of this experiment was to identify all the useful observations that can be made on the vineyard throughout the vegetative period (every 2 weeks).
Material and methods
Study site
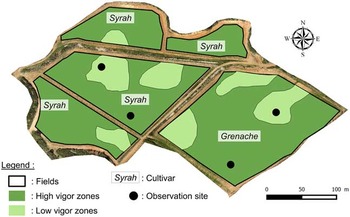
The study site was an 11.3 ha vineyard located 10 km north west of Beziers, in Languedoc in the south of France. The region is characterised by a Mediterranean climate. The study site was chosen for its representativeness of Languedoc’s commercial mechanized vineyards and the presence of high within field variability in soil characteristics and plant vigour. It was made up of five fields, all planted in the early 2000 s. Four of them were planted with Syrah variety (6.5 ha) and one with Grenache (4.8 ha). Fields were irrigated and vines were trained in vertical shoot positioning with inter-row mechanical weeding.
The study site was in a basin with a slope ranging from 0 to 10%, with deepest soils localised at the lowest elevations of the basin. For each variety, two observation sites were defined (Figure 1). These sites were selected in zones of high and low vigour determined from the knowledge of the grower. These sites were used for specific image acquisition as explained in the next section. No diseases were detected in the vineyard during the experiment.
The study zone and location of low and high vigor zones as defined expertly by the grower, location of observation sites.

Data Acquisition
UAV-based visible images were acquired every two weeks throughout the vegetative cycle of the vine. Up to 12 flights were made between April 8th (budburst) and September 29th (post-harvest) in commercial conditions by seven different UAV companies. The requirements specified to the companies were to provide for a given date a georeferenced visible image of 2.5 cm spatial resolution over the whole study site. In addition, for each of the four observation sites (Figure 1), companies were asked to acquire a specific picture of the vines with a viewing angle of 45° to the vertical on both side of the vines. As the vines were trained in a row, these 45° images were designed to identify any potential important information from the side of the canopy that may differ from a vertical view. Visible images and pictures were provided respectively in geoTIFF and JPEG format. According to these requirements, UAV companies determined their own flying parameters. Two of them used a fixed wing and five used a multirotor UAV. In the case of fixed wings, 45° images were not acquired.
Expert information gathering
Images were presented separately to two types of groups of experts. One group was constituted of two growers and the other group was constituted of six advisors. Growers had a very good knowledge of the vineyard and its variability while advisors had never visited it before. Therefore, UAV-based images were their only information about field characteristics and spatial variability. Six expert gathering sessions were performed between May 20th and October 3rd (Figure 2). During expert sessions, images were projected on a screen to the whole group. The facilitator managed the computer and zooming in or out according to expert requests. Images were managed with Qgis 2.6 (Open Source Geospatial Foundation, http://qgis.osgeo.org) and pictures with a common photo viewer.
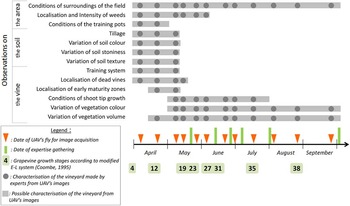
Observations made by experts from UAV images during the growth cycle of the vine.

The first objective of the expert gatherings was to identify the vineyard characteristics that growers and advisers (G&A) were able to make from UAV-based images and from the chronological sequences. The second objective was to define the relevance those observations can have for G&A decision making. For each image and each chronological sequence, the G&A described what they were observing. Then they considered and compared decision making process in their respective jobs with or without those observations. Finally, they indicated if observations made on images could i) enable quicker decision making, ii) aid in making decision making more adapted to the within-field variability, iii) both or iv) no interest.
Sessions were conducted in four consecutive steps (Table 1). The first two steps were dedicated to gather experts’ individual opinions in writing. Images were presented one by one (first step) then by chronological sequence (second step). The last steps were dedicated to exchange between experts in order to elicit the emergence of new ideas. These last steps were done collectively and orally. Images were presented again one by one (third step) then by chronological sequence (fourth step) in front of the whole group. Experts were invited to share their own observations and to react to others. Observations and reactions were recorded by the facilitator.
Methodology for expert information gathering sessions.

Results
Figure 2 shows the observations made by G&A during the information gathering sessions. Dates of vine growth stages, images acquisition and expert sessions are shown on the horizontal time axis. Every observations made by experts on the images are represented with grey circles and organised vertically according to the subject they are dealing with (the surrounding environment (‘area’), the soil and the vine).
Figure 2 shows that many relevant observations can be made from UAV-based images all along the growing season of the vine. The period between stages 19 (start of flowering) and 23 (full bloom) maximises the number of observations made by both G&A either on the canopy, the soil or the environment. Some observations were made only during the early stages (up to 19) of the vegetative cycle due to vine growth. For example, observations about soil characteristics (colour, stoniness and texture) were made only on the first three images and not anymore afterwards. Some observations were made only during specific periods of time according to vegetation changes. For example the shoot tip growth was observed from stages 19 until stage 35 corresponding to the period of vegetation growth. In the last image corresponding to this period (mid-July), G&A identified zones with shoot tips still growing and zones where vegetation growth stops. For G&A, this information is of high value. Indeed, in the Mediterranean conditions of the experiment, vegetation ceasing growth is largely determined by the occurrence of water stress. Therefore spatial variability in shoot tip growth allows for identification of zones with different water holding capacity.
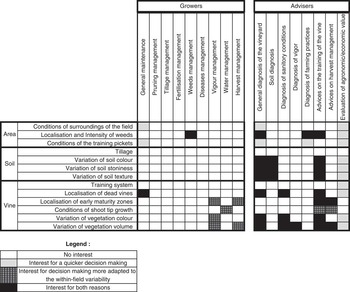
All the information of Figure 2 will not be described in detail here. Note however that the information noted by G&A is sometimes in line with parameters conventionally proposed in the literature. This is the case with i) the thickness of the vegetation which can be seen as an indicator of vigour variability, ii) the colour of the canopy which may be seen as a stress indicator (water stress, nutrient status, etc.) according to the varieties, iii) missing plants. Other parameters, usually not mentioned in the literature, were considered very important either for site specific management or for logistical issues. This is the case with i) the characterization of the trellising posts, ii) the state of the trellising system, iii) the location of the weeds, iv) the shoot tip growth, etc. This result is interesting because it shows the potential of UAV to offer new relevant observations in viticulture. Figure 2 provides a summary of these observations. Figure 3 summarises the utility of observations, as identified in Figure 2, for decision support according to G&A. Types of observations are presented in rows and operations for which observations can provide decision support are shown in columns for growers and advisors. A legend makes it possible to identify the observations useful for within field management. Figure 3 clearly shows that more relevant observations were identified by the advisers than by the growers.
Application of possible observations for decision making according to producers and advisers.

Growers did not identify any added value of soil characteristics. For growers, the main added value is to consider different management of plant vigour, water stress and harvest either at the within field level or between fields. The main advantage pointed out by growers for these observations is their ability to characterise the vineyard variability in order to optimise decision making. This result is disappointing because it does not allow identification of original observations likely to support growers in the management of their vineyard. It is interesting to note that operations mentioned by the growers are those usually considered in the literature in precision viticulture (management of vigour, irrigation and harvesting). Two assumptions may explain this result : i) growers have difficulties in identifying new possible uses from the images, they therefore focus on already existing services that they know, ii) there are no other possible uses than those mentioned and already widely discussed in the literature. In this study, it is most likely that growers did not identify the whole potential of the images because they were not familiar with this information. Indeed, growers declared they were more comfortable with 45° viewing angle pictures. It was easier for them to spot elements they know from the field on these pictures than on georeferenced images taken from above. 45° viewing angle pictures appeared to be of high value for growers. This result questions the method to be used to collect remote sensing images for use by growers.
Advisers were much more familiar with UAV images and their potential than growers. All of them had already seen these kind of images before and the majority had used such images at least once in commercial conditions. They identified added value of these images for two of their main missions: i) diagnosis of a vineyard with a better agronomic or economic potential evaluation (sanitary conditions, farming practices, origin certification, etc.) ii) advice to growers on vineyard management with quicker problem identification (soil, disease, vigour, etc.). For them, UAV images enhance their expertise and the existing information by providing indirect observations. These observations cannot be used as direct agronomic information but enable the advisers to generate hypothesis that will be afterwards validated by field observations or measurements.
In this study, adviser expertise was crucial to identify potential uses of UAV images. They picked out much more useful observations than the growers did. This point questions the methods usually used to analyse viticulture needs in terms of remote sensing images. A better integration of advisers in the process may help to identify new applications in the future.
The results of this study can identify new research in image analysis. Indeed, observations made visually by experts could be automatically or semi-automatically extracted from the UAV-images. This could be the case, for example, for the supervision of shoot-tip growth, which is an added-value observation according to G&A. Growing shoot-tips are characterized by a lighter green than older leaves. Identifying growing and non-growing shoot-tip zones by the development of ad-hoc image analysis algorithms appears to be an original and relevant research direction. The same approach could be applied to automatic detection of other elements identified in this study such as weeds, training pots or soil colour. These algorithms could be used to define automatically or semi-automatically sampling plans optimizing the number and location of expert’s observations or within-field measurements.
Results of this study can also be used to optimize the number and the dates of image acquisition depending on the observation or the decision concerned. For example, images provided by commercial companies are mainly acquired around the ripening of the vine (stage 35). As shown in Figure 2, this acquisition date is suitable for observing within-field variability in vegetation. Thus, these images provide added value mainly for growers (Figure 3) whereas their added value for advisers is limited. An earlier acquisition date, for example on stage 12 (Figure 2), would make it possible to make observations on soil, dead vines or early maturity zones. In these conditions, images could have an important added value for advisers (Figure 3).
The situations observed in our study were limited by our experimental conditions. For example no diseases such as flavescence dorée or trunk diseases were present on the vineyard during the experiment. As a consequence, these observations do not appear on the results. However this issue is of major importance for French viticulture and UAV based images appear to have good potential (Kasbari and Leroux, Reference Kasbari and Leroux2016). This expertise gathering approach could therefore be completed by a future study using a vineyard affected by diseases like flavescence dorée. This approach could also be applied to find practical applications for other high resolution images such as multi-spectral or hyperspectral.
Conclusion
This study identified further potential of UAV images in decision support for vineyard management for two types of stakeholders: growers and advisers. It shows the interest of a holistic approach to confirm the relevance of observations already proposed in the literature and to identify new useful observations that can be seen in UAV images. For each relevant observation, the approach also allows the optimal dates of acquisition of images to be identified. This study has some limits since it focuses on the particular conditions of a vineyard located in the south of France and it only considers visible images. Despite these limitations, new relevant observations specifically brought by UAV images were identified. In this respect, this study allows to guide future original researches aiming at providing algorithm to automatically extract information from images. Note that although quite simple, visible images contain a lot of information that can be used by expert photo-interpretation. Therefore a first recommendation could be to encourage service providers to develop suitable user-machine interfaces facilitating the spatial and temporal exploration/analyse of images mainly for advisors but also for growers.
Acknowledgements
This project was carried out thanks to the support of the company Chair AgroSYS of Montpellier SupAgro (https://www.supagro.fr/wordpress/agrosys/). We thank the Advini winery, owner of the study vineyards. We also thank the UAV companies Aerotec Solution, Atlas, Airinov, Cyleone, Format Drone, Decidrone, Geofalco for their participation.