Implications
This paper extended an existing lifetime performance model to incorporate the impacts that varying milk yield, energy balance and body condition have on the probability of reproducing and the productive lifespan, thereby allowing prediction of a cow’s lifetime efficiency. The model adequately simulated the productive and reproductive performance of various genotypes of cows across feeding systems. Thus, it can be used to study the effect of future selection and management on animal performance and efficiency.
Introduction
It is widely accepted that single-trait selection for greater milk production in dairy cattle is associated with significant declines in animal health (Berry et al., Reference Berry, Buckley, Dillon, Evans, Rath and Veerkamp2011) and reproductive performance (Albarrán-Portillo and Pollott, Reference Albarrán-Portillo and Pollott2013). These problems not only impair the lifetime production efficiency of dairy cows via reduced longevity by increasing involuntary culling (Seegers et al., Reference Seegers, Beaudeau, Fourichon and Bareille1998), but also increase veterinary and reproductive costs (Hogeveen et al., Reference Hogeveen, Huijps and Lam2011) and environmental losses (Garnsworthy, Reference Garnsworthy2004), and affect animal welfare (Oltenacu and Algers, Reference Oltenacu and Algers2005). An increased milk yield, a negative energy balance and a low body condition have been considered the major biological contributors to the failure of reproduction and thus to a curtailed productive lifespan of dairy cows (Friggens et al., Reference Friggens, Disenhaus and Petit2010). However, the individual effects of milk yield, energy balance and body condition on reproduction have been difficult to quantify because they are often correlated. Experiments specifically designed to break these correlations are unfortunately rare (Wright et al., Reference Wright, Rhind, Whyte and Smith1992), and a modelling approach to integrate available data seems necessary (Blanc et al., Reference Blanc, Martin and Bocquier2001). Management strategies such as breeding (e.g. selecting for high v. low genetic merit cows) and feeding programmes (e.g. high- v. low-energy diets) can alter milk yield and body reserves, and consequently reproductive performance (Cutullic et al., Reference Cutullic, Delaby, Gallard and Disenhaus2011). In this context, if the objective is to predict lifetime efficiency (LTE) there is a need to be able to predict responses of dairy cows in terms of both productive and reproductive performance under different management strategies. Such a predictive capability is especially important in the case of dairy production systems where wide variation might exist between animal genotypes and between the environments in which they are managed.
Individual-based herd models that describe each animal can be used to simulate animal responses to management practices (Brun-Lafleur et al., Reference Brun-Lafleur, Cutullic, Faverdin, Delaby and Disenhaus2013). Unfortunately, in most of these models, the reproductive process is represented by assuming a fixed reproductive efficiency such as fixed calving to ovulation or fixed parturition to conception intervals (Blanc and Agabriel, Reference Blanc and Agabriel2008; Martin and Sauvant, Reference Martin and Sauvant2010). Although recent work by Inchaisri et al. (Reference Inchaisri, Jorritsma, Vos, van der Weijden and Hogeveen2010) and Brun-Lafleur et al. (Reference Brun-Lafleur, Cutullic, Faverdin, Delaby and Disenhaus2013) has recognized the possible influences of milk yield and body reserves on reproductive performance, the simulation of these traits is only based on genetic potential and physiological stages, without the possibility of including an interaction with feeding regimes. Additionally, these models were only developed for a single lactation and thus cannot be used to predict the lifetime performance and LTE of animals.
The objective of this study is to extend the published lifetime nutrient partitioning model of Martin and Sauvant (Reference Martin and Sauvant2010), which predicts the LTE of individual dairy cows under various management strategies, by incorporating the potential influences of animal performance on reproductive performance. It is hypothesized that a high milk yield, a negative energy balance and a low body condition negatively affect reproductive performance, and thereby the productive lifespan, which is expected to have consequences for the LTE of dairy cows.
Material and methods
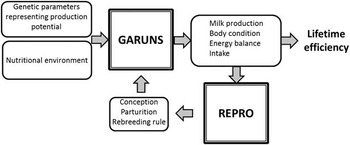
The model used in this study is dynamic and stochastic, with the individual cow being the unit modelled and one day being the time unit used within the model. The lifetime of a cow is considered from birth until culling. A schematic presentation of this model is presented in Figure 1. The core of this model relies on the lifetime nutrient partitioning model of Martin and Sauvant (Reference Martin and Sauvant2010), referred to here as GARUNS, which simulates lifetime performance of individual cows. The inputs of GARUNS include genetic scaling parameters (specified in next section), feeding information (i.e. dietary energy density), reproduction (i.e. conception and parturition) and management (i.e. culling) events. The outputs of GARUNS are daily feed intake, milk yield and composition, foetal growth, calf birth weight, BW and composition, body condition score (BCS) and energy balance throughout the lifespan of a cow. The reproduction sub-model developed in this study uses the predictions of milk yield, BCS and energy balance from GARUNS as inputs to simulate reproductive responses in terms of conception rates, and thus timing of conception and parturition, and culling decisions, which are in turn transferred back to GARUNS. In the present study, the lifespan of individual cows is mainly affected by reproductive performance and culling policy. The effect of diseases – for example, mastitis or fatty liver – on the survivability of cows is not currently incorporated.
Schematic presentation of the model for predicting lifetime efficiency of individual cows that includes the GARUNS model.

Description of lifetime nutrient partitioning model (GARUNS)
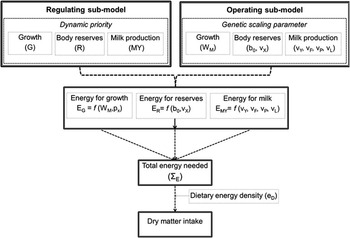
The GARUNS model consists of a regulating sub-model providing the driving force to control the function of an operating sub-model. An adapted schematic of GARUNS is presented in Figure 2. The regulating sub-model describes the dynamic partitioning of a female mammal’s priority between life functions – growth (G), ageing (A), regaining of body reserves (R), and energy supply of the unborn (U), newborn (N) and suckling (S) calf – over her lifespan. This dynamic pattern of relative priorities is assumed to be general for all individual cows and always sums to one. The operating sub-model uses the relative priorities to partition energy intake between foetal growth, BW and composition, milk yield and composition during repeated reproductive cycles and subsequently over the cow’s lifespan. Genetic scaling parameters are incorporated into the operating sub-model to scale the individual performance potentials of, for example, weight or milk production. It is noted that these genetic scaling parameters are not directly related to the widely reported breeding values commonly published in the animal genetics literature. They act as multipliers on the different dynamic priorities and thus provide the means to create different levels of genetic potential for different cows.
Schematic diagram of the GARUNS model (reprinted from Phuong et al. (Reference Phuong, Martin, de Boer, Ingvartsen, Schmidely and Friggens2015)), showing how energy requirements for different life functions (growth, body reserves and milk) are derived from genetic scaling parameters and lifetime profiles of relative priorities for the different life functions. The priorities for foetal growth, ageing and energy needed for foetal growth are not presented as they are assumed to be common trajectories for every individual.

In this context, the variation in genetic scaling parameters describes the variation in genetic potential between animals for the different GARUNS life functions. In the model, an animal is described in terms of its genotype for growth, capacity to store and mobilize reserves, and milk production using the following genetic scaling parameters: non-labile body mass at maturity (WM), daily rate of regaining body reserves (b0), labile body mass mobilization index (νX), peak milk yield potential (νy), milk fat secretion (νF), milk protein secretion (νP) and milk lactose secretion (νL). WM is given in kg, whereas the remaining parameters are fractions. Thus, to describe each genotype a specific set of these genetic scaling parameters is needed. External triggers of successful insemination (i.e. conception) drive the changes between non-reproductive and reproductive states of the animal, cueing in the dynamic priority trajectories described in the regulating sub-model.
As shown in Figure 2, the interactions between dynamic priority and genetic scaling parameters make it possible to quantify the total amount of energy required to fulfil all functions (ΣE). The resulting dry matter intake (DMI) is quantified by multiplying ΣE with the predetermined dietary energy density (eD). The coefficients for energy partitioning to different life functions are EG/ΣE, ER/ΣE and EMY/ΣE, where EG, ER and EMY are energy required for growth, reserves storage and milk production, respectively.
Description of the reproduction sub-model
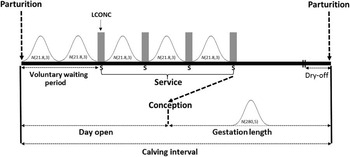
Owing to the main interest of this study being the LTE of individual cows, for which a key component is lifespan of the animals, the only reproductive information required is that which creates plausible variation in lifespan. This can simply be seen as a result of whether or not, and when, the cow becomes pregnant, and calves. Instead of modelling all the individual steps of the reproductive process (uterine evolution, resumption of oestrus cycle, oestrus expression, conception and embryonic survival), the likelihood of conception of a viable calf (LCONC) as the final product of the reproductive process is assumed. This is the accumulative result of other steps involved towards having a newborn calf. LCONC is assumed to be affected by milk yield, energy balance and body condition of the cow (Friggens et al., Reference Friggens, Disenhaus and Petit2010). The influences of parity (primiparous v. multiparous), oestrus number and disease on LCONC are not explicitly incorporated. The key events in the reproduction sub-model include conception and parturition. Figure 3 shows that, after parturition, cows are assumed to have a period of postpartum anoestrus of 21.8±3 days (Darwash et al., Reference Darwash, Lamming and Woolliams1997). Thereafter the cow is assumed to have an oestrus of 3 days, which takes place 21.8±3 days after the previous oestrus period. The breeding period commences after a voluntary waiting period, set to 50 days (Löf et al., Reference Löf, Gustafsson and Emanuelson2012). Before the end of the voluntary waiting period and outwith the 3-day oestrus window, LCONC is assumed to be zero. During the breeding period, artificial insemination is assumed to take place at every oestrus with a LCONC greater than a threshold value (0.4) to reflect the idea that weak oestruses will be poorly expressed and thus not detected by the inseminators. Insemination is simulated using a random draw from a uniform distribution, U (0, 1). A cow is assumed pregnant if the insemination value is smaller than the LCONC value.
Representation of the reproduction sub-model, showing the assumed intervals for postpartum anoestrus, oestrus cycles, and pregnancy, and their variability (as standard deviations). The grey bars indicate when the likelihood of conception is not zero – that is, in the 3 days around oestrus. The time axis is not to scale as this is a visualization of the model.

LCONC is calculated using components determined by milk yield (LCONCMY), energy balance (LCONCEB) and body condition (LCONCBCS) of the cows (equation (1)). Under perfect conditions, these LCONC components each have a value of 1 that can be driven down to 0 as described below. A maximum LCONC value of 0.6±0.06 is assumed, which is supported by reported variation of 57% to 63% for the conception rate of Holstein virgin heifers (Kuhn et al., Reference Kuhn, Hutchison and Wiggans2006). This assumption is made in light of our initial hypothesis that fertility is mainly affected by high milk production, a negative energy balance and a low body condition, which do not exist in virgin heifers. Consequently, LCONC is computed as follows:
 $${\rm LCONC}=0.{\rm 6}0{\times}({\rm LCONC}_{{{\rm MY}}} {\times}{\rm LCONC}_{{{\rm EB}}} {\times}{\rm LCONC}_{{{\rm BCS}}} )$$
Gestation length is assumed to follow a normal distribution, N (280, 5) days (Hansen et al., Reference Hansen, Lund, Pedersen and Christensen2004). Factors influencing gestation length such as breed, age or birth weight of the calf were not considered.
Effect of milk production on the likelihood of conception
The underlying mechanism for the negative effect of milk yield (MY) on the fertility of dairy cows was investigated by Wiltbank et al. (Reference Wiltbank, Lopez, Sartori, Sangsritavong and Gümen2006). As high milk yield is supported by high dry matter intake and consequently high blood flow in the liver, it increases the speed of clearance of oestradiol and progesterone. The low concentration of plasma oestradiol reduces the stimulation of the centres that control oestrus behaviour, and thus the behavioural expression of oestrus, whereas a reduced circulating concentration of progesterone is associated with a low pregnancy rate (McNeill et al., Reference McNeill, Diskin, Seenan and Morris2006). In this study, it is assumed that as soon as the cows are producing milk it has a negative effect on LCONC; as such, LCONC decreases in a sigmoidal manner with increasing MY. The likelihood of conception resulting from the effect of milk yield (LCONCMY) is quantified in equation (2).
 $${\rm LCONC}_{{{\rm MY}}} ={\rm 2}/({\rm 1}{\plus}{\rm exp(Rat}_{{{\rm MY}}} {\times}{\rm MY)})$$
where MY is daily milk yield (kg/day) and RatMY is a constant for the extent of the effect of milk yield on the likelihood of conception. The value of RatMY (0.012) was estimated from the study by Cutullic et al. (Reference Cutullic, Delaby, Gallard and Disenhaus2011) where the experiment was designed to separate the effect of MY on reproductive performance from the effects of energy balance and body condition.
Effect of energy balance on the likelihood of conception
The effect of negative energy balance (NEB) is commonly attributed to the suppression of the pulsatility of luteinizing hormone (LH) and reductions in the ovarian responsiveness to LH stimulation (Butler, Reference Butler2000). During the period of negative energy balance, plasma glucose, insulin and insulin-like growth factor-I (IGF-I) are reduced. Insulin is known to stimulate bovine follicular cells (Spicer et al., Reference Spicer, Alpizar and Echternkamp1993), whereas IGF-I is critical to ovarian follicular development (Butler et al., Reference Butler, Pelton and Butler2006). Consequently, NEB shifts the course of postpartum ovarian activity and strongly influences the resumption of ovarian cycles (Senatore et al., Reference Senatore, Butler and Oltenacu2010). Other authors have also reported an inferior oocyte quality in negative-energy-balance cows (Leroy et al., Reference Leroy, Van Soom, Opsomer, Goovaerts and Bols2008). The effect of NEB on the likelihood of conception (LCONCEB) is formalized in equation 3.
 $${\rm LCONC}_{{{\rm EB}}} ={\rm 2}/({\rm 1}{\plus}{\rm exp(}\!{\minus}{\rm Rat}_{{{\rm EB}}} {\times}{\rm EB)})$$
where EB is daily energy balance (MJ/day) and RatEB is a constant parameter. The value of RatEB (0.027) was derived from the study by Wright et al. (Reference Wright, Rhind, Whyte and Smith1992). This experiment on beef cattle was designed to break the correlation between body fatness and body mobilization by applying two feeding levels during lactation to cows that had previously been made thin or fat. Thus, it is possible to separate the effect of body condition and NEB on reproductive performance, if no effect of MY is assumed. Energy balance is computed from GARUNS outputs as follows:
 $${\rm EB}={\rm E}_{{{\rm Intake}}} -({\rm E}_{{{\rm Growth}}} {\plus}{\rm E}_{{{\rm Maintenance}}} {\plus}{\rm E}_{{{\rm MY}}} {\plus}{\rm E}_{{{\rm Pregnancy}}} )$$
where EB is energy balance (MJ/day); EIntake is energy intake (MJ/day); and EGrowth, EMaintenance, EMY and EPregnancy are energy requirements for growth, maintenance, milk production and pregnancy, respectively, expressed as metabolizable energy (MJ/day).
Effect of body condition on the likelihood of conception
In the literature, depressed reproductive performance in thin compared with fat cows has been observed (Wright et al., Reference Wright, Rhind, Whyte and Smith1992; Pryce et al., Reference Pryce, Coffey and Simm2001). Low body condition is related to low level of leptin, which is also linked to reproductive function (Spicer, Reference Spicer2001). The effect of body condition on the likelihood of conception (LCONCBCS) is formalized in equation 5. To measure the body fatness of cows, BCS is used on a scale of 0 to 5 (0=emaciated and 5=extremely fat). It is assumed that a level of BCS⩾3 has no effect on LCONCBCS.
 $${\rm LCONC}_{{{\rm BCS}}} ={\rm 2}/({\rm 1}{\plus}{\rm exp(}\!{\minus}{\rm Rat}_{{{\rm BCS}}} {\times}({\rm BCS}{\minus}{\rm 3}){\rm )})$$
where RatBCS is a constant parameter. The value RatBCS (0.425) was obtained from the paper by Wright et al. (Reference Wright, Rhind, Whyte and Smith1992).
Culling policy
The reproductive culling rules assumed for this study are as follows. Cows are culled if they fail to become pregnant after four inseminations and MY on that day is <25 kg/day. If the insemination number is 4 but cows are still producing ⩾25 kg/day of milk, a fifth insemination is allowed; if this does not result in pregnancy they are culled. To take into account the fact that some cows might not express oestrus for a long time, another culling rule is included where cows are culled anyway if they are not pregnant after 160 days postpartum. For simplicity, at this stage, the effects of management factors such as age or population structure on culling decisions were not considered.
Model implementation and evaluation
The model was implemented in C++ programing language on the RECORD platform (Bergez et al., Reference Bergez, Chabrier, Gary, Jeuffroy, Makowski, Quesnel, Ramat, Raynal, Rousse, Wallach, Debaeke, Durand, Duru, Dury, Faverdin, Gascuel-Odoux and Garcia2013). To evaluate the model, two data sets were taken from the literature. In the first data set of Cutullic et al. (Reference Cutullic, Delaby, Gallard and Disenhaus2011) and Delaby (personal communication, 2014), recorded at the Le Pin research farm, two breeds of cows (Holstein Friesian selected for MY and dual-purpose Normande cows) fed a high-concentrate diet were used to evaluate the effect of genetic selection on reproductive performance and LTE. The second data set was taken from the long-term experiment carried out at the Langhill Dairy Cattle Research Centre (Pryce et al., Reference Pryce, Nielsen, Veerkamp and Simm1999; Coffey et al., Reference Coffey, Simm, Oldham, Hill and Brotherstone2004). In the Langhill data, high- and low-feeding systems were applied to two lines of Holstein Friesian cows: a control line and the line that had been selected for kilograms of fat plus protein yield. This allowed testing of the module under a genotype and feeding system interaction. The voluntary waiting period was specifically set to 65 days for the Langhill cows to match the data (Smith; personal communication, 2014).
GARUNS was first adjusted to simulate populations of cows that match the observed productive performance in the selected data sets. This was done using the genetic scaling parameters representing milk production level (νy), mature weight, (WM), daily rate of regaining body reserves (b0) and labile body mass mobilization index (νX). The higher the values of νy and WM, for example, the higher the capability of producing milk and the larger the cows. All cows were assumed to share the same capability of secreting milk fat (νF), milk protein (νP) and milk lactose (νL), and thus milk composition. The within-population variability in νy, WM, b0 and νX was simulated using the standard deviations and correlations reported by Phuong et al. (Reference Phuong, Martin, de Boer, Ingvartsen, Schmidely and Friggens2015).
Low feeding was simulated using a level of dietary energy density (eD) to reduce the total energy intake of cows, and thus performance (i.e. milk yield and BW), to the level reported in the data, whereas high feeding implies no limitation to energy intake. Having created the same levels of milk production, energy balance and body condition as observed in the data sets, the LCONC module was then used to estimate the resulting reproductive performance and productive lifespan. Simulated results for conception to first service (FSC), days from parturition to first service (DFS), days from parturition to conception or days open (DOP), and calving interval (CI) were then compared with those observed in the experimental data set. To test the repeatability of the model, each scenario was run 20 times, with 200 cows each. To evaluate the reliability of the reproduction module in predicting the reproductive performance of cows, the likelihood of the mean simulated value being part of the distribution of observed values reported in the experiment was calculated using the equation suggested by Friggens et al. (Reference Friggens, Chagunda, Bjerring, Ridder, Hojsgaard and Larsen2007):
 $${\rm likelihood}={\rm 1}-{\rm F[}({\rm x}{\minus}\mu )/\sigma {\rm ]}$$
where x is the mean simulated value, µ is the mean of the observed value, σ is the standard deviation of the observed value, and F is the distribution function for the standard normal distribution.
Welch’s t-test was also performed using R software version 3.2.1 (R Development Core Team, 2015) for comparing the means of observed and simulated values.
Calculation of LTE
The LTE of individual cows in each scenario was calculated using the following equation:
 $${\rm LTE = }{{\mathop{\sum}\limits_{\rm 1}^{\rm N} {{\rm E}_{{{\rm Milk}}} } } \over {\mathop{\sum}\limits_{\rm 1}^{\rm N} {{\rm E}_{{{\rm Intake}}} } }}{\times}{\rm 100}{\rm .}$$
where LTE is the lifetime efficiency (%), EMilk is the total energy in milk (MJ), EIntake is the total energy intake (MJ) and N is the time from birth to culling (day).
Results
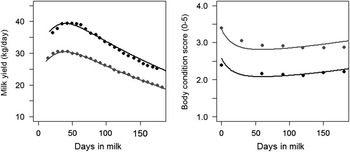
An example simulation of two genotypes of cows differing in milk production level and BCS is given in Figure 4, using the genetic scaling parameters νy, WM, b0 and νX. In this example, the high MY and low BCS curves represent the average Holstein cow fed a high-concentrate diet in Cutullic et al. (Reference Cutullic, Delaby, Gallard and Disenhaus2011), whereas the low MY and high BCS curves represent the average Normande cow. Figure 4 shows that the GARUNS model adequately simulated lactation and BCS curves of the average Holstein and Normande cows. No comparison in BW curves could be made because of insufficient data, but the simulated live weights 1 week postpartum of 678 and 700 kg for Holstein and Normande cows, respectively, were comparable to the reported data. More generally, different populations of cows differing in genetic potential – for instance, high- v. low-milk-producing cows – could be simulated by scaling the genetic scaling parameters up and down. The performance of control and selected cows from the Langhill data were also simulated in the same way (data not shown).
Model simulation of milk yield and body condition score of Holstein and Normande cows in the Le Pin data. Circles are observed data set and lines are simulated outputs. Black represents Holstein cows and grey represents Normande cows.

Effect of genotypes on reproductive performance and LTE
The simulated reproductive performance, lifespan and LTE of the two genotypes of cows in the example of Figure 4 are presented in Table 1. The model satisfactorily predicted reproductive performance of the Holstein cows (P>0.05) but considerably under-predicted that of the Normande cows (P<0.05). Table 1 gives the likelihood of a given mean simulated value of reproductive traits being part of the observed population. For example, in the Le Pin Holstein cow data the likelihood of a mean simulated FSC of 41 being part of the observed population was 45%, indicating that in the population of observed FSC values reported by Cutullic et al. (Reference Cutullic, Delaby, Gallard and Disenhaus2011) 45% of them would be >41%.
Simulated effect of high v. low genetic merit for milk production on reproductive performance and LTE compared with data from Le Pin cows (mean±standard deviationFootnote 1 )

FSC=first service conception (%); DFS=days from calving to first service (d); DOP=days from calving to conception or days open (d); CI=calving interval (d); LSP=lifespan (d); LTE=lifetime efficiency (%); NA=not available.
Sample size of n=5 for FSC in observed and simulated populations, n=200, 110 and 133 for remaining traits in simulated, observed Holstein, and observed Normande populations, respectively.
1 Values of standard deviation for the observed reproductive traits from the Le Pin cows were assumed from the study of Pryce et al. (Reference Pryce, Nielsen, Veerkamp and Simm1999).
2 Values reported in the parentheses indicate the likelihood of the mean simulated value of that trait being part of the corresponding population of observed values (%).
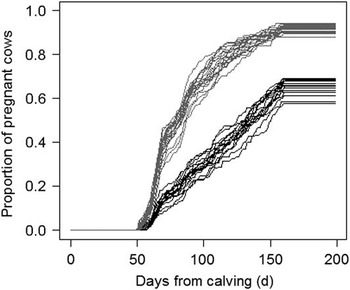
Cows with high genetic merit for milk production (Holstein) were predicted to have a more inferior reproductive performance than were low genetic merit ones (Normande) – lower conception rate, higher days to first service, higher days open, longer calving interval and shorter lifespan. Despite having a worse reproductive efficiency and shorter productive longevity, high-milk-producing cows still have higher LTE than the low-milk-producing ones. The proportion of cows that become pregnant by a given number of days in milk is lower for the simulated Holstein cows compared with Normande cows (Figure 5). Table 1 also shows a high consistency between the simulations with low standard errors that can simply be computed by dividing standard deviation by squared-root of sample size.
Simulated proportion of pregnant cows by days in milk of Holstein (black lines) v. Normande (grey line) cows from the Le Pin data set. Each line is one repetition of a simulation with a population of 200 cows.

Effect of genotypes and feeding levels on reproductive efficiency and LTE
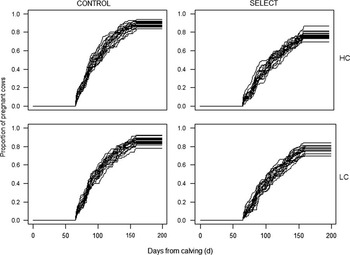
Table 2 presents simulated reproductive traits in comparison with the corresponding records in the Langhill data. The simulated FSC were comparable to those of the observed data with the likelihood of being part of the observed population ranging from 41% to 49% (Table 2). DFS are on average 6 days longer in the simulated results compared with the data records, whereas the simulated DOP and CI are on average 10 days shorter than the observed values. Generally, cows selected for maximal milk production had lower reproductive performance, and thus a shorter lifespan. However, the LTE of individual cows was mainly driven by milk production level rather than reproductive performance and lifespan, which might explain why the simulated LTE of the selected cows was higher than that of the control cows. No clear effect of level of concentrate feeding on reproductive performance could be observed in the simulation. These results are confirmed by the plots of the simulated proportion of cows becoming pregnant for control and selected populations in high- v. low-concentrate systems presented in Figure 6.
Simulated proportion of pregnant cows for the Langhill data set: HC=high concentrate and LC=low concentrate. Each line is one repetition of a simulation with a population of 200 cows.

Simulated effect of genotype and feeding environment on reproductive performance, lifespan and LTE relative to data from Langhill cows (mean±standard deviation)

FSC=first service conception (%); DFS=days from calving to first service (d); DOP=days from calving to conception or days open (d); CI=calving interval (d); LSP=lifespan (d); LTE=lifetime efficiency (%); HC=high concentrate; LC=low concentrate; NA=not available.
Sample size of n=5 for FSC in observed and simulated populations, n=200 and 138 for remaining traits in simulated and observed populations, respectively.
1 Values reported in the parentheses indicate the likelihood of the mean simulated value of that trait being part of the corresponding population of observed values (%).
Discussion
The main purpose of this study was to incorporate the impact that performance level has on the reproductive success of individual cows into an existing lifetime performance model, and thereby allow prediction of cow LTE. The likelihood of conception of a viable calf as the final product of the reproductive process was made sensitive to performance levels – namely, milk yield, body condition and energy balance. This allowed the model to evaluate at each time-step within the relevant phases of lactation whether or not the cow becomes pregnant and, if so, when. On the basis of these reproductive outcomes the model was able to include variation in productive lifespan within the simulations of lifetime performance and LTE. This model development was evaluated using two data sets with varying performance levels. To simulate different genotypes of cows (high genetic merit, i.e. selected, compared with low genetic merit, i.e. control, cows), genetic scaling parameters were used to create differences in production levels such as milk yield, growth capacity or mature weight. Thus, the testing reported in the present study is only of the reproductive module (GARUNS has been tested in Martin and Sauvant (Reference Martin and Sauvant2010) and Phuong et al. (Reference Phuong, Martin, de Boer, Ingvartsen, Schmidely and Friggens2015)).
Comparison of simulation outputs of reproductive performance with observed data
Generally, the model showed a good ability to consistently simulate the reproductive performance of various genotypes of cows across nutritional environments as the predicted values are close to the observed ones, and changes are in the same direction between breeds. For the Le Pin data, the model under-predicted the reproductive performance of Normande cows but the simulated outputs were comparable with the records of Cutullic et al. (Reference Cutullic, Delaby, Gallard and Disenhaus2011) for Holstein cows. The under-prediction of the reproductive performance of Normande cows was probably due to the fact that the constants in the present reproduction sub-model – that is RatMY, RatEB and RatBCS – were derived from the studies including Holstein cows. Indeed, there have been reports of significant innate variation between breeds for reproductive performance even when fed the same diet (Berry et al., Reference Berry, Bermingham, Good and More2003; Cutullic et al., Reference Cutullic, Delaby, Gallard and Disenhaus2011).
Compared with the Langhill data the model adequately predicted FSC while slightly over- and under-predicted DFS, and DOP and CI, respectively. However, such discrepancies between simulated and observed values were rather small – that is, 5 days for DFS and 10 days for DOP and CI, on average – and thus might not be practically important.
It is particularly encouraging that the model was able to predict the direction and magnitude of differences in reproductive performance of cows when comparing control v. selection line cows, and high- v. low-concentrate feeding. High-yielding cows took longer to be inseminated or to become pregnant and thus had a longer CI than the low-milk-producing individuals. Although the FSC was not different between the two genotypes, the overall conception rate, or the proportion of cows becoming pregnant (Figure 6), and the lifespan (Table 2) were reduced in the high-genetic-merit (i.e. selected) compared with the low-genetic-merit (i.e. control) cows. These results are consistent with literature comparisons of differences in genetic merit for milk production (Horan et al., Reference Horan, Mee, O’Connor, Rath and Dillon2005; Yániz et al., Reference Yániz, López-Gatius, Bech-Sàbat, García-Ispierto, Serrano and Santolaria2008).
When examining the effect of the feeding system, the simulated outputs show that there were no clear differences in reproductive performance, lifespan and LTE between the low- and the high-concentrate-feeding groups. The plots (not shown) of simulated effects of milk production, BCS and energy balance on the likelihood of conception – that is, LCONCMY, LCONCBCS and LCONCEB, respectively – of individual cows in high- v. low-concentrate-feeding groups indicate that the likelihood of conception in the low-feeding group was reduced via low BCS and negative energy balance but this was compensated for by lower milk production, whereas the major negative effect of high feeding was on the likelihood of conception due to high milk production. These results agree with the conclusion of Cutullic et al. (Reference Cutullic, Delaby, Gallard and Disenhaus2011) that low-fed cows, on the one hand, may suffer from greater body condition loss and poorer body condition but on the other hand may benefit from a lower level of milk production. Interestingly, when examining the observed feed effects, Pryce et al. (Reference Pryce, Nielsen, Veerkamp and Simm1999) found little overall difference in the reproductive performance between animals fed a high v. a low concentrate. However, working on the same data at Langhill but with a division of records into heifers and multiparous cows over two lactations, McGowan et al. (Reference McGowan, Veerkamp and Anderson1996) reported that low-concentrate-fed heifers had a better reproductive performance but found the opposite pattern with multiparous cows. In the data of Pryce et al. (Reference Pryce, Nielsen, Veerkamp and Simm1999) 34% of records were from heifers. Further to this, the effect of high- v. low-concentrate feeding (or dietary energy density) is not consistent in the literature: there are studies that have reported better reproduction when fed low-concentrate compared with high-concentrate diets (Horan et al., Reference Horan, Mee, O’Connor, Rath and Dillon2005; Walsh et al., Reference Walsh, Buckley, Pierce, Byrne, Patton and Dillon2008). There are also studies showing the opposite effect (Pedernera et al., Reference Pedernera, García, Horagadoga, Barchia and Fulkerson2008; Wall, Reference Wall2008). Cutullic et al. (Reference Cutullic, Delaby, Gallard and Disenhaus2011) showed a lower proportion of cows being inseminated during the breeding period when fed a low-energy-density diet compared with a control diet. This indicates the necessity of carefully considering the difference between heifers and cows in their capability to reproduce, especially the way they respond to a change in the nutritional environment.
Effect of genotype and feeding system on lifespan and LTE of individual cows
In the present study, the simulated total lifespans of Holstein cows in either control or selected lines fed high-concentrate diets are comparable to reports from the literature; that is, the simulated lifespan varies from 2225 to 2856 days, whereas it is ~2200 days for British Holsteins (Pritchard et al., Reference Pritchard, Coffey, Mrode and Wall2013) and 2128 days for Dutch Holsteins (CRV, 2014). In this model it was assumed that all cows start breeding at 450 days of age, and because the gestation length is on average 280 days the start of first lactation was on average at 730 days. Given this, the productive lifespan (time from first calving to culling) was calculated to be on average 1810 days or 4.4 lactations (productive lifespan/calving interval). This is higher than the reported mean productive lives of 3.3 lactations for Austrian Holstein cows (Knaus, Reference Knaus2009), 1500 days for British Holstein cows (Pritchard et al., Reference Pritchard, Coffey, Mrode and Wall2013) and three lactations for American Holstein (Hare et al., Reference Hare, Norman and Wright2006). The longer simulated lifespan might be attributed to the fact that in this study the lifespan of individual cows is mainly driven by reproductive performance and a simple culling policy. The effect of diseases – for example, mastitis or fatty liver – on cow survivability is not currently incorporated.
The simulation outputs showed that selection for greater milk production decreases the reproductive performance and lifespan (Table 2). Interestingly, in terms of efficiency, the present model suggests that such decreases in reproductive performance and lifespan are probably compensated for by high milk production, which explains the slightly higher LTE of selected cows compared with control cows (48% v. 45%, Table 2). In this study, a simple definition of LTE was used – the within-cow ratio of total energy captured in milk over total energy intake – and thus the improvement of LTE relies on the principle of diluting maintenance requirements by increasing milk production (VandeHaar and St-Pierre, Reference VandeHaar and St-Pierre2006) or reducing the number of unproductive days (Lormore and Galligan, Reference Lormore and Galligan2001). At the animal level, milk production had more influence on LTE than the length of productive lifespan. Blank et al. (Reference Blank, Schaub, Paulsen and Rahmann2012) found a strongly positive correlation between LTE (kg of milk/cow per day) and milk yield (R 2=0.8) of cows for the same lifespan, but no significant correlation between productive lifespan and LTE could be found (R 2 not reported). The result in this study is also consistent with the spreadsheet model of Jones (Reference Jones2005) in which the financial impacts of reducing annual milk production to extend the productive life of dairy cows is calculated. The annual returns were estimated using specific assumptions on annual milk production, feed consumption, milk prices and feed prices. The simulated results showed that the net financial effect of sacrificing milk production for a longer productive life of dairy cows was generally a loss. However, neither the study by Jones (Reference Jones2005) nor the present study takes into account other economic benefits of having a longer productive life, such as more female calves available for replacement, fewer failed inseminations, or decreased veterinary costs due to fewer peri-parturient periods per year, nor do these models consider the societal concerns around animal welfare issues, which are especially important if production efficiency at the farm level is considered. VandeHaar (Reference VandeHaar2014), for example, indicated that feed consumed by heifers can account for 15% to 30% of the amount of feed of a cow during her lifetime. The published estimates of the economic losses of clinical mastitis, for example, range from €61 to €97 per cow on a farm (Hogeveen et al., Reference Hogeveen, Huijps and Lam2011). At the farm level, increased productive life and consequently longevity will lead to fewer replacement heifers being required to achieve the same level of output, thus reducing the replacement costs; more offspring are produced, and more intensive selection is possible (Bell et al., Reference Bell, Wall, Russell, Simm and Stott2011). Garnsworthy (Reference Garnsworthy2004), using a modelling approach, reported that improved longevity lowered the environmental impact; for example, 27% of methane produced on farms is expected to be produced by herd replacements, and thus by lowering the number of heifer replacements methane emissions would also be mitigated. Additionally, the relevance of including body composition to the calculation of feed efficiency is important when we want to compare two breeds differing largely in body composition. This, however, raises a non-trivial question of what value to put on body reserves. To our knowledge this has not satisfactorily been resolved, and is a complex issue as it most likely depends upon the time point at which those reserves are available; for example, body reserves at the start of lactation are presumably of more value for supporting milk production than in later lactation. As in this paper the major aim was to attempt to include the potential impacts of performance on the probability of reproducing, and thus variation of lifespan, such a question of body reserve value has not been addressed. These points of discussion indicate the need for further analysis of LTE not only in terms of the definition used at the individual level but also at the herd level if the consequences of future management strategies are fully to be evaluated.
Conclusions
The model used in this study consistently simulated the effects of productive performance on reproductive outcomes of various genotypes of cows across feeding systems. The simulated effect of genotypes on reproductive performance was in agreement with the observed trends in the test data. Genetic selection for greater milk production impaired the reproductive performance. The effect of a poorer nutritional environment on simulated reproductive performance was relatively well modelled with respect to the test data. LTE, defined as the energy ratio between milk and feed intake, was slightly higher for high–genetic-merit cows compared with lower-genetic-merit cows due to the compensation in milk quantity over a longer productive life. However, this LTE definition does not include associated costs. The value of body reserves, economic indicators and other management factors should also be incorporated to fully and more accurately simulate lifetime profitability in different scenarios.
Acknowledgements
The authors gratefully acknowledge the financial support of the GreenhouseMilk and the REPROLAC projects. The GreenhouseMilk project is a Marie Curie Initial Training Network – funded by the European Commission, Framework 7. The REPROLAC project is funded by The Danish Council for Strategic Research, The Programme Commission on Health, Food and Welfare. The authors also thank Luc Delaby (INRA – AgroCampus Ouest) and the staff of the INRA experimental farm Le Pin au Haras for their assistance in obtaining the data set.