1. Introduction
Wayfinding is considered a challenging task in environmental settings with high levels of spatial intricacy, particularly when combined with a person's unfamiliarity with the specific environment. In some cases, wayfinding difficulties can cost institutions huge sums of money (Zimring, Reference Zimring1990). During wayfinding, a navigator must rely on information from their surroundings to acquire the environmental knowledge necessary to locate their destination. This environmental knowledge concerning potential routes and destination can be obtained from – amongst other resources – maps and information signage. Although signage is not the only wayfinding aid present in spatial settings, it has been proven of great importance in gathering environmental information and reducing wayfinding time and frustration (Carpman and Grant, Reference Carpman and Grant1993; Rodrigues et al., Reference Rodrigues, Coelho and Tavares2018). Multiple studies (Butler et al., Reference Butler, Acquino, Hissong and Scott1993; Fewings, Reference Fewings2001) have suggested that signage carefully placed in the environment can reduce wayfinding difficulties. A study by Holscher et al. (Reference Holscher, Buchner, Brosamle, Meilinger and Strube2007) found that in the co-presence of wayfinding signage, the usage of a map for acquiring environmental information reduced by nearly two-thirds. Multiple factors enhance the impacts of signage while delivering environmental knowledge, including the design of information, signage visibility, location, materials, lighting and placement. One study (Sadek, Reference Sadek2015) suggested that the signage position along with its design can influence the navigator's wayfinding behaviour and performance. Moreover, if the placement of signage and design is distinctive to the background environment and attracts the viewer's attention, then it can deliver the requisite environmental information effectively (Tzeng and Huang, Reference Tzeng and Huang2009). Environmental information can make the spatial environment legible for finding the required destination. In addition, the signage has several other functions, including but not limited to: providing instructions, demarcations, identifications and warnings, etc. (Landry and Bourhis, Reference Landry and Bourhis1997; Spolsky, Reference Spolsky2008). The identified core purposes of signage have been developed through its graphic, textual and symbolic information design.
1.1. Signage categories
The information signage has several classifications based on its provided information category and purpose. An investigation by Tzeng and Huang (Reference Tzeng and Huang2009) suggested a classification of signage design based on the type and detail of information, i.e. simplified and detailed information. According to this study, three classifications have been established based on the nature of information, such as direction, identification and orientation signage. On the other hand, a study by Boyd (Reference Boyd1993) suggested that the five fundamental categories of signage system mentioning information signage and regulation signage in addition to the previous classifications. The signage types serve different functions in a spatial setup to facilitate the wayfinding, either in telling the directions or in building up the survey and route knowledge. Each signage type has comprised the information in the form of text, pictograms, colours and directional symbols. The directional signage has comprised the information regarding path or route directions, having directional arrows or symbols, whereas the identification signage information points out certain landmarks, buildings and facilities to strengthen one's sense of orientation. Furthermore, Wallace's study (Reference Wallace1997) described that orientation signage has large-scale information of spatial environment while highlighting the important knowledge points. Moreover, regulation signage has information regarding general regulations within a building or a cluster of structures, while information signage has general information based on distinct spatial characteristics. These mentioned categories have several characteristics based on the nature of the information provided, which may require a further thoughtful insight concerning cultural and individual-related (age, gender, education, etc) aspects.
1.2. Signage characteristics
The information design on wayfinding signage demands special consideration regarding the use of language, the volume of information, placements and colours and the usage of symbols or pictograms. An investigation by Hughes et al. (Reference Hughes, Pinchin, Brown and Shaw2015) suggested that the high information density in the signage may lead to inefficient wayfinding as they are the key factors of producing stress and confusion amongst the navigators. An investigation (Carr, Reference Carr2006) suggested the substantial need for careful consideration in the design and placement of signage within a spatial environment to avoid confusions for navigators. While designing the signage, the placement and visual attraction of design elements (fonts, symbols, colours and information content) play an important role in delivering effective information. Multiple studies (Shim and Paik, Reference Shim and Paik2003; Rousek and Hallbeck, Reference Rousek and Hallbeck2011) investigated the role of text and its influences on human wayfinding behaviour and suggested that the text, typeface, and its layout composition can alter the way navigators comprehend the information.
The navigator's ability to comprehend the signage information is dependent on the style and composition of fonts in conjunction with the information content. The Berger study (Reference Berger2010) along with the standardisation authority (Ministry of Health-NSW, 2014) suggested that the usability of signage information may increase if the design format and text layout is consistent through the wayfinding design. Another study (Leonard et al., Reference Leonard, Verster and Coetzee2014) investigated the signage standardisation and found it instrumental in making the signage easier to locate and comprehend. The study also emphasises on the simplification of the supplied information and graphics. In addition to the source of information, the design of wayfinding signage can also be perceived as an added value for institutional branding. Bruce and Daly (Reference Bruce and Daly2010) found that the signage design can both reinforce the institutional value to the user by giving wayfinding information as well as strengthen the identity of the organisation. This design uniformity can also be influential in building up environmental knowledge while requiring decreased cognitive efforts. The process of comprehending the information is strongly influenced by the knowledge and previous experience of the signage design (Trisnawati and Sriwarno, Reference Trisnawati and Sriwarno2018).
The designing of signage demands a strong and critical approach, as it has a strong impact on wayfinding behaviour and performance. An efficient signage system in an architectural environment can increase the environmental legibility as well as make the spatial surroundings more efficient in wayfinding. There are several principles established in an investigation (Bao, Reference Bao2004) concerning the purpose, aesthetics, visual strength, placements, colours, size and forms of information signage, especially those to be placed in the university libraries. Special consideration is given to the library information design due to its complex spatial layout. The physical layout of libraries usually consists of large hallways with book stacks, administration rooms and designated reading areas. Users usually find it difficult to locate their desired locations in the absence of effective wayfinding information. The requirement of signage design may vary because of environmental surroundings, as every spatial environment is different in the complexity of layouts as well as demands specialised tasks to do. Stoller (Reference Stoller2013) investigated the problems in wayfinding system in the four different airports across the USA. The study identified the design of information as an integral part affecting wayfinding behaviour. The wayfinding at airport terminals is crucial due to the tight schedule of passengers’ itineraries. The passengers must be able to navigate effortlessly to locate their desired location at the terminal. Considering time as a focal point, the wayfinding information at airport terminals should be accessible and comprehensible for most users. In this regard, multiple studies (Hideyuki et al., Reference Hideyuki, Shunji and Takashi1978; Alant et al., Reference Alant, Kolatsis and Lilienfeld2010) have identified the important visual elements of information design, such as the colours in recognising wayfinding symbols and the preferred text styles to attract the navigator's attention. In totality, the signage design has several standardised components for designing the information content. These components include the style of text, language, symbols, colours, placements, layouts, materials and effects of lights. The individual's perception of information signage may be dependent on multiple factors based on their knowledge and past experiences about the signage (Trisnawati and Sriwarno, Reference Trisnawati and Sriwarno2018).
Some constraints have been explored in the usage of signage design components and their information delivery techniques. Scialfa et al. (Reference Scialfa, Spadafora, Klein, Lesnik, Dial and Heinrich2008) investigated the role of text in the presence of symbolic information and identified that the text may deliver the information more completely or precisely than symbols, but is limited because it can only be understood by people who read that particular language. Other studies (Sunyavivat and Boonyachut, Reference Sunyavivat and Boonyachut2013; Hashim et al., Reference Hashim, Alkaabi and Bharwani2014; Lee et al., Reference Lee, Dazkir, Paik and Coskun2014) also suggested that the information communication can be increased by the symbolic information in comparison to the text, as they are more prominent and attractive to the navigators. However, other studies (Mollerup, Reference Mollerup2009; Boonyachut et al., Reference Boonyachut, Sunyavivat and Boonyachut2012) investigated the impact of textual directions and found it more influential in impacting people's wayfinding behaviour. In addition, other studies (Santa, Reference Santa1977; Collins and Lerner, Reference Collins and Lerner1982; Paivio, Reference Paivio1986; Lehto, Reference Lehto1992) discussed the relationship and comparison of symbolic information with textual information and suggested that the text has the volume of information, but symbols can be perceived better and quicker amongst the navigators of same cultural backgrounds. Toms and Campbell (Reference Toms and Campbell1999) has also suggested that the cognitive processing of visual form happens faster than that of semantic content, and that form is prioritised over the content. In addition, the pictograms can be stored for a longer period in human memory, due to their quick meaningful understanding and appropriate level of complexity (Abdullah and Hübner, Reference Abdullah and Hübner2006). The level of complexity can decrease the legibility of the pictogram, as the comprehension of the providing information becomes difficult for the human mind to store and process. Pictograms can control the amount of added information while being designed to enhance legibility and wider understanding (Wolff and Wogalter, Reference Wolff and Wogalter1998; Mahmoud, Reference Mahmoud2015). Hence, the textual information may have detail amounts of knowledge but require the understanding of the respective language, whereas pictograms are easy to understand and long-lasting on memory, but require a substantial cognitive effort in deciphering the information.
1.3. Footprints of culture and individual differences
Culture has a strong influence on human thinking style and ascribed behaviours towards wayfinding tasks and performances. Culture can influence the cognitive style rather more the existence of specified processes to deal with daily life problems (Dasen, Reference Dasen2018). Due to the differences in cognitive style and comprehension abilities, signage information design can achieve a different levels of understanding amongst a variety of users. The signage graphics and pictograms may be perceived differently across cultures due to their specified way of thinking and different level of associations (Mahmoud, Reference Mahmoud2015). Foster and Afzalnia (Reference Foster and Afzalnia2005) investigated comprehension of symbols and reported insufficient research for cross-cultural differences. Due to the mentioned lack of research knowledge, it is important to test the signage efficiency and ability to transfer information across the range of cultures to make the design components universally acceptable. Correspondingly, Hashim et al. (Reference Hashim, Alkaabi and Bharwani2014) insisted on the cross-cultural evaluation of signage design within different environmental settings as well as with individual differences. The success of information delivery by signage is dependent on the surrounding environmental settings, layout plans and lighting conditions.
Consequently, multiple studies (Salmi, Reference Salmi2007; Lee et al., Reference Lee, Dazkir, Paik and Coskun2014) investigated the signage design understanding amongst the range of cultures within healthcare institutional settings. The reported data in those studies from three distinctive cultures provided several interesting insights based on the complexity, association of signage-pictograms and symbolic information. According to these studies, some pictograms are understood by all users, whereas with others it is difficult to understand the desired information. Healthcare settings require careful consideration of the usage of wayfinding information. A loss of time due to wayfinding problems in a healthcare setting can, at worst, lead to loss of life, and even at best it leads to a significant drain of resources from primary healthcare activities (Zimring, Reference Zimring1990). The usage of universal symbols and multilingual textual information is preferred in the healthcare settings due to the critical importance of inside wayfinding. There is small number of symbols and pictograms that have been developed to achieve the widest understanding across the globe (Tijus et al., Reference Tijus, Barcenilla, De Lavalette and Meunier2007). Although the universal understanding is seemingly impossible due to almost uncountable diversities, understanding can be anticipated through exploring the common platforms of experiences. However, some studies (Shim and Paik, Reference Shim and Paik2003; Rousek and Hallbeck, Reference Rousek and Hallbeck2011; Pati et al., Reference Pati, Harvey, Willis and Pati2015) have investigated a similar concept and came up with a solution of adding the descriptive text with pictograms to ease the cognitive process of information gathering and understanding from signage. The symbols have been developed and tested on a larger population for comprehensibility and then standardised by the organisations (ISO 16069, 2004). This suppressed the problem; however, there is still a need for understanding the language in conjunction with the symbols.
The wayfinding information gathering and understanding through signage depends on several other factors than cultural variations. Individual differences, such as age, gender, education level, literacy and physical disability, can affect the signage interpretation along with the accessibility. There are also changes in human cognitive abilities with age (Devlin, Reference Devlin2014) as well as with gender differences (De Goede and Postma, Reference De Goede and Postma2015; Hund, Reference Hund2016). The signage interpretation can be different because of the evolution in choice and preference of colours, designs and complexities with ageing, especially if the surrounding environment is complex and the wayfinding information is difficult to understand, i.e. institutional specific (hospitals, universities and other public sector institutions). The level of education of the viewer can also be an influential factor, as with the increased level of literacy there is an increase of cognitive abilities as well as symbolic association.
Hashim et al. (Reference Hashim, Alkaabi and Bharwani2014) suggested performing the research on signage interpretation by the participants of different cultures, age and education background. There is a critical need for such research on signage design and its understanding across different cultures and individual differences to develop and improve the guidelines for culturally consistent signage graphics. As per the standards maintained by ISO (ISO 9186-2, 2008) and the United States of America (ANSI Z535-2011), the signage should be interpreted correctly by 67% and 85% of the users, respectively, in order to claim it universal understanding. Institutions such as universities situated in dense urban areas are offering fused facilities and shared nature of resources, along with the complex spatial planning. Abu-Ghazzeh (Reference Abu-Ghazzeh1996) investigated the legibility of a university campus for newcomers and suggested that the wayfinding can be a crucial task where environmental settings are homogenous. The homogeneity of the environment makes it difficult to memorise and plan a route even for the experienced users. The complex environment impacts the user's wayfinding behaviour and the need for easy acquisition of wayfinding information. The institutional-oriented signage design like university campuses should be one of the primary focuses of cross-cultural research, having been neglected in previous studies (Iftikhar et al., Reference Iftikhar, Shah and Luximon2020b). Such cross-cultural studies will help in suggesting the cultural limitations for the designers and help them to develop the inclusive system of wayfinding design.
To obtain the environmental information through signage, users must perceive the information correctly, regardless of individual and cultural differences. Certain variables, consisting of colours, colour coding and volume of information, are influential in signage design and preferences. To explore the impacts of the mentioned variables from the existing literature, the following research questions have been developed:
RQ1 Do users prefer signage colour if it is aligned with the institutional visual identity?
RQ2 What is the cultural difference between collectivists and individualists for the preference of monochromatic and multichromatic colour-coded signage information in the complex environments?
RQ3 What volume of signage information is preferred for easy understanding across two distinctive cultures with low environmental legibility?
The respective signage designs have been generated with varying levels of information content and colour types to explore the users’ preferences while navigating in complex environments.
2. Method
This study explored the cultural and individual influences on user preference of wayfinding signage design in a spatially complex university campus. The study was conducted through an internet-based questionnaire by the participants from Hong Kong and Pakistan. Cluster and convenience sampling have been used in obtaining the data from participants. Based on the number of students from both regions, the appropriate sample size has been identified (Conroy, Reference Conroy2015). A total of 170 students and general university campus visitors participated in the study and expressed their preferences regarding the design of wayfinding signage. The visuals of signage design based on requisite research variables were especially designed and used to investigate the user preferences. The questions related to design preferences were asked by providing four options of design visuals, followed by a question related to the reason for the stated preference. The collected data was statistically analysed for any correlation between cultural and individual differences in wayfinding design preference. Before data collection, ethical approval from the concerned institutions was obtained and the relevant protocol was followed as per the provided guidelines.
2.1. Questionnaire construction
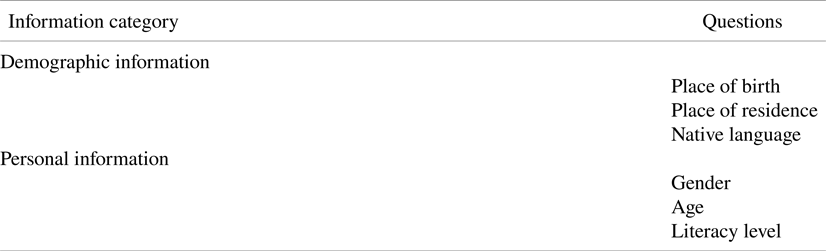
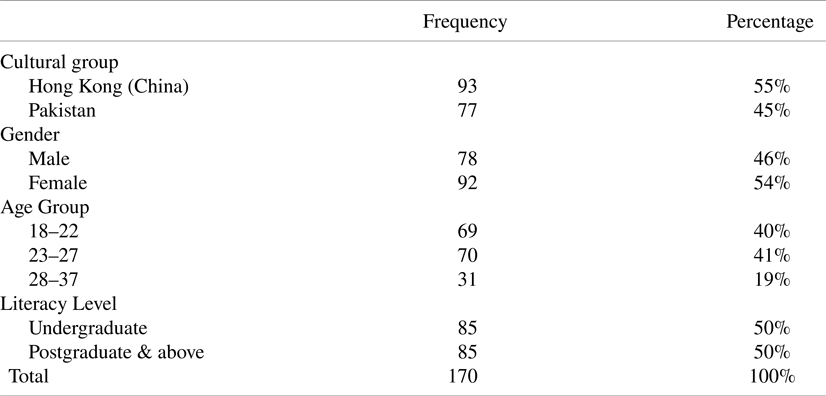
The internet-based questionnaire was constructed to gather cross-cultural and individual-related information from participants. The questionnaire was constructed with two integral parts, consisting of participants’ demographic/personal information and the signage preferences. For the first segment (Table 1), the participants were asked about their demographics, along with the personal information necessary to identify them as a respective group as practised in previous studies (Olmstead, Reference Olmstead, Zwaga, Boersema and Hoonhout1999; Chu and Martinson, Reference Chu and Martinson2003; Joy et al., Reference Joy, Yien and Chen2016; Trisnawati and Sriwarno, Reference Trisnawati and Sriwarno2018). The participants were asked about their place of birth, place of residence and native language to identify their distinctive cultural group. Participants were segregated in the cultural groups of Hong Kong China and Pakistan based on the answers. The Hong Kong (China) group included the participants who have mentioned Mainland China or Hong Kong as their place of birth and residence along with Cantonese or Mandarin as their native languages. The participants who identified Pakistan as their place of birth and residence and Urdu as their language were included in the Pakistan group. The participants were also asked about their gender, literacy level and age to investigate those individual differences in campus signage preferences.
Participant information in questionnaire construction

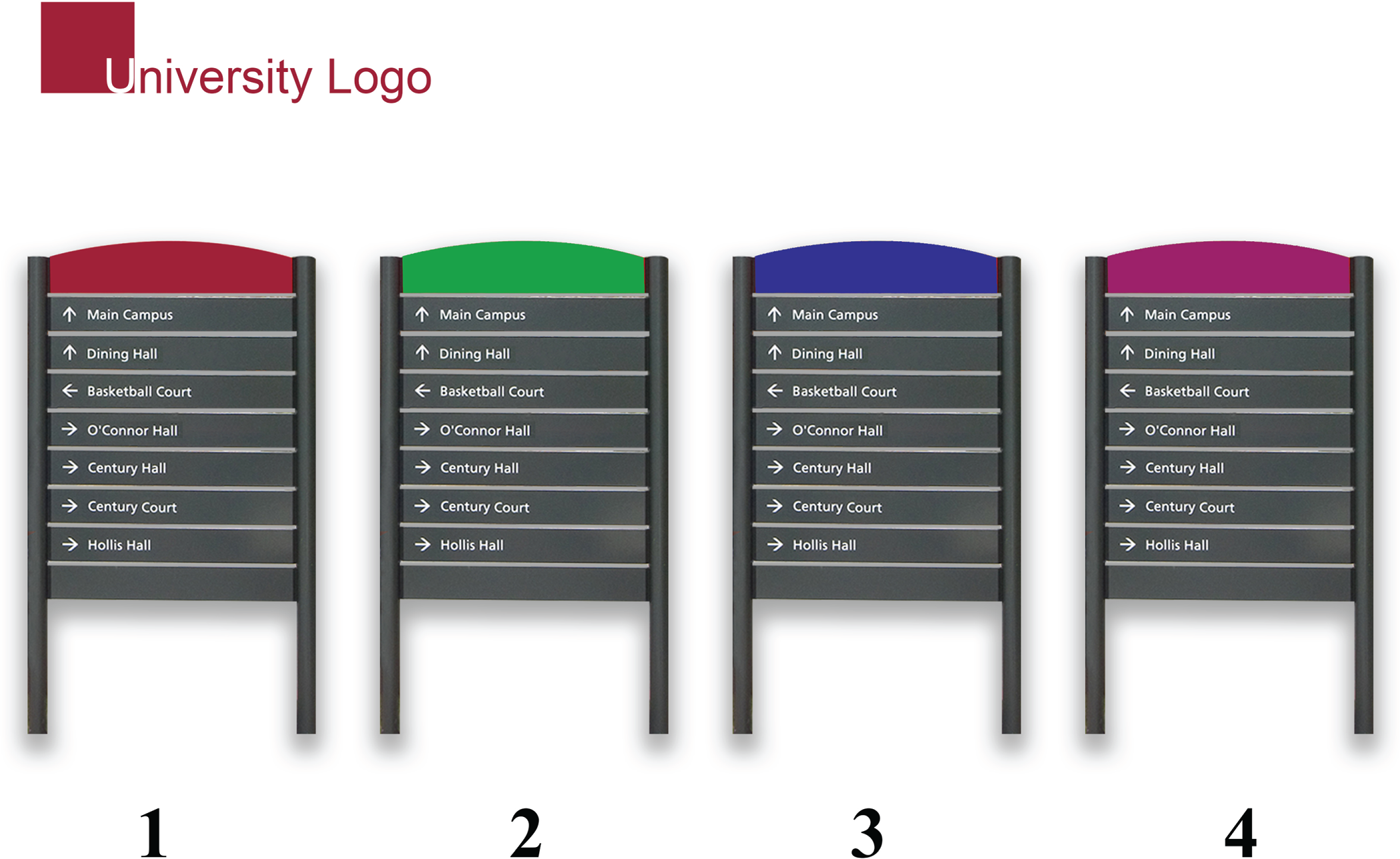
The further segment of the online questionnaire had three questions related to signage graphics exploring the users’ preference of signage design and information content. The questions were designed based on signage as a visual identity, information colour coding and the aggregate of information. The first signage question as depicted in Figure 1 was designed to investigate the role of wayfinding design as a visual identity and users’ preferences for environmental information while roaming on the university campus. The question was designed to investigate the anticipated impacts of signage design on user's preference as depicted in previous studies (Rooke et al., Reference Rooke, Tzortzopoulos, Koskela and Rooke2009; Leonard et al., Reference Leonard, Verster and Coetzee2014) where information design and its standardisation had been suggested for wayfinding efficiency inside a building. The four designs of signage in the first question (Figure 1) have been delineated containing a similar set of wayfinding information but with the difference of colours in the signage top plate. The first colour option was in line with the university colour theme and the other three were signage colours used in the wide range of university campuses situated in Hong Kong and Pakistan. The participants were asked which signage colour would be more suitable to be placed in the university, whereas the official colour was provided in the university logo.
Signage design as a visual identity

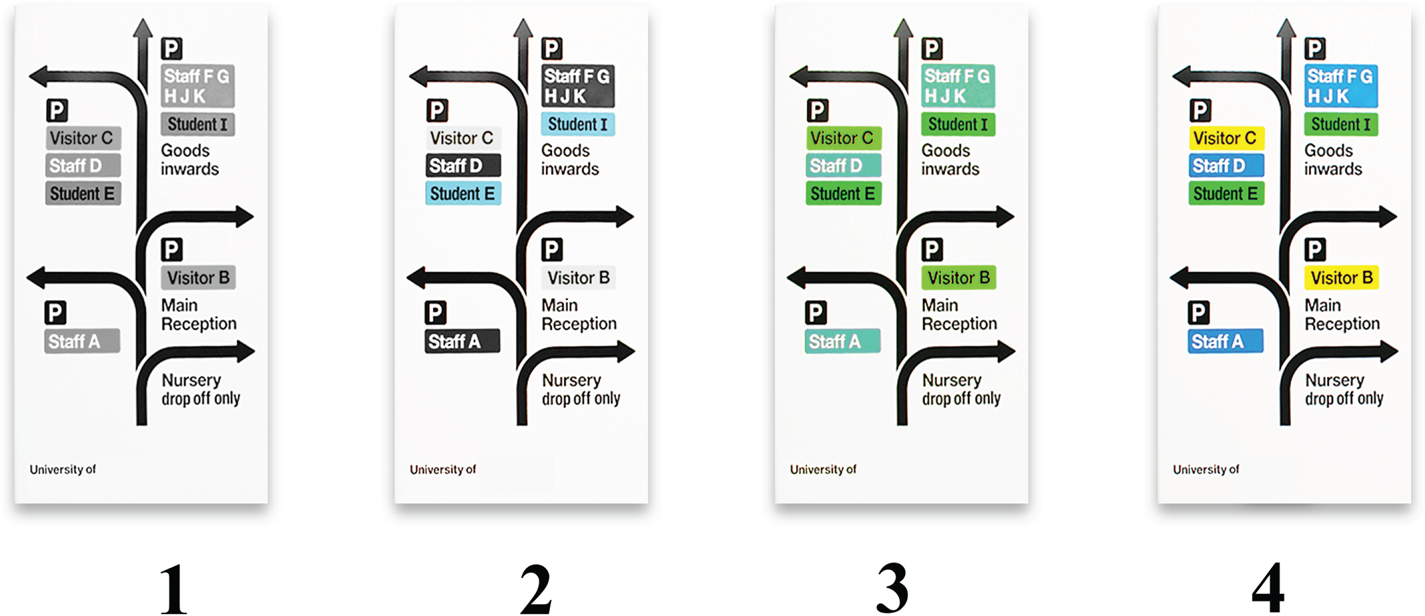
The second question (Figure 2) was designed to explore the effects and efficiency of colour coding in delivering the wayfinding information to the requisite users. Colour-coded information has a strong impact on a user's sense of perception, attention and identification of the relevant information. An investigation by Tzeng and Wang (Reference Tzeng and Wang2011) explored the mentioned influences on human wayfinding performance, particularly in university libraries where the environmental information is voluminous. The results demonstrated significant influences on the wayfinding performance, as the information was easy to read and identified by the navigators. Conversely, another study (Delvin and Bernstein, Reference Delvin and Bernstein1997) demonstrated no significant effect of colour coding in maps on wayfinding performances. In the question for the current study, four information graphics as shown in Figure 2 were designed, starting with greyscale or mono-colour coding to multicolour coding for the wayfinding information. The respondents were asked to identify their signage preference to be placed in the university, whereas the four colour-coded options were provided based on mono to multicolours.
Colour coding in signage

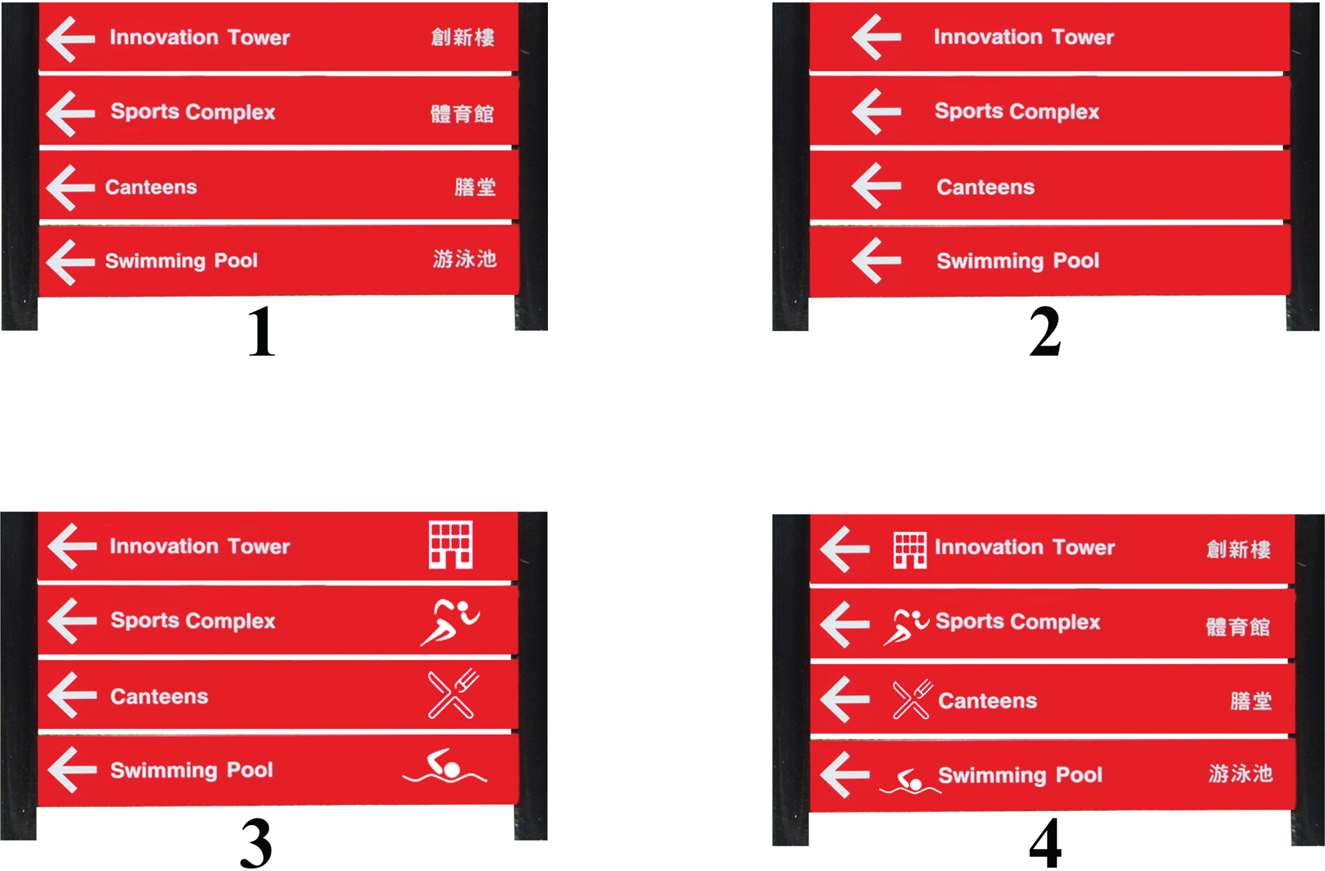
The third question (Figure 3) also contained four types of signage graphics, each having different information volume using dual language along with the symbolic representation. Previous studies (Kuo, Reference Kuo2003; Scialfa et al., Reference Scialfa, Spadafora, Klein, Lesnik, Dial and Heinrich2008; Joy et al., Reference Joy, Yien and Chen2016) suggested the reduction of words for precise and effective information. They also suggested increasing the negative areas for breathing space in design, which is influential in attracting the user's attention and increasing comprehension. For the investigation of this user preference, four signage designs were developed with different combinations of language and pictograms consisting of dual language (English–Cantonese for HK, English–Urdu for Pak), single language, single language–pictogram and dual language–pictogram. In both regions, English is the official language, and Cantonese and Urdu are the local languages of respective groups. Cantonese scripts are written in left-to-right as in English, whereas Urdu is written in the opposite direction. The participants were asked about their ease of understanding the signage information being placed in a university campus, as the level of information details vary using dual language and wayfinding pictograms.
Signage information volume

2.2. Data collection process
For data collection, participants were invited to complete an online questionnaire from Hong Kong and Pakistan. The invited respondents were generally university students and campus visitors who were contacted through the online service of Google forms to gather the information. For this purpose, reputed university campuses were selected in Hong Kong and Pakistan because these institutions attract students and visitors from various cultural backgrounds. A total of 200 participants took part in the investigative study of signage design preferences. For this study, inclusion criteria were developed based on the core cultural groups and the completion of responses. A total of 170 responses were selected after satisfying the inclusion criteria for respective cultural groups belonging to either Hong Kong or Pakistan. The main respondents were students of the respective universities, along with the general visitors of the campus. The questionnaire was conducted in the English language, which is widely accepted and spoken in both places.
2.3. Data analysis process
To perform the data analysis, the gathered data was arranged in respective independent cultural groups of Hong Kong and Pakistan. The participants having Mainland China as their place of birth were considered in the same cultural group of Hong Kong. For the exploration of individual difference, the participants were independently categorised based on age, gender and literacy level. Table 2 details these categorisations. After the required classification necessary for analysis, the data was imported into Microsoft Excel for descriptive analysis, followed by statistical analysis using SPSS software.
Summary of general demographics

The required information was gathered by the participants using the different visual options of signage graphics and open-ended explanation questions. As the participants had been independently grouped based on cultural and individual differences, Pearson's chi-square test has been considered appropriate (McHugh, Reference McHugh2013). For the reasoning part, the data mining technique was applied and categorised the findings into relevant classifications (Friedman, Reference Friedman1998) through identifying the sequential pattern technique. These tests were used to explore the anticipated cultural differences for the design and visual preference of campus wayfinding.
3. Results
The initial descriptive showed several adequate participants in each group related to cultural and individual differences to perform the statistical analysis. After applying the initial inclusion criteria, approximately 170 (84%) responses were selected for inclusion in the study. The details of the initial descriptive in Table 2 provided a reasonable distribution of participants amongst both cultural groups, as well.
3.1. Initial descriptive statistics
The summary of the general demographics shows a detailed distribution of participants belonging to the independent sample group. The response rate from the participants of Hong Kong was higher in comparison to the Pakistani participants, at 55% and 45%, respectively. In addition, a similar proportion exists for the group based on gender, i.e. females around 54% and males around 46%. For the further exploration of individual differences, the participants’ ages have also been categorised in the group of four starting from 18 years to 37 years, with five years of gap in each group. The collected data showed fewer members falling in the fourth group of 33–37 years; therefore, the group was merged with the third group of 28–32 years for maintaining a reasonable range in the individual group for statistical analysis. The major concentration (81%) of the participants was in the first two groups (18–22 years, 23–27 years), as the respondents were majorly university students. The level of literacy was another measurable parameter regarding the signage visual preference. The participants were asked about their current level of education, and from the collected data, two categories were formed, consisting of below undergraduate and postgraduate and above. These two categories had an equal number of participants (85) in each group. After the general categorisation, the data was imported in SPSS for the further definition of research variables regarding the preference of signage design.
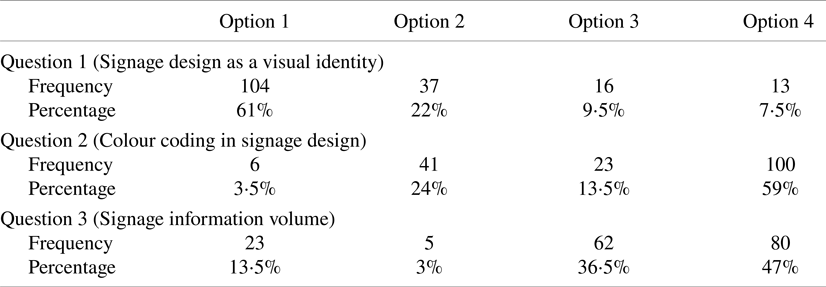
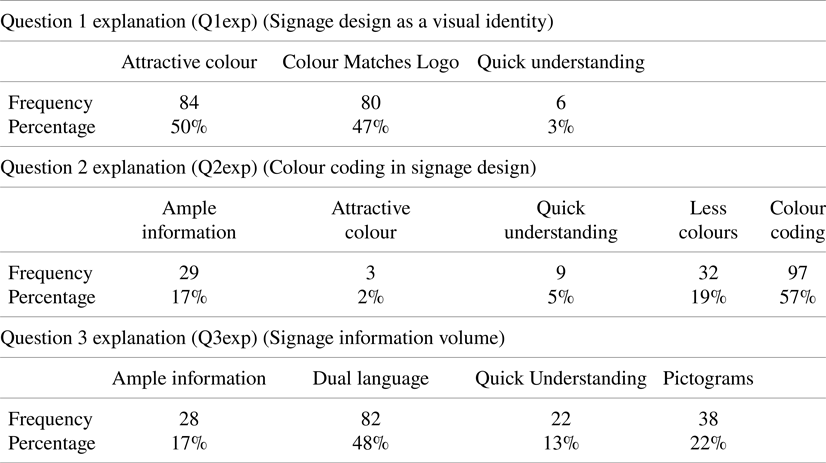
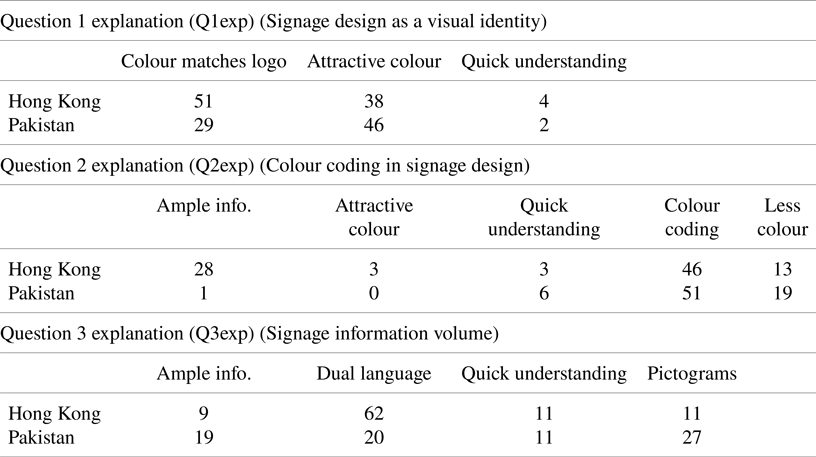
In the second part of the online questionnaire having questions related to the design of signage information, the responses were received based on the user's preferences. For signage as a visual identity, the highest preference was received for design option 1, having 61%, followed by option 2, which is 22%, as depicted in Table 3. The second question was related to the preference in colour-coding of the wayfinding information, and the users preferred design option 4, with 59%, along with option 2, with 24%. In the question related to signage information volume, the responses were of distributed preferences, i.e. 47%, 36⋅5% and 13⋅5% for option 4, 3 and 1, respectively. Table 3 presents a detailed summary of the responses concerning design preferences by the participants. Every question of design-related preferences had a follow-up question related to the explanation of the participant's selected choice. The explanatory questions were open-ended; therefore, the information was gathered and data mined by identifying the sequential patterns. Furthermore, the whole responses were categorised based on the identified patterns, as mentioned in Table 4.
Summary of questions responses

Summary of questions explanation responses

3.2. Cross-cultural comparison
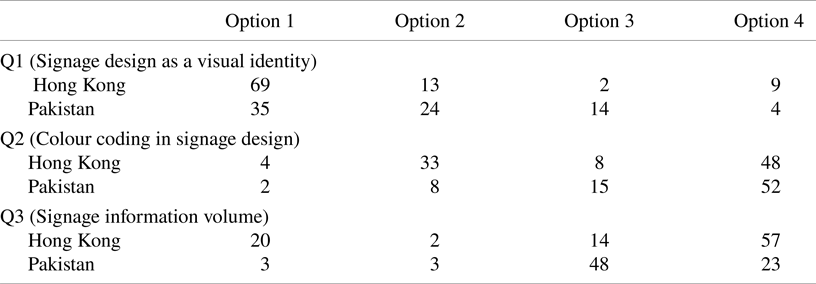
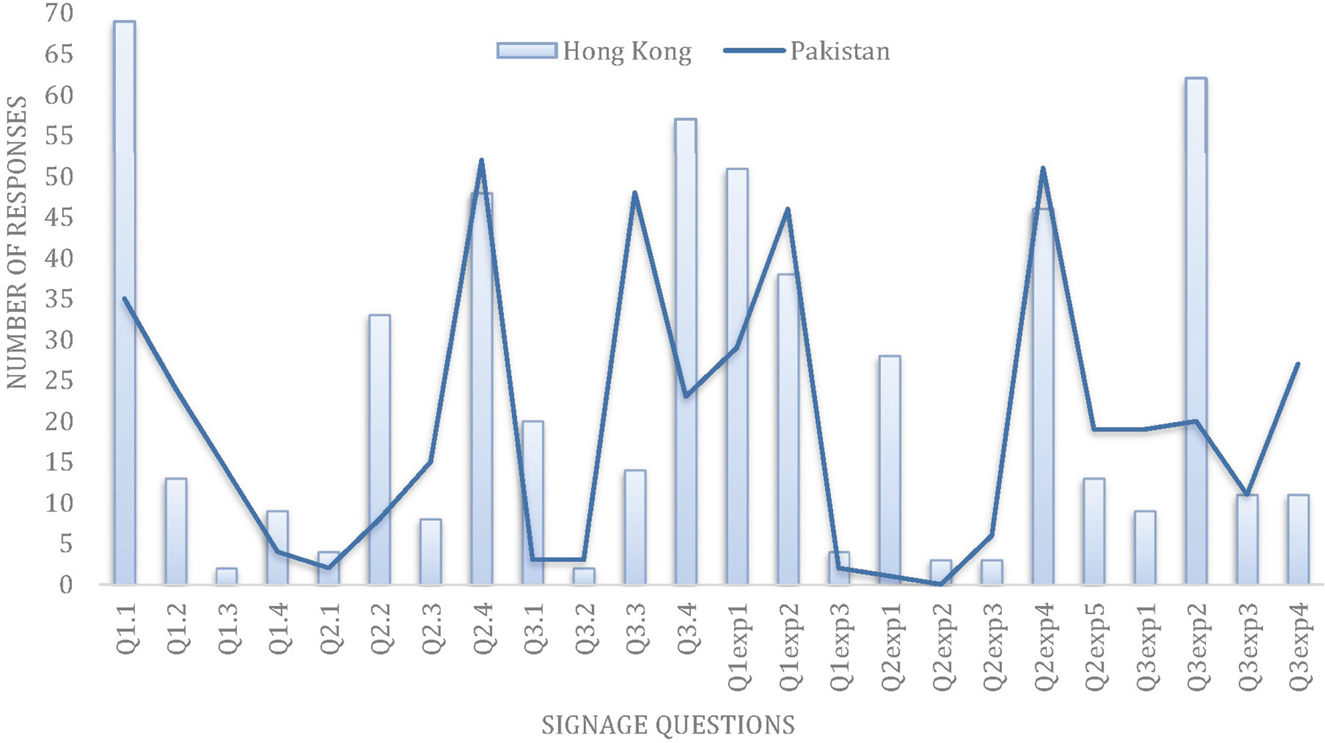
For the exploration of cross-cultural differences in signage preferences, the data was organised based on participants’ cultural background. In the questions related to signage design as a visual identity, a substantial number of respondents (69, 13) from Hong Kong have selected the first and second option, respectively. The explanations for the particular selections have been provided with the relevance of the university's official colour and attractiveness. Conversely, the participants from Pakistan had distributed preferences in signage selection. The first, second and third options were selected by 35, 24 and 14 Pakistani participants, respectively, as demonstrated in Tables 5 and 6. The participants from Pakistan selected the requisite options due to the preference given to colour attractiveness over colour-matching quality with the university's official theme. For the statistical analysis of the correlation between the responses of both cultural groups, the Pearson's chi-square test was applied. The significant relation was recorded between the two cultural groups for questions related to signage design as a visual identity, χ 2 (3, 170) = 24⋅016, P = 0⋅000. Whereas the explanation for the respective choice also had a significant relation, χ 2 (2, 170) = 6⋅026, P = 0⋅049.
Summary of cultural differences in design selection

Summary of cultural differences in questions’ explanation

While answering the second question based on the colour-coded information on the signage, the respondents also had a difference of opinion due to cultural influences. A substantial number of respondents from both groups chose the fourth design option with multicolour information coding, followed by option 3 for Pakistani participants and option 2 for Hong Kong participants. After multicolour-coded signage, Pakistani participants preferred the presence of colour for information coding by choosing the monochrome design option with differentiating shades and tints of the same colour. On the other hand, the respondents from Hong Kong preferred the greyscale design option, with the presence of a single colour with monotone. A significant relationship was found between both cultural groups for the choice of colour-coded signage design options, χ 2 (3, 170) = 16⋅844, P = 0⋅001. Due to the difference present in the design choices, a significant difference has also been recorded in the provided explanation for the respective choices, χ 2 (4, 170) = 29⋅274, P = 0⋅000. The high value of phi (0⋅415) in Table 7 has also demonstrated the significance of relationship amongst both cultural groups. The third set of design options was designed based on the density and modes of information necessary for wayfinding tasks. In this set, the first two design options were based on the language provided information.
Summary of cultural differences in questions’ explanation

* P < 0⋅05 for Pearson's chi-square test.
In addition, the other two design options were designed by having the consideration of language and symbolic information together. A simple statistical comparison in Figure 4 was produced to graphically depict the cross-cultural differences in the preference of signage design. The participants from Hong Kong preferred the fourth option, followed by the first and third option. The participants from Hong Kong were more concerned about the information provided by the dual language. In contrast, the participants from Pakistan considered pictograms as their reason of choice, followed by the presence of dual language. Several respondents from Pakistan also described the ample information volume as a reason for selecting design option 3. Pearson's chi-square test identified a significant relationship between the two cultural groups for the selection of signage design, χ 2 (3, 170) = 44⋅751, P = 0⋅000. The high value of phi (0⋅513) also demonstrated the strength of correlation between the respondents from Hong Kong and Pakistan. In addition, a strong relationship between both participatory groups was also found when comparing the explanation of these responses, χ 2 (3, 170) = 30⋅586, P = 0⋅000. A majority number of Hong Kong participants selected the Q3 option 4 due to its detailed information layout. The group of Hong Kong mentioned ‘use of dual language’ as the main reason for their selection, whereas Pakistani participants selected the design options due to the presence of pictograms.
Simple statistics of cross-cultural comparison

3.3. Individual influences
In the online questionnaire, the respondents were asked about some individual related question, including gender, age and education level, for exploration of individual differences in the preference of wayfinding signage design. To identify the gender-related differences, two groups based on participants’ gender were formed. For analysing the correlation between males and females, the chi-square test was applied (Table 8). In this study, no significant relationship between males and females was recorded for analysing the preference of campus signage design.
Statistical analysis of gender differences

Furthermore, this study was required to explore the age-related differences in the signage preference as identified in previous literature. Initially, the participants were arranged in four age categories, starting from 18 years up to 37 years, with a difference of five years in between. The last two age groups have a small number of students; therefore, these two categories were merged to maintain an ample number of participants in each group. Table 2 lists the three age categories for the statistical analysis to explore the correlation between them. The chi-square test identified no significant relationship between the age categories (Table 9). The respondents perceived the wayfinding signage irrespective of the age categories. The age gap was smaller in categories, due to which no significant findings have been recorded. Further study may require larger differences of age in groups to depict the difference in visual preference.
Statistical analysis of age differences

Correspondingly, the next identified category was established based on the level of the participant's education. The respondents were grouped due to their reported level of education. Two categories were established: in the first category, the participants had an education level equal to undergraduate or below, and in the second group, participants had a postgraduate and above education level. The Pearson's chi-square test was applied for further exploration of significant correlation between both categories. As a whole, there were no statistically significant relationships between education level categories recorded (Table 10), except in the question related to the explanation of the information volume, χ 2 (3, 170) = 10⋅208, P = 0⋅017. The participants with the education level of undergraduate and below preferred the signage design option 3 and 4 for Q3, due to simplicity, dual language and pictograms. However, participants with a higher education level (postgraduate and above) choose the options due to the presence of dual language. We can infer from this finding that people with a higher education level prefer written information in comparison to the pictograms and density of information in the design of wayfinding signage.
Statistical analysis of literacy level

* P < 0⋅05 for Pearson's chi-square test
Similarly, in the comparison for Q2 where different levels of information colour coding were provided, the participants with a higher education preferred less colour-coded information, while the other group of the participants prefers colour-coded designs, as they are more attracted to the signage's colourful designs. Although the suggested relationship is not statistically significant, this insight can be seen in the slightly higher phi value (0⋅198), χ 2 (3, 170) = 6⋅646, P = 0⋅084. The respondents have also described the above insights in their explanation responses for the respective selection. The group with the lower education level described the factor of colour coding as a major driver for their selection, while the other group mentioned other reasons as well, such as the presence of less colour and ample amount of information.
3.4. Correlation analysis
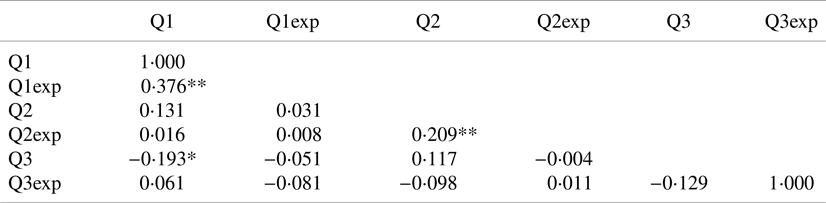
In addition to the relationship of cultural and individual differences, the acquired data was further explored for the correlation between the questions by applying the Spearman's correlation analysis. The respective analysis produced some interesting insights based on the individual's preferences other than the previously mentioned relationships in Table 2. A statistically significant correlation was observed and demonstrated in Table 11 between the Q1 and Q1exp depicting the choice of signage design and its respective explanations. The participants gave more preference to design option 1 due to its colour matching with the university theme than the attractiveness of colour. On the other hand, those participants who chose design option 2 in Q1 gave the explanation in favour of using the attractive colour in the design of campus wayfinding signage. Similarly, the respondents who chose the signage design option in line with the university theme preferred design option four in Q3 related to a greater volume of information. Through this study, we can infer that if the signage is designed as an institutional visual identity, then people prefer the large volume of wayfinding information along with the symbols.
Spearman's correlations

** Correlation is significant at the 0⋅01 level (2-tailed)⋅
* Correlation is significant at the 0⋅05 level (2-tailed).
Subsequently, a statistically significant correlation has been found between Q2 and Q2exp. The participants who preferred the design option 4 in Q2 presented colour coding as the main reason for the choice. On the other hand, the remaining design options in Q2 was selected profoundly due to the usage of fewer colours. We can deduce that participants perceived colour-coding information better but with less usage of colours in the information coding, especially when the signage design must be installed in the spatially complex university settings.
4. Discussion
Being exploratory, this study demonstrated a substantial amount of differences related to the cultural influences and individual diversities in the preference of university signage design. Multiple studies (Troncoso, Reference Troncoso2014; Ahmed, Reference Ahmed2015; Iftikhar et al., Reference Iftikhar, Asghar and Luximon2020a) explored the cultural influences on human wayfinding behaviour to facilitate institutional settings. For this study, the aim was to investigate the cultural influences on user preferences by comparing participants from Hong Kong and Pakistan. Statistically significant differences have been recorded for the preference of the signage design as a visual identity to the institution. Studies (Hohmann, Reference Hohmann2001; Leonard et al., Reference Leonard, Verster and Coetzee2014) have suggested that the standardisation in the signage design and colours with institutions enhance visual understanding.
The suggested recommendation was true for the participants from Hong Kong, because they selected the colours in accordance with the university theme and logo. However, the participants from Pakistan also recommended the usage of attractive colours in signage design. As per their suggestion, the signage graphics should not necessarily be in line with the overall institutional theme. This study also explored that the colour coding of the information in university wayfinding signage should be kept within an adequate range of colours. Respondents from both cultural groups suggested the usage of information colour coding, however the respondents prefer the usage of fewer colours. Moreover, the participants from Hong Kong also preferred signage design with grey and single-colour coding, while the Pakistan group preferred the usage of colour's tints and shades rather than the usage of multiple colours. The mentioned cultural differences have been recorded for the user preferences of signage design and may not be a reliable indicator for the cultural differences in wayfinding behaviour.
Furthermore, critical differences have also been recorded for the volume and type of signage information. Studies (Wilkinson et al., Reference Wilkinson, Cary, Barr and Reynolds1997; Mahmoud, Reference Mahmoud2015) suggest that the textual information can be easier to obtain than pictograms, as the text requires less cognitive effort to decipher the information. Our findings are consistent for the participants from Hong Kong with the cited studies; however, the Pakistani participants perceived the information better in the form of pictograms and symbols. The group of Hong Kong prefers the design of signage with a detailed amount of information, while the Pakistan group prefers only the necessary and basic information.
The results also depicted the decreased signage dependency by the Pakistani participants than the participants from Hong Kong. The cause of this could be that the Pakistani participants rely on obtaining verbal wayfinding information from passers-by. A similar study (Ahmed, Reference Ahmed2015) was conducted in the culturally similar and neighbouring country (India) of Pakistan for users’ preferred style of obtaining wayfinding information. The users relied more on obtaining verbal information rather than reading wayfinding signage. The significant difference in all of the questions depicted evidence of cultural diversity in the preference of signage design and was consistent with the previous study (Foster and Afzalnia, Reference Foster and Afzalnia2005).
This study further explored the gender differences in the preference of wayfinding signage design. According to the results, no significant gender differences have been recorded for questions 1, 2 and 3. The findings are considered to be consistent with the previous study (Lee et al., Reference Lee, Dazkir, Paik and Coskun2014), where no gender difference was demonstrated in the visual preference of signage information. Although previous studies (De Goede and Postma, Reference De Goede and Postma2015; Hund, Reference Hund2016) identified that the cognitive abilities differ with the change of gender, these cognitive differences were not significant enough in the comprehension of wayfinding signage information and design. For further exploration, the signage design preferences have been explored across the different categories of ages. The results have enunciated no statistically significant relationship between the different categories of ages for signage information design. Multiple studies (Head and Isom, Reference Head and Isom2010; Taillade et al., Reference Taillade, Sauzéon, Arvind Pala, Déjos, Larrue, Gross and N'kaoua2013) have investigated the age-related differences affecting the wayfinding performance and found it a significant driver for influencing user preferences. However, the findings in our study depicted no relationship between the age groups.
In addition, this study explored the relationship of education level influencing the preferences in wayfinding signage. In the previous literature, Joy et al. (Reference Joy, Yien and Chen2016) identified that the level of education can be influential in affecting the user's sense of perception. In contrast, Dowse and Ehlers (Reference Dowse and Ehlers2003) investigated the said relationship and the findings were different, as the relationship was not statistically significant. In our exploration related to the signage preference, a significant relationship has been recorded in question Q3exp related to the volume and type of information in wayfinding signage design. The participants with lower literacy level preferred multiple types of information, in the forms of textual and symbolic references along with the preference given to minimal and effective environmental knowledge. Alternatively, the participants with higher literacy level preferred detailed textual information and the usage of dual language. This can be further interpreted, as the participants with higher education level are comfortable with the detailed textual knowledge rather than the usage of symbolic and pictographic information.
Furthermore, the Spearman's correlation test was been applied to investigate the detailed interrelationships of signage questions. The correlation analysis suggested that the institutional visual identity in signage design has an influence on the user's preferences. If the standardisation and visual identities had been incorporated, then the greater volume of information could be better understood amongst the users. Once a necessary level of familiarity in design and colours has been achieved, it becomes less distractive for wayfinders in receiving the environmental information. The obtained results for this study are consistent with the principle of signage design (Bao, Reference Bao2004) in the complex university settings. Colour coding of information on the wayfinding signage was also found to be instrumental in delivering the wayfinding information; however, our investigation suggests using monochromatic colours for coding, as it is preferred especially when the environmental legibility is poor and it is loaded with distractive information.
5. Conclusions
Searching for a destination in a complexly planned and multi-storey institutional environment is a strenuous task and requires a great deal of cognitive effort, environmental aids and route knowledge. The wayfinding aids can be of different types, ranging from signage to landmarks. The effectiveness of and dependence on signage for wayfinding information are quite evident in the previous literature, identifying the need for easy comprehension and standardised design of information content. The complexly planned university campuses need a good amount of research in this regard, as these campuses attract a large number of visitors with various individual and cultural diversities. This investigation explored the factors representing potential barriers for easy and standardised wayfinding design. This investigation found the cultural difference is a major driver in the disparity of obtained signage information. The participants from Hong Kong showed a preference for the design of signage in line with the institutional official colours and themes. In addition, preference was given to textual information, as it has been investigated in the previous studies to be less demanding of one's cognitive efforts. Conversely, participants from Pakistan were attracted to the attractiveness of signage design, colours and the symbolic information. The reason for this preference potentially lies in the variation of wayfinding culture for the Pakistani participants. Due to the less availability of functional signage design, the users can be more attracted to the other wayfinding information sources, such as verbal information, landmarks recognition etc. Due to this fact, they are not solely dependent on the signage information in obtaining environmental knowledge. It has been observed that symbols can play an important role in increasing the legibility and dependence on signage for both cultural groups. This inference can be true for the participants with varied level of education as symbolic or pictographic information can attract the users irrespective of education level. Moreover, future research should focus on the efficacy of existing symbols in developing environmental knowledge for wayfinding, along with providing the recommendations for improving the symbol design framework for complex environmental settings. The developed symbols can furtherly be tested in different environmental settings with varied level of spatial intricacy using computer simulations for mitigating the impact of environmental complexity.
Acknowledgements
The conducted study was supported by the UGC Funding Scheme (RL6A) from The Hong Kong Polytechnic University.