

Introduction
Corporate greenwashing derived its original meaning from the American hotel industry in the 1960s – ‘reuse your towels in order to save the environment’ (Kenton, Reference Kenton2020), as guests can see from the notices on the beds of hotel rooms today. In recent decades, a great number of firms are actively engaging in greenwashing (Delmas & Burbano, Reference Delmas and Burbano2011). Greenwashing misleads stakeholders in the supply chain (e.g., upstream suppliers and downstream customers) by environmental window-dressing behavior (Du, Reference Du2015), by which firms grab huge environmental benefits of products (services) and even government subsidies at the expense of stakeholders (Delmas & Burbano, Reference Delmas and Burbano2011; Du, Reference Du2015).
Greenwashing refers to the process of conveying the false impression or misleading information about how a firm and/or its products are eco-friendly (Du, Reference Du2015; Kenton, Reference Kenton2020). The Concise Oxford English Dictionary (Pearsall, Reference Pearsall2002) broadly defines greenwashing as ‘the behavior that an organization disseminates disinformation to present an environmentally responsible public image’. Referring to Kenton (Reference Kenton2020) and Pearsall (Reference Pearsall2002), greenwashing has broken through product- (service-) specific behavior. As a matter of fact, the ways of greenwashing have continuously expanded from specific items or dimensions by green advertising and marketing to greenwash the whole enterprise by public claims of eco- (earth- or environmental) friendliness and greenization (Chen & Chang, Reference Chen and Chang2013).
Corporate greenwashing has attracted special attentions from policymakers, nongovernment organizations (NGOs), researchers, and the public (Du, Jian, Zeng, & Chang, Reference Du, Jian, Zeng and Chang2018). Especially, scholars have examined the determinants and economic consequences of greenwashing (Delmas & Burbano, Reference Delmas and Burbano2011; De Vries, Terwel, Ellemers, & Daamen, Reference De Vries, Terwel, Ellemers and Daamen2015; Du, Reference Du2015; Laufer, Reference Laufer2003; Ramus & Montiel, Reference Ramus and Montiel2005; Testa, Boiral, & Iraldo, Reference Testa, Boiral and Iraldo2018; Walker & Wan, Reference Walker and Wan2012). Nevertheless, the research on the determinants and consequences of corporate greenwashing is still far from in-depth up to now. As far as the determinants of corporate greenwashing, most extant studies pay close attention to market, institutional, organizational, regulatory policies, and governance mechanisms, but they rarely touch on how macrolevel social culture and/or CEO-(manager) specific characteristics affect a firm's greenwashing behavior. Motivated by above gap in prior literature, our study explores the marital demography as an additional and important driver of eliciting corporate greenwashing.
For a long time, sociologists and social scientists have focused on social influences and economic consequences of the marital status (marital demography) because the divorce rate is closely associated with cultural values (Holden & Smock, Reference Holden and Smock1991; Ross & Mirowsky, Reference Ross and Mirowsky1999; Toth & Kemmelmeier, Reference Toth and Kemmelmeier2009). Divorce is validated to be related with extreme individualism (Naroll, Reference Naroll1983), and further the likelihood of divorce around the world is significantly higher in regions (countries) with individualistic cultures than for that with collectivistic cultures (Vandello & Cohen, Reference Vandello and Cohen1998, Reference Vandello and Cohen1999). As a matter of fact, the marriage–divorce ratio (the divorce rate) reflects macrolevel social culture – the commitment and responsibility to and the attitude towards the matrimony. More importantly, the marriage–divorce ratio embodies the extent of individualism within a region (state, province) (Vandello & Cohen, Reference Vandello and Cohen1999), which has been validated to inversely affect a firm's tendency towards environmental conservation (Husted, Reference Husted2005; McCarty & Shrum, Reference McCarty and Shrum2001; Price, Walker, & Boschetti, Reference Price, Walker and Boschetti2014). Furthermore, individualistic culture is more likely to elicit corporate greenwashing, compared to collectivistic culture (Berry, Reference Berry and Kim1994; Lim & Tsutsui, Reference Lim and Tsutsui2012; Tokar, Reference Tokar1997). Lastly, given the community isomorphism (Bies, Bartunek, Fort, & Zald, Reference Bies, Bartunek, Fort and Zald2007; Marquis, Glynn, & Davis, Reference Marquis, Glynn and Davis2007) and the ‘peer effect’ (Bursztyn, Ederer, Ferman, & Yuchtman, Reference Bursztyn, Ederer, Ferman and Yuchtman2014; Cao, Liang, & Zhan, Reference Cao, Liang and Zhan2019; Feld & Zölitz, Reference Feld and Zölitz2017), the effect of individualism-dominated social culture on greenwashing can be extended to firms within a community. As such, our study predicts that the divorce–marriage ratio, which can serve as the proxy for the marital demography and individualistic social culture (U.S. Bureau of the Census, 1996; Vandello & Cohen, Reference Vandello and Cohen1999), is positively related to the extent (likelihood) of corporate greenwashing.
According to Allen, Qian, and Qian (Reference Allen, Qian and Qian2005), Du, Jian, Zeng, and Du (Reference Du, Jian, Zeng and Du2014), and Williamson (Reference Williamson2000), when formal institutions fall behind corporate practices, informal systems play their important role in affecting corporate behavior. However, along with the continuous improvement of formal institutions (law), the impact of informal systems on corporate behavior will be weakened. In response, the impact of individualistic social culture embedded in the divorce–marriage ratio (an informal system) on corporate greenwashing is attenuated by China's Environmental Protection Law (CEPL) in 2015 (a formal institution).
Institutional background, prior literature, and hypotheses development
The marital demography in China
For thousands of years, given the effect of Confucian culture on the Chinese society, the structure within the family was extremely stable (Fei, Fei, Hamilton, & Zheng, Reference Fei, Fei, Hamilton and Zheng1992, pp. 87–93) and divorce was rare in China. Since the founding of the People's Republic of China, women had been given the unprecedented status, known as ‘Women can hold up half of the sky’ (Du, Reference Du2016), and thus the divorce has become common in China. According to China's National Bureau of Statistics (www.stats.gov.cn), in the mid-1980s, the average divorce–marriage ratio (divorce rate) was about 6.82% (.68‰), but the highest ratio (rate) at the province level was 34.99% (3.64‰).
Along with China's deepening of the Reform and Opening-Up Policy, the weakened influence of Confucian culture on the Chinese society, and the impact of foreign culture, the mean (maximum) values of the divorce–marriage ratio and divorce rate in 1999 reached 16.90% (35.62%) and 1.11‰ (3.29‰).Footnote 1 In 2017, the average divorce–marriage ratio (divorce rate) was 41.64% (3.14‰), along with the maximum value of 68.97% (5.20‰). Overall, the average divorce–marriage ratio (divorce rate) in most provinces of mainland China embodies the steady increased tendency. Figure 1a (1b) outlines the changing tendency of the divorce–marriage ratio (divorce rate) from the mid-1980s to 2017, revealing the marital demography in contemporary China.
The distribution characteristics of marital demography. (a) The tendency of the divorce–marriage ratio during the period of 1985–2017 (unit: %; the shaded part denotes the sample period), (b): The tendency of the divorce rate during the period of 1985–2017 (unit: ‰; the shaded part denotes the sample period), (c): China's provincial distribution of the divorce–marriage ratio in 2017 (unit: %), (d): China's provincial distribution of the divorce rate in 2017 (unit: ‰), (e): China's provincial distribution of the mean value of the divorce–marriage ratio during the sample period (2008–2017; unit: %), (f): China's provincial distribution of the mean value of the divorce rate during the sample period (2008–2017; unit: ‰).
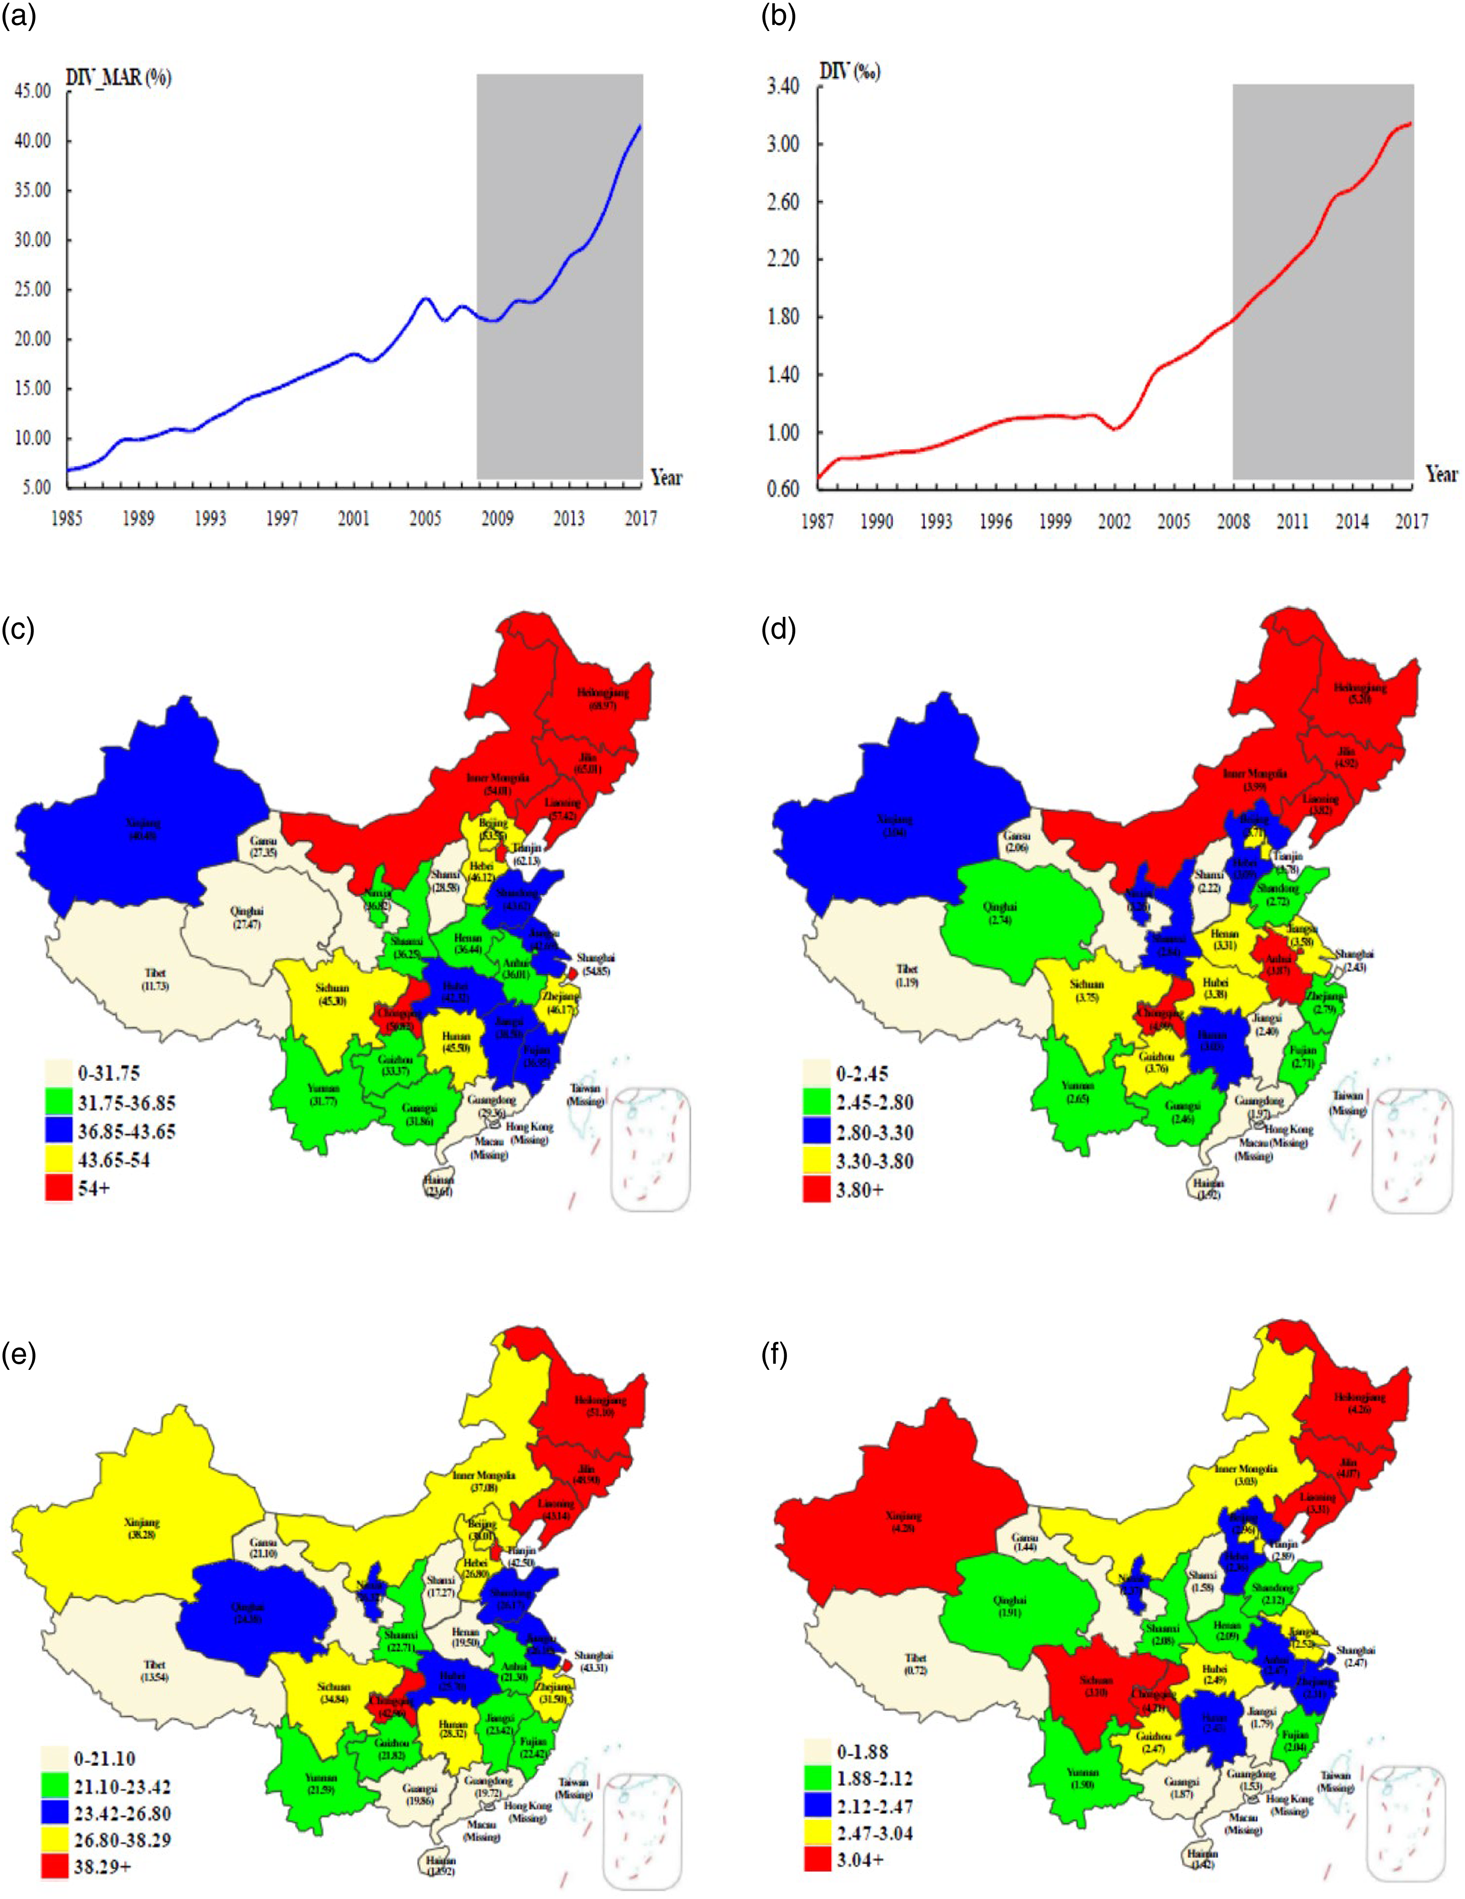
Given the close relation between marriage (divorce) and collectivism (individualism) (Vandello & Cohen, Reference Vandello and Cohen1999), the continuous upward divorce–marriage ratio (divorce rate) in the past decades embodies the change in social culture. The Chinese society is always characterized with higher (lower) extent of collectivism (individualism) (Chen, Meindl, & Hunt, Reference Chen, Meindl and Hunt1997; Earley, Reference Earley1989), but this impression seems to be undergoing the challenge (Koch & Koch, Reference Koch and Koch2007). In this regard, the divorce–marriage ratio (divorce rate) reflects the dynamic and evolving attitude and the weakened responsibility towards the matrimony (family) (Du, Reference Du2016; Vandello & Cohen, Reference Vandello and Cohen1999).
Motivated by above settings, our study aims to investigate whether individualistic social culture – which is embedded in increasingly high divorce–marriage (divorce) ratio – affects greenwashing.
Environmental conservation and greenwashing in China
Greenwashing originated from the American hotel industry (Kenton, Reference Kenton2020), but the hotels in the world just enjoy the benefit of lower laundry costs and do not conduct sufficient eco-friendly activities. Inspired by the hotel industry, a variety of corporations in various industries claim that their products, services, and even the whole enterprise are environmentally friendly (Du, Reference Du2015). However, a great number of corporations are only talk the talk rather than walk the walk. Against this context, corporate greenwashing becomes increasingly prevalent today (Greenpeace USA, 2013; Parguel, Benoît-Moreau, & Larceneux, Reference Parguel, Benoît-Moreau and Larceneux2011).
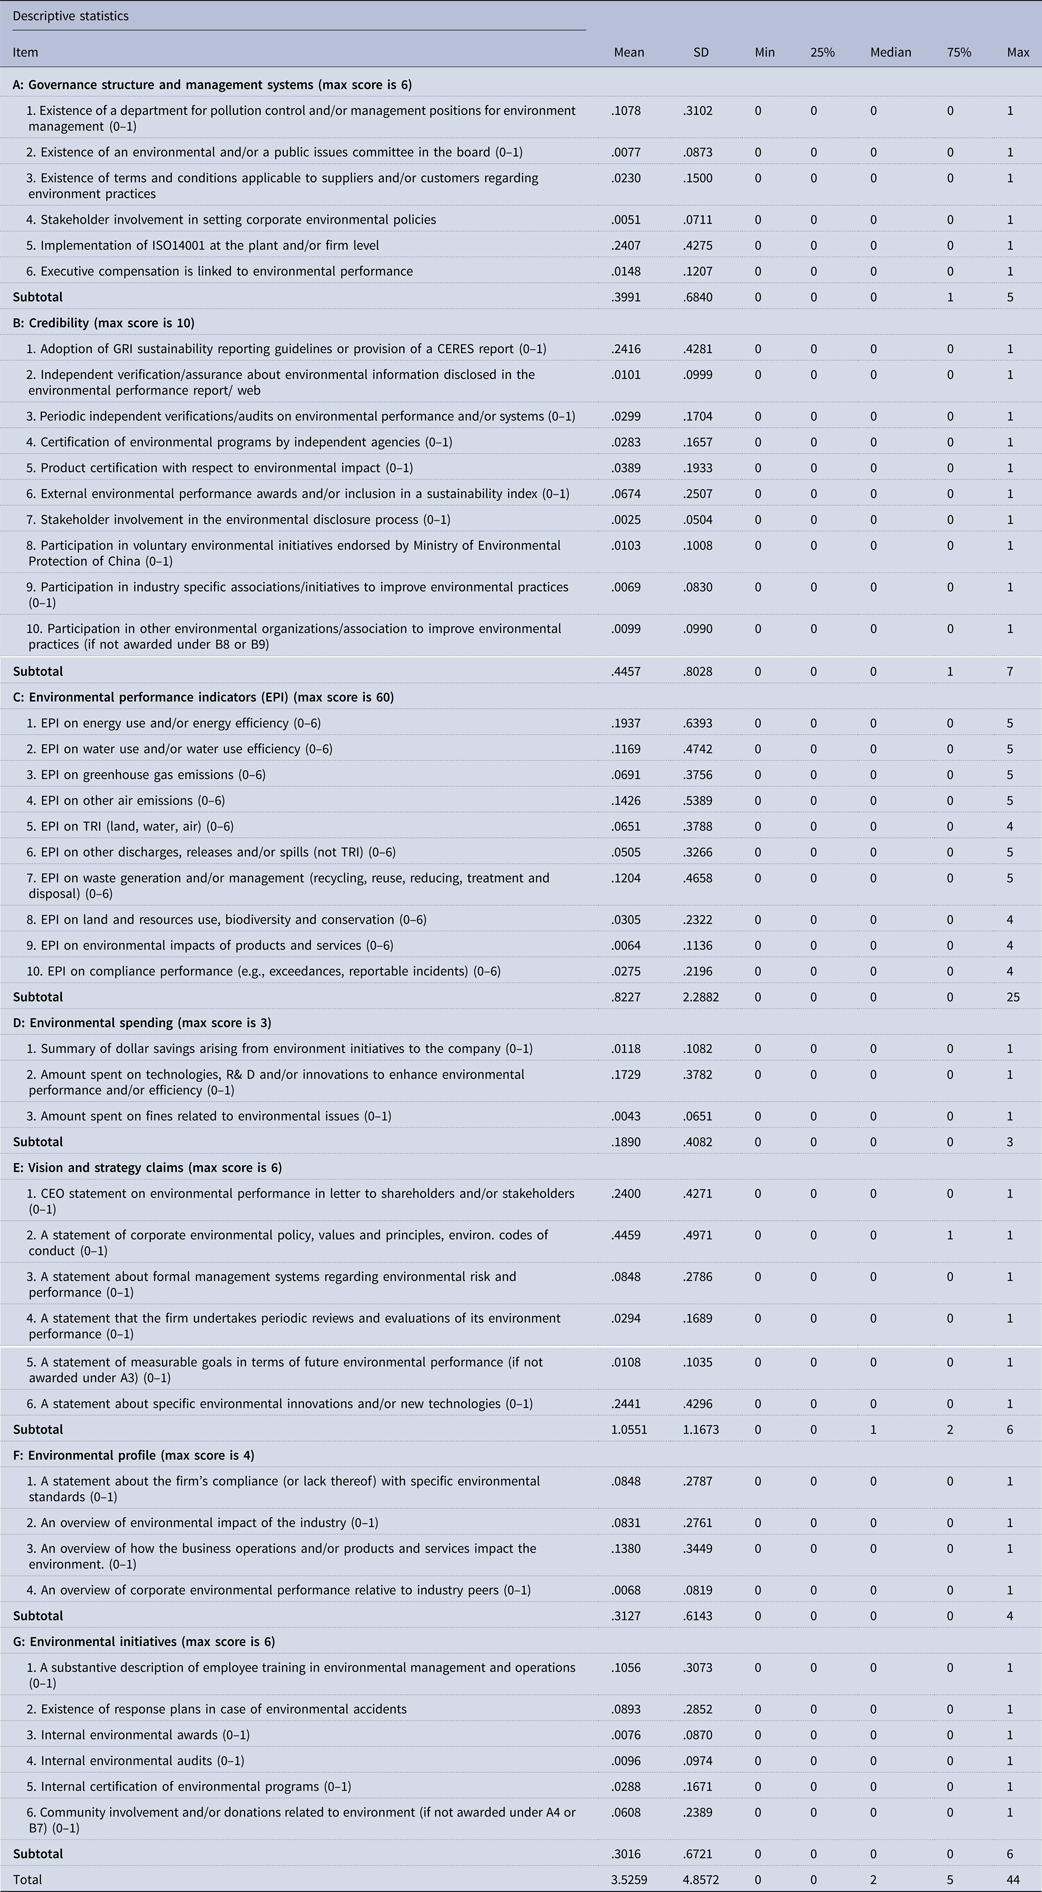
Compared with western countries, greenwashing behavior is not inferior in China. Du et al. (Reference Du, Jian, Zeng and Du2014, Reference Du, Chang, Zeng, Du and Pei2016, Reference Du, Jian, Zeng and Chang2018) and Du (Reference Du2015) reveal that environmental performance of Chinese listed firms is far from optimistic. Specifically, Chinese listed firms tend to score about 3.53 out of 95 (the full score) on average and the highest score is about 44 – less than half of 95. In this regard, it is a huge irony that a great number of Chinese listed firms have declared their eco-friendliness. More likely, hundreds of enterprises conduct greenwashing to cover their environmental weaknesses or unfriendliness.
Greenwashing has penetrated into food, medical treatment, and public welfare products. Du (Reference Du2015) and the South Weekend (www.infzm.com; China's most influential unofficial newspaper) summarize Chinese-style greenwashing: (1) a naked liar (open fraudulence); (2) deliberately concealing facts; (3) double-standard environmental behavior; (4) empty promises; (5) environmental policy interference; (6) environmental impression management; and (7) negative environmental externality.
As environmental pollution becomes increasingly prominent and greenwashing intensifies, some unofficial organizations and the media step forward bravely to disclose the lists of firms that conduct greenwashing behavior. For example, with the support of careful investigations, the South Weekend has published the yearly list of firms with greenwashing since 2012 (Du, Reference Du2015). It is amazing that some very famous Chinese enterprises (even multinational enterprises) appear more than once in these lists (e.g., China Sinopec, 600028.SH). In recent year, due to the continuous attention to carbon emission and the greenhouse effect, China Sinopec – one of the largest oil companies conducted greenwashing through rebranding itself as the environmental pioneer. Specifically, China Sinopec renamed its services, repacked its products, and even advertised its green or environmental image during the processes of charitable donations and conveying the sympathy to the victims of natural disasters.
Prior literature on the marital demography
Family is the most basic component of the human society (Morgan & Morgan, Reference Morgan and Morgan1996), the matrimony affects family composition, and in turn family composition shapes social stability and social culture (Olson & DeFrain, Reference Olson and DeFrain2003, pp. 100–105; Sanders & Nee, Reference Sanders and Nee1996). In recent year, scholars in the fields of economics and management borrow the proxies for marital demography from the sociology (demography) to examine their effect on individual behavior and corporate decisions.
Prior studies have reached consistent conclusions that marriage (divorce) can improve (reduce) individual subjective well-being. Gove, Hughes, and Style (Reference Gove, Hughes and Style1983) find that the marital status is the most powerful predictor of the mental health. Gove and Shin (Reference Gove and Shin1989) validate that, compared to the married people, the psychological well-being of the divorced (widowed) is far poorer. Stutzer and Frey (Reference Stutzer and Frey2006) focus on the relationships between marriage and subjective well-being, validating that happier singles are more likely to opt for marriage. Shapiro and Keyes (Reference Shapiro and Keyes2008) find that married persons have a significant social well-being advantage, in addition to the positive link between marriage and psychological well-being.
Marital status also strengthens philanthropic giving and reduces the likelihood of crime. Bryant, Jeon-Slaughter, Kang, and Tax (Reference Bryant, Jeon-Slaughter, Kang and Tax2003) argue that the marital status is an important dimension of social capital, and thus married people are more connected with social networks than single, separated, and divorced people – who are less likely to be volunteers or make philanthropic giving. Einolf and Philbrick (Reference Einolf and Philbrick2014) and Barnes and Beaver (Reference Barnes and Beaver2012) verify that marriage has a stronger positive (negative) effect on giving (crime).
Besides, a branch of research examines the influence of marital status on the attitudes towards the risk and managerial behavior. Hartog, Ferrer-i-Carbonell, and Jonker (Reference Hartog, Ferrer-i-Carbonell and Jonker2002) argue that the married people are more risk averse than their counterparts because the marriage contract increases the costs of breaking up the relationship. Roussanov and Savor (Reference Roussanov and Savor2014) find that marital status affects individual preferences towards risk, and firms with single (married) CEOs always have higher (lower) stock volatility and exhibit more (less) aggressive investment. Christiansen, Joensen, and Rangvid (Reference Christiansen, Joensen and Rangvid2010) conclude that marriage is a financial risk-reducer for men and financial risk-increaser for women. Nicolosi and Yore (Reference Nicolosi and Yore2015) validate that mergers and major capital expenditures are significantly related with divorces (marriages), and especially, the link between a CEO's marital status and the preference for option-based compensation. Neyland (Reference Neyland2016) verifies that divorce has significant effect on firms with cash-poor CEOs. Hilary, Huang, and Xu (Reference Hilary, Huang and Xu2017) find that firms with single CEOs display a higher degree of earnings management than firms with married CEOs.
Lastly, another focus in extant studies addresses the impact of marital status on social culture. Vandello and Cohen (Reference Vandello and Cohen1999) find that states with higher marriage–divorce ratios are more collectivist in the USA. Toth and Kemmelmeier (Reference Toth and Kemmelmeier2009) find that divorce is more likely to link with individualist societies. As a matter of fact, the divorce rate is consistently associated with the individualistic cultural tendency within a region or society, and highly individualist regions (states, societies) always exhibit higher divorce rates (Dion & Dion, Reference Dion and Dion1996; Lester, Reference Lester1995).
Prior literature on corporate greenwashing
Greenwashing means a variety of different misleading communications that aim to form overly positive beliefs among stakeholders about a company's environmental practices (Torelli, Balluchi, & Lazzini, Reference Torelli, Balluchi and Lazzini2020). Thus, greenwashing is a firm's unsubstantiated claims, aiming at inducing stakeholders to believe that its products and services are energy-saving orientation and the whole enterprise is eco-friendly (Kenton, Reference Kenton2020). However, these claims could at most be partially believed, along with exaggerating the work in environmental protection and concealing environmental misconducts to the greatest extent (Du, Reference Du2015). In response, a branch of prior literature addresses the ways of identifying a firm's greenwashing.
Unfulfilled environmental commitment is closely linked with greenwashing (Lee & Hageman, Reference Lee and Hageman2018). Parguel et al. (Reference Parguel, Benoît-Moreau and Larceneux2011) argue that unfulfilled CSR claims and eco-friendly commitment motivate greenwashing, and further independent sustainability ratings can deter greenwashing and encourage firms to engage in eco-friendly activities. Laufer (Reference Laufer2003) argues that fair social reporting is a channel of identifying greenwashing because it reflects whether a firm has abided by environmental laws. In addition, no independent verification induces greenwashing. There is no statutory requirement that independent third party should verify environmental information, so large and leading-edge firms have lower likelihood of involving in greenwashing (Berrone, Fosfuri, & Gelabert, Reference Berrone, Fosfuri and Gelabert2017; Ramus & Montiel, Reference Ramus and Montiel2005). Du (Reference Du2015) adopts the published lists of firms in the South Weekend to proxy for greenwashing. Lyon and Maxwell (Reference Lyon and Maxwell2011) verify that the threat of environmental audit drives a firm's greenwashing. Lyon and Montgomery (Reference Lyon and Montgomery2013) find that social media can mitigate corporate greenwashing. Delmas and Burbano (Reference Delmas and Burbano2011) argue that managers, NGOs, and policymakers have the obligations to mitigate greenwashing. Siano, Vollero, Conte, and Amabile (Reference Siano, Vollero, Conte and Amabile2017) extend the greenwashing taxonomy by identifying a new type of irresponsible behavior, namely ‘deceptive manipulation’, which strengthens the ‘communicative constitution of organizations’ perspective. By combining the signaling theory with the legitimacy theory, Seele and Gatti (Reference Seele and Gatti2017) argue that greenwashing epistemologically depends on an external accusation, which is viewed as a distortion factor altering the signal reliability of green messages. And then, Seele and Gatti (Reference Seele and Gatti2017) propose a revised definition of greenwashing as cocreation of an external accusation toward an organization with regard to presenting a misleading green message.
Greenwashing is conducted to capitalize on increasing demands for eco-friendly image, products, and services from the society, regardless of whether the ways or channels of achieving these objectives are recyclable, free of environmental pollutions, or nonwasteful (Kenton, Reference Kenton2020). In other words, the only purpose of greenwashing is to deceive the society into believing that the firm and the green label are inseparable, and then grab the huge profits at the expense of the whole society. Thus, another branch of prior literature has investigated the economic consequences of corporate greenwashing.
Greenwashing leads to negative market reactions. Du (Reference Du2015) validates that greenwashing results in significantly negative cumulative abnormal returns around the exposure of greenwashing. Moreover, greenwashing elicits the skepticism from external auditors and customers. Du et al. (Reference Du, Jian, Zeng and Chang2018) find that greenwashing is significantly positively associated with a firm's receiving modified audit opinion. Chen & Chang (2013) verify that greenwashing brings out green consumer confusion and increases green perceived risk. Rahman, Park, and Chi (Reference Rahman, Park and Chi2015), Bloch and Banjeree (Reference Bloch and Banjeree2001) find that the ulterior motive in greenwashing brings out consumer skepticism about environmental claims. Lastly, Bowen (Reference Bowen2014) finds the reduction in environmentalism after corporate greenwashing. Torelli et al. (Reference Torelli, Balluchi and Lazzini2020) find that different levels of greenwashing have a significantly different influence on stakeholders’ perceptions of corporate environmental responsibility and stakeholders’ reactions to environmental scandals.
To sum up, prior literature has investigated the determinants and consequences of greenwashing, but it remains unknown about whether individualistic social culture – which is embedded into and evolves along with marital demography (the divorce–marriage ratio) – affects a firm's greenwashing.
The marital demography and greenwashing (Hypothesis 1)
Confucian culture in China can be classified as being collectivistic (Du, Reference Du2016), which embodies as stable material status and extremely low divorce rate or divorce–marriage ratio. However, as the implementation of family planning policy and the impact of western culture on contemporary China, the big family in the traditional sense no longer exists, young people under the one-child policy have become more and more selfish, and thus individualistic culture is on the rise and collectivistic culture is declining (Evans, Reference Evans and Kipnis2012; Kipnis, Reference Kipnis2012). An obvious example is the increasing divorce rate (see Figure 1). In this regard, the divorce–marriage ratio can serve as an appropriate proxy for individualism in China.
The divorce rate is a product of social and cultural transformation from the collectivism to the individualism (Inglehart, Reference Inglehart1997). Collectivism refers to a social pattern of closely linked individuals who view themselves as interdependent members within a collective (e.g., family; Vandello & Cohen, Reference Vandello and Cohen1999). However, individualism as a cultural pattern emphasizes the independence of the self and individual autonomy (Markus & Kitayama, Reference Markus and Kitayama1991; Triandis, Reference Triandis1995). Collectivism and individualism are very different in the attitude towards family, matrimony (marriage, divorce), individual belief, and social behavior (Triandis, Reference Triandis1994, Reference Triandis1995; Vandello & Cohen, Reference Vandello and Cohen1998, Reference Vandello and Cohen1999).
First, in the collectivist society (region), people enjoy the matrimony and share themselves with their partners in the marriage, and thus they evaluate the self's authenticity at the family level rather than at the individual level (Cross, Gore, & Morris, Reference Cross, Gore and Morris2003; Liu & Chan, Reference Liu and Chan1999). Toth and Kemmelmeier (Reference Toth and Kemmelmeier2009) argue that, in the collectivist society, people always exhibit greater adherence to tradition and social conventions. In China, for quite a long time, collectivism is prevalent and people place the emphases on family unity and self-sacrifice (Singh & Kanjirathinkal, Reference Singh, Kanjirathinkal, Adams and Jones1999). As a result, it is less likely to dissolve the marriage. Comparatively, it is intolerable to sacrifice personal fulfillment for the marriage in the individualistic society. Thus, once the marital relationship let people unhappy, they are highly likely to choose to opt out (Toth & Kemmelmeier, Reference Toth and Kemmelmeier2009). Similarly, Vandello and Cohen (Reference Vandello and Cohen1999) find that states with higher marriage–divorce ratios are more collectivist in the USA. Overall, higher divorce–marriage ratio (divorce rate) is consistently linked with cultural individualism and is more likely in countries with cultural individualism (Dion & Dion, Reference Dion and Dion1996; Lester, Reference Lester1995; Toth & Kemmelmeier, Reference Toth and Kemmelmeier2009). As a matter of fact, the divorce–marriage ratio reflects the contrast between individualistic and collectivistic social cultures, and further higher divorce–marriage ratio, a concrete reflection of the individualistic value or belief, is closely associated with individualism-dominated social culture in a region (society).
Second, individualism-dominated social culture is inversely related with environmentally friendly activities. People in individualism-dominated social culture exhibit lower conformity to group norms and have unfavorable attitude towards public interests (Toth & Kemmelmeier, Reference Toth and Kemmelmeier2009; Vandello & Cohen, Reference Vandello and Cohen1999). Given that environmentally friendly behavior is in the public interests, individualism- dominated regions should exhibit more unfavorable attitude towards environmental protection and have higher likelihood of tolerance for greenwashing. McCarty and Shrum (Reference McCarty and Shrum2001) find that individualism is negatively associated with environmental recycling and sustainable belief. Cho, Thyroff, Rapert, Park, and Lee (Reference Cho, Thyroff, Rapert, Park and Lee2013) find that individualism negatively affects pro-environmental commitment and environmental attitude. More importantly, a branch of very thin but growing literature (Lim & Tsutsui, Reference Lim and Tsutsui2012; Tokar, Reference Tokar1997) provides indirect and preliminary evidence in an incidental way that individualistic (collectivistic) social culture positively (negatively) affects corporate greenwashing. In addition, Roulet and Touboul (Reference Roulet and Touboul2015) find that the positive attitudes towards individualism/liberalism elicit greenwashing.
The sacred marriage requires strong responsibilities and a solemn commitment to stay together for a lifetime (Amato & DeBoer, Reference Amato and DeBoer2001). In this regard, higher divorce–marriage ratio highlights the irresponsible social atmosphere (culture) of breaking promises (Adams & Jones, Reference Adams and Jones1997). As a result, the aforementioned two points, taken together, suggest that individualistic social culture embedded in higher divorce–marriage ratio is positively related with corporate greenwashing.
Lastly, Marquis et al. (Reference Marquis, Glynn and Davis2007)'s community theory states that community isomorphism shapes local social norms and cultural cognition (e.g., the shared local community ideology, value and belief among CEO groups). Bies et al. (Reference Bies, Bartunek, Fort and Zald2007), Gellers (Reference Gellers2012), Pentifallo and VanWynsberghe (Reference Pentifallo and VanWynsberghe2012) conclude that community isomorphism can impel firms and their CEOs to fulfill environmental conservation or involve in greenwashing, depending on whether community isomorphism is individualism dominated or collectivism dominated. Moreover, community isomorphism brings out the ‘peer effect’ (Bursztyn et al., Reference Bursztyn, Ederer, Ferman and Yuchtman2014; Feld & Zölitz, Reference Feld and Zölitz2017), which leads to similar behavior of CEOs within a region (industry). For example, prior literature has validated that the ‘peer effect’ widely exists in CSR and different CSR dimensions (Bollinger, Burkhardt, & Gillingham, Reference Bollinger, Burkhardt and Gillingham2018; Cao et al., Reference Cao, Liang and Zhan2019; Malik, Al Mamun, & Amin, Reference Malik, Al Mamun and Amin2019; Qiu, Yin, & Wang, Reference Qiu, Yin and Wang2016).
The divorce–marriage ratio (divorce rate) is an important social indicator – a numerical measure of portraying a society as a whole (Inglehart, Reference Inglehart1997; Toth & Kemmelmeier, Reference Toth and Kemmelmeier2009). As such, according to the community theory and the ‘peer effect’, higher divorce–marriage ratio is closely associated with individualistic social culture, shapes community isomorphism at the province level, induces the ‘peer effect’ of mitigating environmental involvement, and eventually results in corporate greenwashing. Marriage or divorce belongs to individual-specific event, but high divorce–marriage ratio shapes the individualism-dominated social culture at the macrolevel, which imperceptibly affects all people within a region (province). Maybe CEOs or top managers in some enterprises do not support or agree with individualistic social culture, but they may have to adjust their behavior and corporate decisions due to the community isomorphism, isomorphism pressures, and the ‘peer effect’.
To sum up, higher divorce–marriage ratio characterizes individualism-dominated social culture, which mitigates a firm involving in environmentally friendly activities and increases the extent of greenwashing. Due to the community isomorphism and the ‘peer effect’, the positive effect of individualism-dominated social culture – which is portrayed by divorce–marriage ratio – on corporate greenwashing spreads within a region (province). Thus, we formulate Hypothesis 1 (H1) as below:
H1: Ceteris paribus, the divorce–marriage ratio is positively associated with (the extent of) corporate greenwashing.
The moderating effect of the environmental protection Law (Hypothesis 2)
China has been the largest emerging market and the second largest economy, but rapid economic growth cannot cover the fact that formal institutions fall short and far from adequate (Allen et al., Reference Allen, Qian and Qian2005). As an alternative, informal system (e.g., Confucian culture, social ties) plays the substitutive role in affecting the Chinese society, corporate governance, and individual behavior (Du, Reference Du2016). For this reason, H1 predicts the positive impact of the divorce–marriage ratio – which captures the contest between individualistic and collectivistic social cultures – on corporate greenwashing.
However, it is indisputable that the role of informal institutions depends on how perfect the formal system is (Williamson, Reference Williamson2000). Williamson (Reference Williamson2000) outlines a four-level social institution framework: ‘(1) social embeddedness (e.g., informal institutions, customs, traditions, norms), which remains fairly stable and only evolves slowly over time; (2) institutional environment – formal rules such as judiciary and bureaucracy; (3) governance (e.g., contract); and (4) resource allocation and employment (i.e., price, incentive)’. Moreover, Williamson (Reference Williamson2000) argues that some formal institutions like laws derive from informal system, but formal institution can exert the crowding-out (extrusion) effect on informal system. Extending Williamson (Reference Williamson2000), Elias and Jephcott (Reference Elias and Jephcott1982), Foucault (Reference Foucault2012), Lowes, Nunn, Robinson, and Weigel (Reference Lowes, Nunn, Robinson and Weigel2017) and Tabellini (Reference Tabellini2008) validate that formal institutions may crowd out the original effect from informal systems. Especially, Du et al. (Reference Du, Jian, Zeng and Du2014) find that, the continuous improvement of China's laws weakens the original impact of religious atmosphere around a firm (an informal system) on corporate behavior.
To protect the ecology environment, prevent pollution and other public hazards, ensure public health, promote the construction of ecological civilization and the sustainable development, the Environmental Protection Law of the People's Republic of China has been in force and implemented since 2015.Footnote 2 Based on Williamson (Reference Williamson2000)'s four-level social institution analyses framework and the aforementioned discussions, it can be logically inferred that CEPL as a formal institution will crowd out the influence of the divorce–marriage ratio (an informal system and individualistic social culture) on greenwashing. Thus, we formulate Hypothesis 2 (H2) as below:
H2: Ceteris paribus, CEPL attenuates the positive effect of the divorce–marriage ratio on corporate greenwashing.
Research design
Sample
The initial sample includes all Chinese listed firms during the period of 2008–2017. Our sample period begins in 2008 because most firms have not disclosed environmental information in 2007 and before. Then, we select the research sample based on several criteria: First, we delete firms pertaining to the banking, insurance, and other financial industries. Second, we discard firm-year observations whose net assets are below zero. Lastly, we eliminate firm-year observations with missing data on firm-specific variables. As a result, we get a final sample of 21,628 firm-year observations, covering 3,003 unique firms. To mitigate the effect of extreme firm-year observations on regression results, all continuous variables are winsorized at the 1 and 99% of their original values.
We sort industries based on the China Securities Regulatory Commission (CSRC) industry classification standard, but manufacturing industry (Coded by C) is divided into ten subindustries, labeled with the second industry code. No serious clustering phenomenon exists except for C4 and C7. Nevertheless, all reported t-(z-) statistics are based on standard errors adjusted for clustering at firm and year level (Petersen, Reference Petersen2009).
Data source
Data sources of variables are reported as below (see Appendix 1): First, the data on corporate greenwashing (GW) are calculated on the basis of hand-collected data on environmental performance by checking annual reports, CSR reports, and corporate official websites (Clarkson, Li, Richardson, & Vasvari, Reference Clarkson, Li, Richardson and Vasvari2008; Du et al., Reference Du, Jian, Zeng and Du2014, Reference Du, Chang, Zeng, Du and Pei2016; GRI, 2006). Second, the data on divorce–marriage ratio (DIV_MAR) are hand-collected from the official website of CNBS (http://www.stats.gov.cn/; China's National Bureau of Statistics). Third, we obtain the data on Marketization index (MKT) from Wang, Fan, and Hu (Reference Wang, Fan and Hu2019). Lastly, we obtain the data on control variables from CSMAR (China Stock Market and Accounting Research).
Corporate greenwashing (dependent variable)
In our study, the dependent variable is corporate greenwashing, labeled as GW. In prior literature, researchers employ two types of proxies for greenwashing (Du, Reference Du2015; Du et al., Reference Du, Jian, Zeng and Chang2018; Laufer, Reference Laufer2003; Ramus & Montiel, Reference Ramus and Montiel2005): (1) ex ante proxy; and (2) ex post proxy. Most extant studies identify greenwashing by ex post proxies such as sustainable ratings (Parguel et al., Reference Parguel, Benoît-Moreau and Larceneux2011) and the lists of greenwashing in the media (Du, Reference Du2015). However, a branch of very thin but growing literature has constructed ex ante proxy to measure greenwashing (e.g., Du et al., Reference Du, Jian, Zeng and Chang2018).
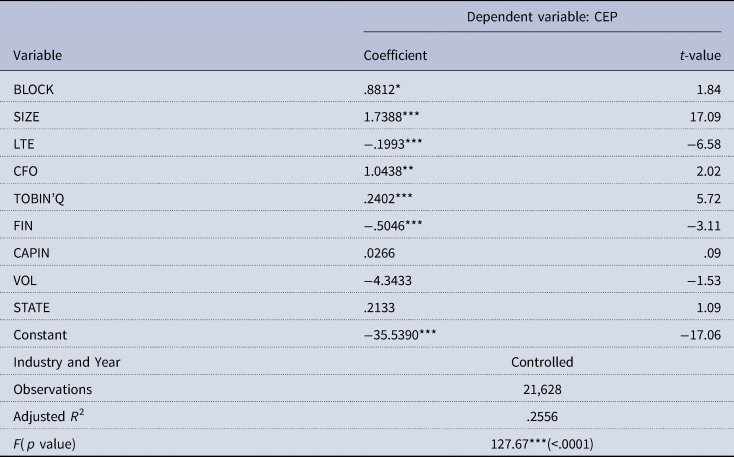
Our measure of corporate greenwashing (GW) can borrow important support from Richardson (Reference Richardson2006), who adopts similar approach to measure overinvestment. Referring to Du et al. (Reference Du, Jian, Zeng and Chang2018) and Richardson (Reference Richardson2006), we construct ex ante proxies for greenwashing: First, we obtain original information from the annual reports, CSR reports, and official websites. Second, we calculate and hand-collect data on a firm's actual value of environmental performance (Appendix 3 and descriptive statistics) based on GRI (2006) and Clarkson et al. (Reference Clarkson, Li, Richardson and Vasvari2008). Third, by regressing Clarkson et al. (Reference Clarkson, Li, Richardson and Vasvari2008)'s model, we obtain the expected value of a firm's environmental performance (Appendix 2). Lastly, we define corporate greenwashing as the difference between the actual value and the expected value of environmental performance if the former is less than the latter, and 0 otherwise.Footnote 3
The divorce–marriage ratio (marital demography, independent variable)
Prior literature adopts three approaches to measure the marital demography (U.S. Bureau of the Census, 1996; Vandello & Cohen, Reference Vandello and Cohen1999): (1) the divorce–marriage ratio (or the reverse scored), measured as the divorce rate at the province level divided by provincial marriage rate ( × 100); (2) the crude divorce rate, computed as the ratio of the number of annual divorces per year to total population; and (3) the fine divorce rate, measured as the ratio of the number of divorces per year to the population of married women, excluding the number of young women below the legal age of marriage.
In this study, we adopt the divorce–marriage ratio (DIV_MAR) based on the first approach for main tests.Footnote 4 DIV_MAR is the proxy for marital demography, measured as the divorce rate divided by marriage rate at the province level (U.S. Bureau of the Census, 1996; Vandello & Cohen, Reference Vandello and Cohen1999). If the coefficient on DIV_MAR is positive and significant, H1 is supported.
China's Environmental Protection Law (moderating variable)
In this study, the moderating variable is CEPL. CEPL is an indicator variable, equaling 1 for years of 2015 and after and 0 otherwise. Thus, a significantly negative coefficient on DIV_MAR × CEPL is consistent with H2.
Control variables
To identify the incremental effect of the divorce–marriage ratio on corporate greenwashing, we refer to Clarkson et al. (Reference Clarkson, Li, Richardson and Vasvari2008), Kumar (Reference Kumar2020), and Du et al. (Reference Du, Jian, Zeng and Chang2018) to include a set of control variables into regressions (see Appendix 1 for variable definitions). First, to isolate the impacts of governance mechanisms on greenwashing, blockholder ownership (BLOCK), institutional ownership (INST), managerial ownership (MAN_SHR), the indicator for CEO-chairman duality (DUAL), the ratio of independent directors (INDR), and board size (BOARD) are incorporated into the regression model.
Second, firm-specific financial characteristics such as firm size (SIZE), liability-to-equity ratio (LTE), the ratio of cash flow from operating activity (CFO), corporate growth opportunity (TOBIN'Q), financing activities (FIN), capital intensity (CAPIN), a firm's stock price volatility (VOL) and an indicator for state-owned enterprises (STATE) are included in the regression model. By doing so, the influence of firm-specific financial characteristics on greenwashing can be isolated to some extent.
Third, two macrolevel factors – marketization index (MKT) and GDP per capita at the province level (GDP_PC) – are controlled in the regression model, referring to Du et al. (Reference Du, Jian, Zeng and Chang2018).
Lastly, we include a set of dummies to control for fixed effects of industry and year.
Results
Descriptive statistics
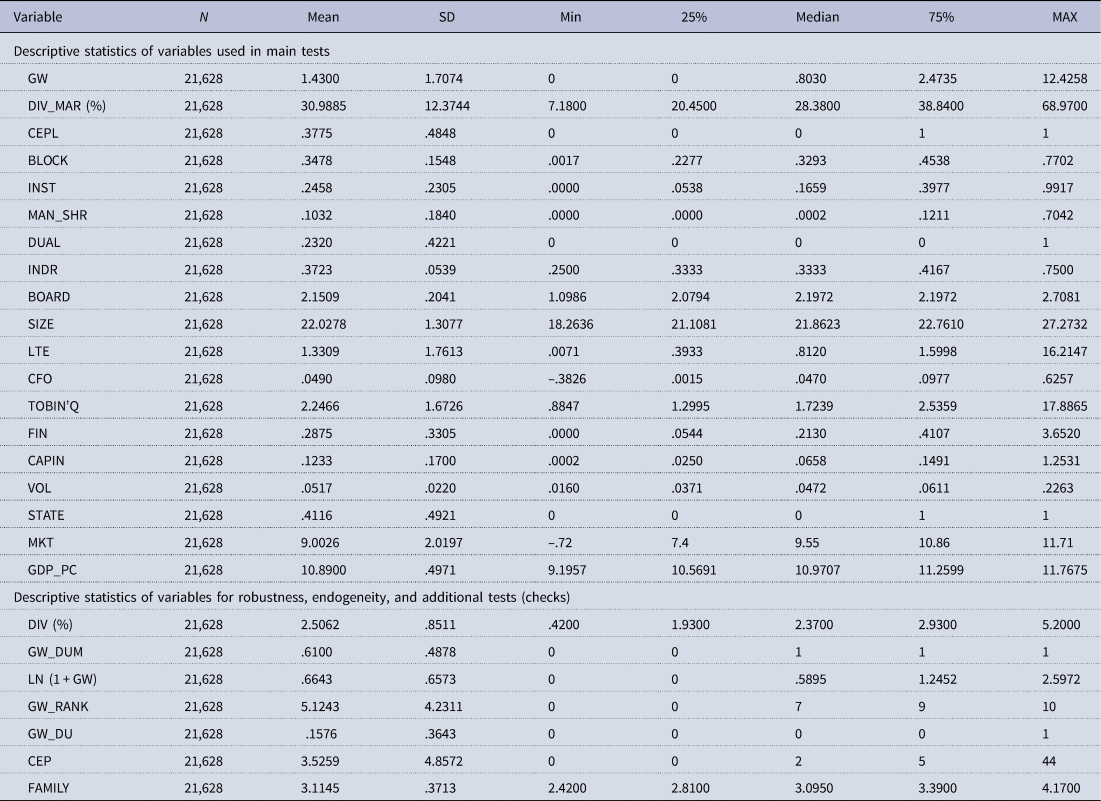
Table 1 reports results of descriptive statistics. The mean value of GW is 1.4300, revealing that the actual value is 1.43 less than the expected value on average with regard to corporate environmental performance. Referring to GW_DUM (the dummy variable of GW), the actual value of environmental performance is less than the expected value for about 61% of firms – a considerable proportion, suggesting that corporate greenwashing widely exists in China. The mean value of DIV_MAR is 30.9885, implying that the divorce rate accounts for almost 31% of marriage rate at the province level.Footnote 5 Such a high divorce–marriage ratio reveals that unstable marital status is prevalent in contemporary China. The mean value of CEPL is .3775, displaying the sample distribution during 2008–2017 (given that CEPL has been implemented since 2015).
Descriptive statistics
Note: All the variables are defined in Appendix 1.
As for control variables, on average and approximately, blockholder ownership (BLOCK) is 34.78%, institutional ownership (INST) accounts for 24.58%, managerial ownership (MAN_SHR) reaches 10.32%, CEO-chairman duality (DUAL) exists in 23.20% of sample firms, the percentage of independent directors on corporate boards (INDR) is 37.23%, the board of directors (BOARD) consists of eight to nine directors (e2.1509), the asset scale of the sample firms (SIZE) is 3.69 billion Yuan (RMB), liability-to-equity ratio (LTE) is 1.3309, operating cash flow ratio (CFO) is 4.90%, corporate growth opportunity (TOBIN'Q) is 2.2466, the ratio of financing (FIN) in the year is .2875, capital intensity ratio (CAPIN) is 12.33%, a firm's price volatility (VOL) accounts for 5.17%, 41.16% of sample firms are state-owned enterprises (STATE), marketization index at the province level (MKT) is 9.0026, and provincial GDP per capita (GDP_PC) is 53.64 thousand Yuan (RMB; e10.8900), respectively.
Pearson correlation analyses
In Table 2, the correlation coefficient between GW and DIV_MAR is positive and significant, suggesting the positive effect of the divorce–marriage ratio on greenwashing and lending preliminary support to H1. Moreover, the negative correlation between CEPL and GW, as well as the significantly positive correlation between CEPL and DIV_MAR, urges our study to address the interactive effect between the divorce–marriage ratio and CEPL on greenwashing.
Pearson correlation analyses

Note: p value is presented in parentheses. All the variables are defined in Appendix 1.
Moreover, there are positive and significant correlations between GW and BLOCK, INST, BOARD, SIZE, LTE, CFO, FIN, CAPIN, and STATE, while GW is significantly negatively correlated with MAN_SHR, DUAL, TOBIN'Q, VOL, MKT, and GDP_PC. Moreover, almost all correlations among control variables are relatively low (<.30), implying that multicollinearity may not be serious when our models include them simultaneously.
Multivariate tests of H1 and H2: main findings
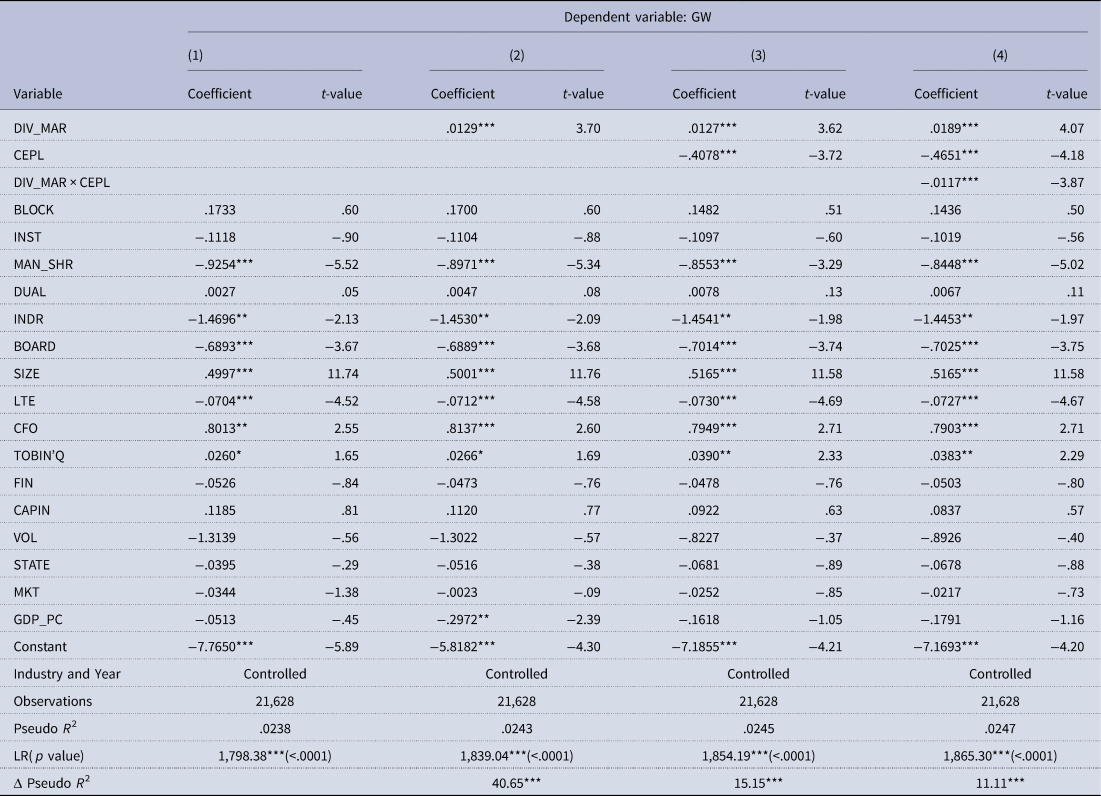
Table 3 reports the step-by-step regression results of H1 and H2. As shown in the antepenultimate line, Pseudo R 2 for each regression model is significant. In addition, the last line reveals incremental explanatory power between nearby models (see Δ Pseudo R 2). Furthermore, all reported t-statistics are based on standard errors adjusted for clustering at the firm and year level (Petersen, Reference Petersen2009).
Regression results of greenwashing on divorce demography, environmental law, and other determinants
Note: ***, **, and * represent the 1, 5, and 10% levels of significance, respectively, for a two-tailed test. All reported t-statistics are based on the robust standard errors clustering at firm and year level. All the variables are defined in Appendix 1.
Column (1) of Table 3 reports the effects of all control variables on corporate greenwashing. As column (1) reveals, managerial ownership (MAN_SHR), the ratio of independent directors (INDR), board size (BOARD), and liability-to-equity ratio (LTE) can mitigate a firm's greenwashing to some extent. However, firm size (SIZE), operating cash flow (CFO) and growth opportunity (TOBIN'Q) are found to be significantly positively associated with corporate greenwashing.
Column (2) reports results of H1 by adding the main explanatory variable (DIV_MAR) into the regression model. In column (2), the coefficient on DIV_MAR is positive and significant at the 1% level (.0129 with t = 3.70), implying the positive effect of the divorce–marriage ratio on corporate greenwashing. In addition, higher divorce–marriage ratio in China is closely associated with stronger individualistic social atmosphere, lower conformity to social norms, and more unfavorable attitude towards environmental conservation – they foster each other, imperceptibly affect individual behavior and attitudes within the administrative jurisdiction (a province), abet firms to talk the talk rather than walk the walk, and thus foment corporate greenwashing. Furthermore, the coefficient estimation on DIV_MAR suggests that one-standard-deviation increase in the divorce–marriage ratio leads to about .1596 increase in greenwashing (GW), equaling about 11.16% of the mean value of GW. In this regard, this amount is both statistically and economically significant, providing strong support to H1.
In column (3), we further include the moderating variable –CEPL into the regression model. As shown in column (3), DIV_MAR still has a significantly positive coefficient, lending additional support to H1. Moreover, the coefficient on CEPL is negative and significant at the 1% level (−.4078 with t = −3.72), implying that CEPL can mitigate corporate greenwashing to some extent since its implementation in 2015.
Column (4) provides results of H2 after including DIV_MAR, CEPL and the interactive item of DIV_MAR × CEPL in the regression model simultaneously. DIV_MAR has a significantly positive coefficient, verifying H1 again. Similarly, as expected, CEPL has a significantly negative coefficient. More importantly, the coefficient on DIV_MAR × CEPL is negative and significant at the 1% level (−.0117 with t = −3.87), suggesting that CEPL attenuates the positive association between the divorce–marriage ratio and greenwashing. Moreover, the coefficient estimation on DIV_MAR × CEPL reveals that the positive effect of the divorce–marriage ratio on greenwashing has been attenuated by about 61.90% since the implementation of CEPL in 2015. Above results, taken together, lend strong and important support to H2.
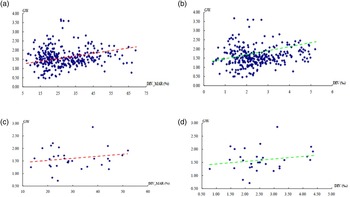
Using the scatter diagram, Figure 2a (2c) outlines the relation between annual (the mean value of) divorce–marriage ratio and the annual mean value of greenwashing for all listed firms in a province. As shown in Figure 2a (2c), there exits an obvious and positive relation between the divorce–marriage ratio and greenwashing. Similarly, in Figure 2b (2d), we replace the divorce–marriage ratio by the divorce rate, and the obviously positive effect of the divorce ratio on greenwashing can be still observed.
The scatter diagram about the relation between marital demography and provincial greenwashing, (a): the scatter diagram about the relation between annual divorce–marriage ratio (%) and the annual mean value of greenwashing (GW) for all listed firms in a province, (b): the scatter diagram about the relation between annual divorce rate (‰) and the annual mean value of greenwashing (GW) for all listed firms in a province, (c): the scatter diagram about the relation between the mean value of the divorce–marriage ratio (%) and the mean value of greenwashing (GW) for all listed firms in a province, (d): the scatter diagram about the relation between the mean value of the divorce rate (‰) and the mean value of greenwashing (GW) for all listed firms in a province.
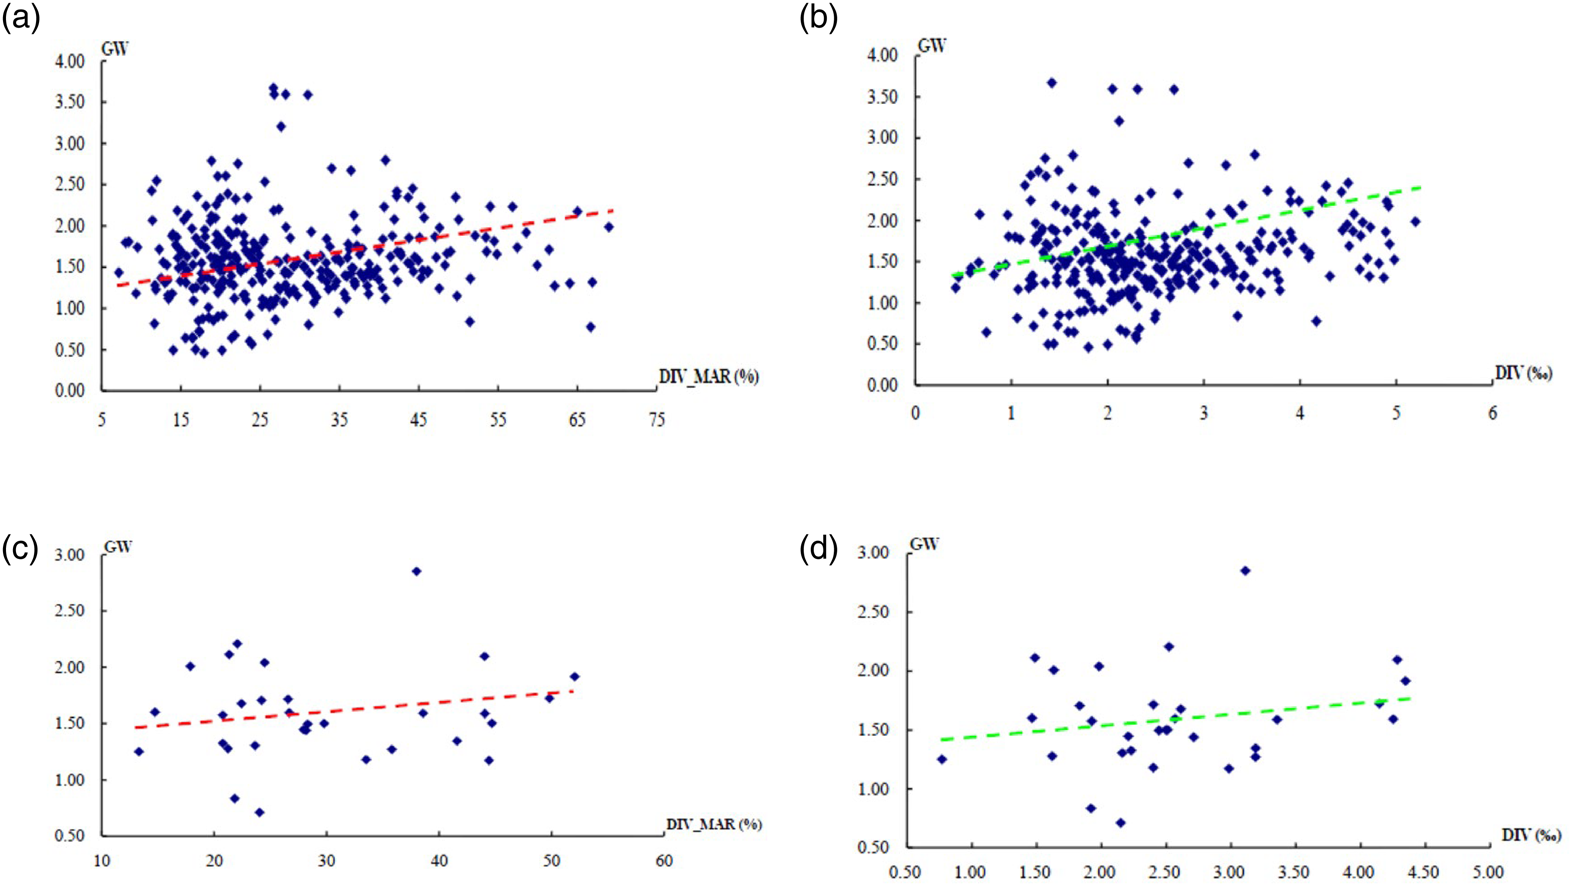
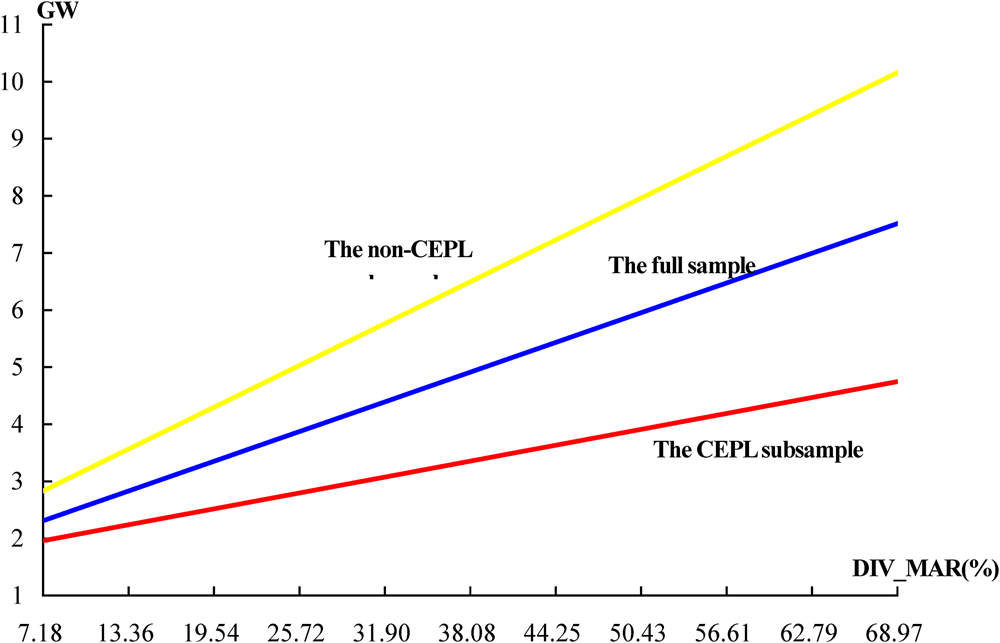
Figure 3 displays the moderating effect of CEPL on the relation between the divorce–marriage ratio (DIV_MAR) and corporate greenwashing (GW). The blue, red, and yellow lines denote the effect of DIV_MAR on a firm's greenwashing for the full sample, the CEPL subsample (CEPL = 1), and the non-CEPL subsample, respectively. In Figure 3, it is clear that the positive relation between DIV_MAR and GW is less pronounced for the CEPL subsample (the red line) than for the non-CEPL subsample (the yellow line), which provides additional support to H2.
The moderating effect of China's Environmental Protection Law (CEPL) on the relation between the divorce–marriage ratio (DIV_MAR) and corporate greenwashing (GW). Note: In the figure, the blue line, the red line and the yellow line denote the effect of the divorce–marriage ratio (DIV_MAR) on corporate greenwashing (GW) for the full sample, the CEPL subsample, and the non-CEPL subsample, respectively.
Robustness checks of H1 and H2 using the divorce rate as the proxy for marital demography
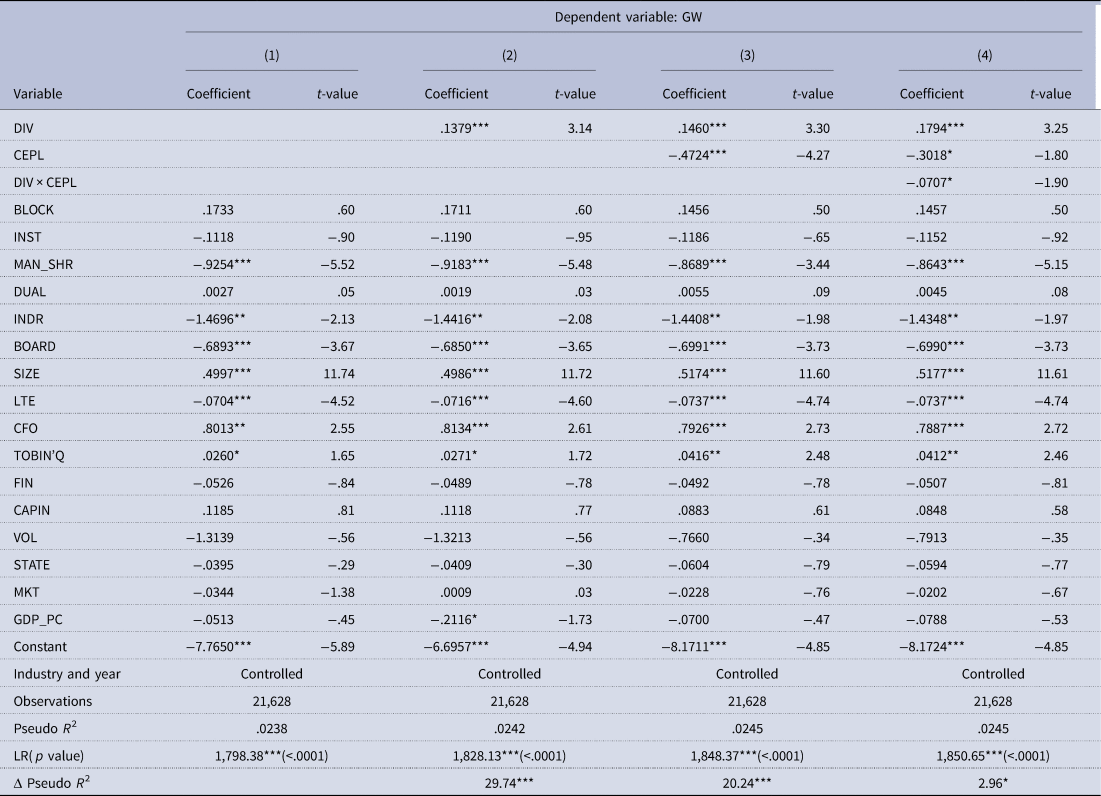
In Table 4, we employ the divorce rate (DIV) at the province level to conduct robustness checks. As shown in column (2) of Table 4, DIV has a positive and significant coefficient (.1379 with t = 3.14), validating H1 again. In addition, in column (4), the coefficient on DIV × CEPL is negative and significant (−.0707 with t = −1.90), consistent with H2.
Robustness checks using the divorce rate as the proxy for marital demography
Note: ***, **, and * represent the 1, 5, and 10% levels of significance, respectively, for a two-tailed test. All reported t-statistics are based on the robust standard errors clustering at firm and year level. All the variables are defined in Appendix 1.
Robustness checks of H1 and H2 using other proxies for corporate greenwashing
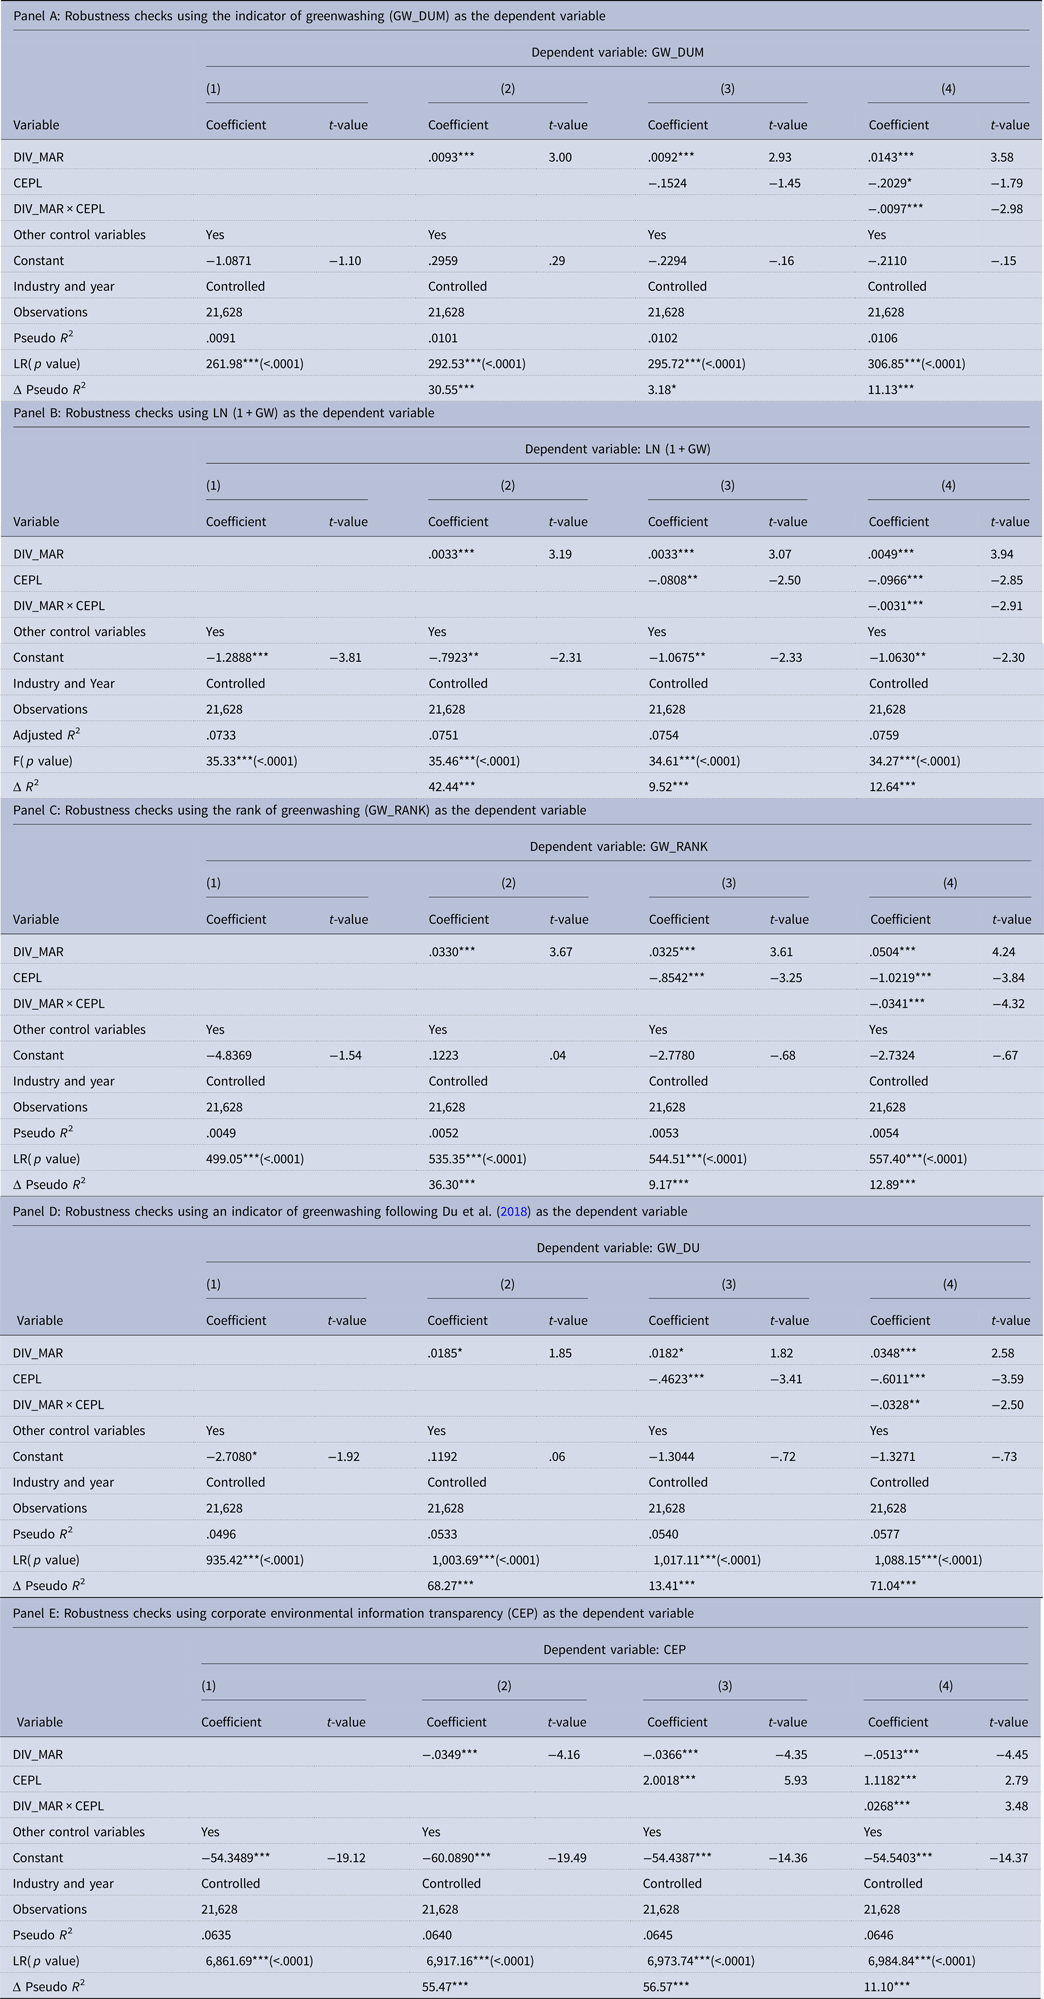
In Panels A–E of Table 5, we successively adopt five alternative proxies for greenwashing as dependent variables to retest H1 and H2: (1) GW_DUM, equaling 1 if a firm's actual value of environmental performance is less than the expected value and 0 otherwise. (2) LN (1 + GW), measured as the natural logarithm of (1 + greenwashing). (3) GW_RANK, the rank of GW. Specifically, the positive values of GW are divided into ten groups from low to high by year (GW_RANK is defined as 0 when GW equals to 0), the first, second, …, tenth groups are ranked as 1, 2, …, and 10, respectively; (4) GW_DU, an indicator variable for greenwashing following Du et al. (Reference Du, Jian, Zeng and Chang2018); (5) CEP – a firm's environmental performance, which is computed following Clarkson et al. (Reference Clarkson, Li, Richardson and Vasvari2008) and GRI (2006).
Robustness checks using other proxies for greenwashing
Note: ***, **, and * represent the 1, 5, and 10% levels of significance, respectively, for a two-tailed test. All reported t-statistics are based on the robust standard errors clustering at firm and year level. All the variables are defined in Appendix 1.
In column (2) of Panels A–D of Table 5 in which dependent variables are GW_DUM, LN (1 + GW), GW_RANK, and GW_DU, respectively, all the coefficients on DIV_MAR are positive and significant. In addition, in column (2) of Panel E in which the dependent variable is CEP, DIV_MAR has a significantly negative coefficient. Above results collectively lend strong evidence for H1.
In column (4) of Panels A–D of Table 5, the coefficients on DIV_MAR × CEPL are all negative and significant at the 1 or 5% level. Moreover, in column (4) of Panel E, DIV_MAR × CEPL has a positive and significant coefficient. Above results, taken together, provide additional support to H2.
Endogeneity and additional tests
Endogeneity tests using two-stage instrumental variable approach
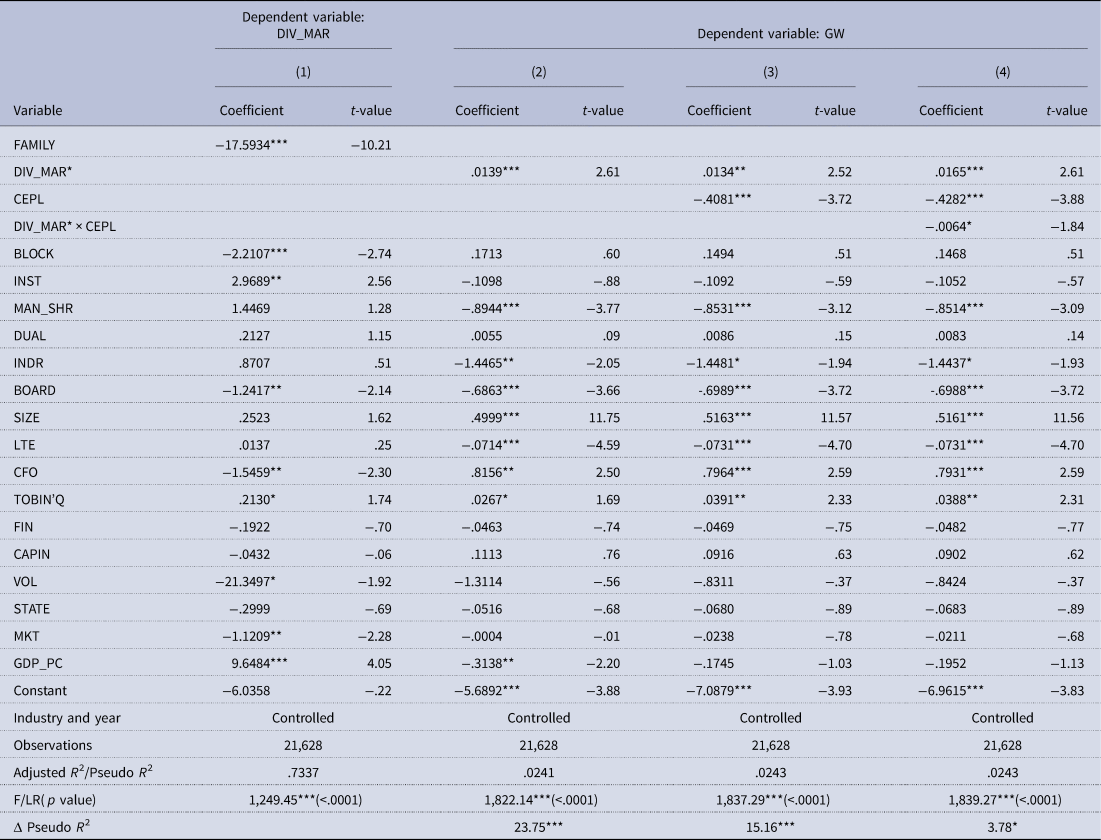
Next, we adopt two-stage instrumental variable approach to mitigate the potential endogeneity between the divorce–marriage ratio and greenwashing. By doing so, the primary task is to identify the instrumental variable. Spanier (Reference Spanier1984) suggests the negative relation between the number of household population and the likelihood of divorce. Whitehead (Reference Whitehead1998) argues that the divorce is less likely to happen in large-scale families. Referring to Spanier (Reference Spanier1984) and Whitehead (Reference Whitehead1998), the average number of household population (FAMILY) can serve as the appropriate instrumental variable. FAMILY is predicted to be negatively related to the divorce– marriage ratio (DIV_MAR), but it is unlikely that household population affects a firm's greenwashing.
After including FAMILY and all control variables in the first-stage regression, we estimate the fitted value of the divorce–marriage ratio. In column (1) of Table 6, FAMILY is negatively and highly significantly associated with DIV_MAR (−17.5934 with t = −10.21), consistent with our prediction.
Endogeneity tests using two-stage instrumental variable regression approach
Note: ***, **, and * represent the 1, 5, and 10% levels of significance, respectively, for a two-tailed test. All reported t-statistics are based on the robust standard errors clustering at firm and year level. All the variables are defined in Appendix 1.
In the second-stage regressions, we further use the fitted value of the divorce–marriage ratio (i.e., DIV_MAR*) as the main explanatory variables. As shown in column (2) of Table 6, the coefficient on DIV_MAR* is positive and significant at the 1% level (.0139 with t = 2.61), authenticating H1 again. In addition, DIV_MAR* × CEPL has a negative and significant coefficient, validating H2.
Overall, after addressing the endogeneity, results in Table 6 suggest that our main findings are not qualitatively changed, and thus our conclusions are less likely to be changed by the endogeneity issue.
Additional tests using individual-level divorce dataFootnote 6
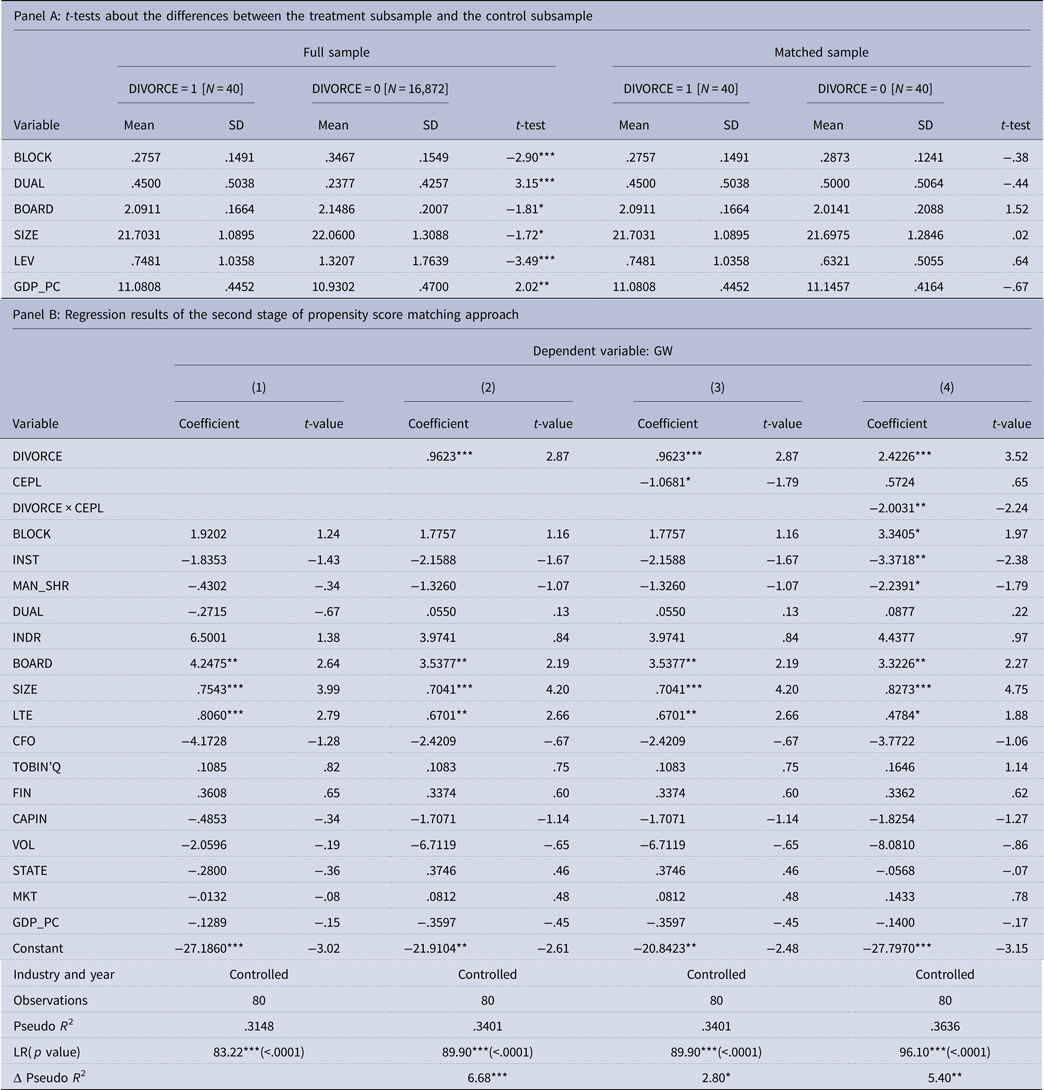
Next, we hand-collect individual-level divorce data (DIVORCE).Footnote 7 DIVORCE is an indicator, equaling 1 if a firm's CEO, top managers, or the controlling shareholder divorced in the year and 0 otherwise. During our sample period, we only obtain 40 firms with individual-level divorce, so we employ the propensity score matching approach, abide by the one-to-one principle, and adopt ‘ ± .001’ as the threshold to match each DIVORCE (the treated firm) to only one non-DIVORCE (the matched firm). Blockholder ownership (BLOCK), CEO-chairman duality (DUAL), board size (BOARD), firm size (SIZE), financial leverage (LEV), and GDP_PC are chosen to conduct the first-stage matching process. Finally, we get a sample of 80 observations, including 40 treated firms and 40 matched firms.
As Panel A shows, the differences in all chosen variables are significant between the DIVORCE subsample and the non-DIVORCE subsample. However, after conducting the PSM process, all the differences in chosen variables between the treatment sample and the control sample are insignificant. Above results, taken together, suggest that a fairly good work has been done.
As shown in column (2) of Panel B of Table 7, the coefficient on DIVORCE is positive and significant at the 1% level (.9623 with t = 2.87), consistent with H1 and suggesting that firms with the divorced CEO exhibit higher extent of greenwashing than their counterparts. In addition, in column (4) of Panel B, the coefficient on DIVORCE × CEPL is negative and significant (−2.0031 with t = −2.24), verifying H2 again. Overall, results using individual-level divorce data further support H1 and H2.
Regression results of greenwashing on individual-specific divorce, environmental law, and other determinants
Note: ***, **, and * represent the 1, 5, and 10% levels of significance, respectively, for a two-tailed test. All reported t-statistics are based on the robust standard errors clustering at firm and year level. All the variables are defined in Appendix 1.
Discussion
Theoretical contributions
Our study makes several contributions as below. First, to our knowledge and literature in hand, our study is the first one to associate marital demography with corporate greenwashing. Prior literature has examined the determinants of greenwashing such as institutional, organizational, and individual drivers (Delmas & Burbano, Reference Delmas and Burbano2011), institutional complexity and stakeholder pressures (Testa et al., Reference Testa, Boiral and Iraldo2018), social accountability (Laufer, Reference Laufer2003), environmental policy (De Vries et al., Reference De Vries, Terwel, Ellemers and Daamen2015; Ramus & Montiel, Reference Ramus and Montiel2005), the globalization of environmental disclosure (Marquis & Toffel, Reference Marquis and Toffel2011), and selective disclosure (Marquis, Toffel, & Zhou, Reference Marquis, Toffel and Zhou2016). Moreover, previous studies have focused on economic consequences of greenwashing such as financial performance (Walker & Wan, Reference Walker and Wan2012), market reactions (Du, Reference Du2015), the moderating role in the relation between environmental performance, and modified audit opinions (Du et al., Reference Du, Jian, Zeng and Chang2018). However, little is known about whether the marital demography or the matrimony status (divorce or marriage) can affect a firm's fulfilling environmental responsibility and involving in greenwashing by shaping the CEO's individual preference. To fill the above gap, this study focuses on the Chinese context to examine the effect of the marital demography on greenwashing. In this regard, our study contributes to prior literature on the determinants of corporate greenwashing.
Second, our study adds to the existing literature about the influence of macrolevel social culture on corporate decisions (e.g., Guiso, Sapienza, & Zingales, Reference Guiso, Sapienza and Zingales2006; Stulz & Williamson, Reference Stulz and Williamson2003). Previous studies have focused on country-specific culture to examine their impacts on corporate decisions. China has a vast territory in which social culture (e.g., marital demography) varies across provinces. In this regard, our findings on the basis of different provinces in mainland China can provide important supplement to prior literature about the association between cross-national cultures and corporate behavior.Footnote 8
Third, our study contributes to prior literature on ‘law and finance’ (Graff, Reference Graff2008; La Porta, Lopez-de-Silanes, Shleifer, & Vishny, Reference La Porta, Lopez-de-Silanes, Shleifer and Vishny1998; Malmendier, Reference Malmendier2009). It is well known that, the law and formal institutions have fallen short and legal enforcement has been relatively weak for a long time in China (Allen et al., Reference Allen, Qian and Qian2005; Du et al., Reference Du, Jian, Zeng and Du2014). Consequently, informal systems play the substitutive role in economic growth (Allen et al., Reference Allen, Qian and Qian2005) and corporate decisions (Du et al., Reference Du, Jian, Zeng and Du2014). Our study reveals that the continuous improvement of China's formal institutions (the environmental protection law) mitigates corporate greenwashing, and further weakens the role of informal systems (marital demography). In this regard, our study provides strong evidence to the existing literature on ‘law and finance’.
Fourth, we develop a new approach to construct ex ante proxies for corporate greenwashing on the basis of Delmas and Burbano (Reference Delmas and Burbano2011) and Du et al. (Reference Du, Jian, Zeng and Chang2018), contributing to prior literature on the measurement of greenwashing. Our approach provides important supplement to Du et al. (Reference Du, Jian, Zeng and Chang2018) by incorporating the whole environmental performance to compute the extent of greenwashing, as well as Delmas and Burbano (Reference Delmas and Burbano2011)'s four-classification method of identifying corporate greenwashing.
Lastly but not least, our study can extend prior literature about the impact of informal systems on corporate decisions (e.g., Vandello & Cohen, Reference Vandello and Cohen1998, Reference Vandello and Cohen1999) by validating that the impact of the marital demography as social culture (individualism or collectivism) on greenwashing depends on CEO- (industry-) specific characteristics. At a minimum, our findings reveal the interactive effect between cultural factors and CEO- (industry-) specific influencing factors on a firm's greenwashing behavior.
Managerial implications
Our study has several managerial implications as below: First, our findings suggest that firms within a region (province) with higher divorce–marriage ratio may just talk the talk – do not fulfill their environmental responsibilities – rather than walk the walk. Given the relation between the marital demography and individualistic social atmosphere, the positive effect of marital demography (the divorce–marriage ratio) on corporate greenwashing can urge the regulatory bodies (e.g., the Ministry of Environmental Protection; the State-owned Assets Supervision and Administration Commission; CSRC; Shanghai Stock Exchange; Shenzhen Stock Exchange), stakeholders in the supply chain (e.g., upstream suppliers and downstream customers), and the public to pay special attention to greenwashing behavior and environmental conservation of enterprises located in provinces with increasingly divorce–marriage ratio.
Second, the positive association between the divorce–marriage ratio and a firm's greenwashing depends on industry-specific and CEO-specific characteristics, which motivates the regulatory bodies to further limit the scope of regulated firms due to environmental conservation and greenwashing behavior. Especially, the regulatory bodies should be paid close attention to firms in regions with higher divorce–marriage ratio and in high polluting (and/or competition) industries, as well as firms in provinces with higher unstable marital status and with lowly educated CEOs (and/or male CEOs), which are closely associated with higher extent (likelihood) of greenwashing behavior.
Lastly, compared with western countries, environmental consciousness and legislation in China are still in the infancy, and thus environmental regulations and laws have fallen behind the deteriorating natural environment. Even worse, when some enterprises are deeply involved in controversial environmental issue, they try to cover up their environmentally unfriendly behavior by greenwashing. In this regard, the reduction effect of the environmental protection law on corporate greenwashing, as well as the mitigating effect of the environmental protection law on the positive relation between the divorce–marriage ratio and corporate greenwashing, suggests that China's legislative and regulatory bodies (e.g., National People's Congress and CSRC) should formulate and implement laws and regulations related with environmental conservation to strengthen corporate environmental consciousness and responsibility and further to mitigate corporate greenwashing.
Limitations and future directions
Our study has three limitations that can be addressed in future research. First, in our study, marital demography at the province level is employed to examine the effect of the divorce–marriage ratio on corporate greenwashing. Also, individual-level divorce data are adopted to conduct additional test to ensure that our findings are robust. In this regard, future research can further address the concern about whether and how marital status of CEO or top managers leads to corporate greenwashing. Second, our study focuses on the Chinese context, so it should be very cautious to generalize our conclusions to other contexts. The marriage and divorce in China must be registered according to the Marriage Law (the Codified Law), which is very different from those in western countries. As a result, the differences in the commitment and responsibility to the matrimony, combined with individualistic (collectivistic) social cultures, may result in different divorce–marriage ratio. Third, in this study, we employ marital demography as the proxy for individualism in the Chinese society and examine its impact on corporate greenwashing. However, as a matter of fact, Confucianism is a multidimensional concept (Du, Reference Du2021), and it is interesting and useful to investigate business practices and their connection with local culture and history. In this regard, it is a pending and important issue to further investigate how culture in China is becoming individualistic and then how individualism affects corporate behavior including corporate greenwashing.Footnote 9 Lastly, we call on future research to focus on the international setting and use cross-national data to examine whether the effect of the divorce–marriage ratio on corporate greenwashing is similar or different across countries.
Conclusion
This study examines the relation between marital demography, proxied by the divorce–marriage ratio, and a firm's greenwashing behavior, and further investigates the moderating effect of CEPL. The findings reveal the positive effect of the divorce–marriage ratio on corporate greenwashing, and further above effect is weakened by CEPL. Our findings are robust to a variety of alternative proxies for marital demography and corporate greenwashing, and our conclusions are valid after controlling for the endogeneity issue. In addition, the positive effect of the divorce–marriage ratio on greenwashing is more pronounced for firms in high polluting industries, in high competition industries, with lowly educated CEOs and with male CEOs.
Financial support
We acknowledge the financial support from the National Natural Science Foundation of China (the approval numbers: NSFC-71790602; NSFC-71572162) and the Key Project of Key Research Institute of Humanities and Social Science in Ministry of Education (the approval number: 16JJD790032).
Conflict of interest
All the authors declare that they have no conflict of interest.
Ethical standards
This article does not contain any studies with human participants or animals performed by any of the authors.
Appendix 1: Variable definitions

Appendix 2: The determinants of corporate environmental performance
Appendix 3: Descriptive statistics of corporate environmental performance based on the GRI Sustainability Reporting Guidelines