Expert surveys are a common tool for measuring latent concepts in the comparative social sciences. From electoral integrity (Norris et al., Reference Norris, Frank and Martínez i Coma2014) to varieties of democracy (Lindberg et al., Reference Lindberg, Coppedge, Gerring and Teorell2014) to policy horizons (Warwick, Reference Warwick2005) and the quality of bureaucracies (Teorell et al., Reference Teorell, Dahlström and Dahlberg2011), data derived from expert evaluations proliferate throughout comparative politics. One of the most prominent uses of expert surveys has been to obtain information about the policy positions of political parties (Benoit and Laver, Reference Benoit and Laver2006; McElroy and Benoit, Reference McElroy and Benoit2010; Rohrschneider and Whitefield, Reference Rohrschneider and Whitefield2012; Bakker et al., Reference Bakker, De Vries, Edwards, Hooghe, Jolly, Marks, Polk, Rovny, Steenbergen and Vachudova2015; Polk et al., Reference Polk, Rovny, Bakker, Edwards, Hooghe, Jolly, Koedam, Kostelka, Marks, Schumacher, Steenbergen, Vachudova and Zilovic2017).
A central concern about using expert surveys to estimate party positions pertains to the cross-national comparability of respondent placements (Budge, Reference Budge2000; McDonald et al., Reference McDonald, Mendes and Kim2007). If experts for each country place only parties within one party system, can we be sure that respondents for France use a particular scale in the same way as their colleagues that complete a survey for the parties of Lithuania? At a time when party government faces representational challenges from both populism and technocratic management (Caramani, Reference Caramani2017) and other analysts speak of a crisis of party democracy (Invernizzi-Accetti and Wolkenstein, Reference Invernizzi-Accetti and Wolkenstein2017), it becomes all the more pressing to understand the comparability of fundamental measures in widely used data on party politics.
Prior research indicates that expert placements of political parties on the economic left-right dimension are cross-nationally comparable throughout Europe (Bakker et al., Reference Bakker, Jolly, Polk and Poole2014). Yet, we also know that politics in many contemporary European democracies is multidimensional, and that a “second” dimension, which we follow Hooghe and Marks (Reference Hooghe and Marks2009) in calling gal-tan (green/alternative/libertarian (gal) to traditional/authority/nationalism (tan)), is an important determinant of public opinion and party competition on issues such as immigration and European integration (Bornschier, Reference Bornschier2010; Kriesi et al., Reference Kriesi, Grande, Dolezal, Helbling, Höglinger, Hutter and Wüest2012; Rovny, Reference Rovny2014; Hobolt and de Vries, Reference Hobolt and de Vries2015). As challenger parties that emphasize this cultural dimension become more prominent across the continent (Hobolt and Tilley, Reference Hobolt and Tilley2016), we require a deeper understanding of the cross-national comparability of this more complex dimension in today's politics.
In addition to the gal-tan dimension, European integration has taken on increasing political importance, as the Euro crisis and migration challenges have made clear (Bechtel et al., Reference Bechtel, Hainmueller and Margalit2014; Copelovitch et al., Reference Copelovitch, Frieden and Walter2016). Although scholarship suggests that citizens perceive party shifts on European integration (Adams et al., Reference Adams, Ezrow and Somer-Topcu2014) and even infer parties’ EU positions based on coalitions (Adams et al., Reference Adams, Ezrow and Wlezien2016), we still know less about the cross-national comparability of the European integration dimension. In short, while there is evidence that the left-right dimension “travels well” for expert survey respondents, it remains unclear if this is the case for other prominent dimensions of political competition in contemporary European societies.
The cross-national comparability of party positions is of increasing importance to social scientists for several reasons. First, party policy diffuses across national borders, with parties learning from and adapting to successful strategies in neighboring countries (Böhmelt et al., Reference Böhmelt, Ezrow, Lehrer and Ward2016). Second, the organization of political groups in the European Parliament and switching between groups is largely driven by questions of policy congruence between the national and transnational levels (McElroy and Benoit, Reference McElroy and Benoit2010). Although truly transnational European party competition is currently underdeveloped (Schmitt et al., Reference Schmitt, Hobolt and Popa2015), several features of European politics point in this direction and thus require additional information about the cross-national comparability of party positions.
To address these concerns, we combine anchoring vignettes embedded in the 2014 Chapel Hill Expert Survey (CHES) on party positions in Europe with Bayesian scaling techniques (Aldrich and McKelvey, Reference Aldrich and McKelvey1977; Hare et al., Reference Hare, Armstrong, Bakker, Carroll and Poole2015). We begin by briefly describing the 2014 wave of the CHES, with a focus on the anchoring vignettes pertaining to economic left-right, gal-tan, and European integration positions. We then provide a brief overview of the Bayesian Aldrich–McKelvey (BAM) scaling procedures used to recover cross-nationally comparable scaled positions on these three dimensions for political parties in Europe. From there, we compare the rank orderings of political parties in the unscaled and adjusted data to examine what differences exist between them. We close by discussing the ramifications of our findings for expert surveys and analysis of European party competition.
1 Scaling party positions
The 2014 Chapel Hill Expert Survey is designed to measure the positions of political party leadership on dimensions and policies related to the economy, socio-cultural matters, and European integration (Bakker et al., Reference Bakker, De Vries, Edwards, Hooghe, Jolly, Marks, Polk, Rovny, Steenbergen and Vachudova2015; Polk et al., Reference Polk, Rovny, Bakker, Edwards, Hooghe, Jolly, Koedam, Kostelka, Marks, Schumacher, Steenbergen, Vachudova and Zilovic2017). Each expert placed the parties of one party system, which creates some uncertainty as to whether the experts for one country differ systematically in their use of the various policy scales from experts that completed the survey for a different country. To address this concern, a series of anchoring vignettes were presented to every respondent at the end of the survey (King et al., Reference King, Murray, Salmon and Tandon2004; King and Wand, Reference King and Wand2007; Bakker et al., Reference Bakker, Jolly, Polk and Poole2014). These vignettes described the positions of three hypothetical parties for three dimensions: economic left-right, gal-tan, and European integration.Footnote 1 Unlike the majority of the survey, every CHES respondent had the opportunity to place these hypothetical vignette parties on the same three scales, which could then be used as bridging information to facilitate comparison of the respondents’ other placements.
When survey respondents in different contexts answer the same survey questions, there is the potential that these respondents have different interpretations of the response categories. This is especially true when the response categories represent relative positions on a latent scale, such as left-right ideology. Differential-item functioning (DIF) occurs when such a scale is interpreted differently across a range of respondents. DIF can lead to a distortion of the placements of stimuli (i.e., political parties) on a given scale. For example, a British party expert and a Greek party expert may view the end points of a pro/anti EU integration scale in slightly different ways, confounding the ability to compare parties’ positions across these two countries. Although this is a less important distinction within a given country, these distortions could be problematic when comparing positions of parties across countries.
Aldrich and McKelvey (Reference Aldrich and McKelvey1977) developed an estimation technique aimed at correcting DIF in perception/placement scales. Their solution, Aldrich–McKelvey scaling (henceforth A-M), assumes that there exists a true placement for a given stimulus (i.e., party) and that any individual placement of a stimulus is a linear distortion of this true placement. The A-M solution allows each survey respondent to have her own “distortion” parameters, while treating the true placement of a stimulus as fixed across respondents. These parameters allow different respondents to shift the true placement to the left or right and/or to expand or contract distances between placements on the underlying scale.
Significantly, though, A-M does not allow for missing data from the respondents, which is problematic since the CHES asks country-specific experts to place parties in only one country. That is, British experts place only British parties and Greek experts place only Greek parties. When the country-specific data are combined, the resulting data matrix contains large amounts of missingness, as British experts do not place Greek parties, etc. With this structure, classic A-M scaling is not an option.
A second limitation is that A-M does not yield uncertainty estimates for the stimuli positions. This complicates our ability to discern whether or not two different parties are statistically distinguishable from one another on some dimension. For example, we would not be able to determine whether one party was more pro-EU than another party. While there are options to approximate uncertainty estimates (i.e., bootstrapping), the procedure itself does not yield such information.
To overcome these limitations, we use the BAM scaling procedure developed in Hare et al. (Reference Hare, Armstrong, Bakker, Carroll and Poole2015). These authors placed political candidates and survey respondents on a common ideological scale, using President Obama and the two parties as the common stimuli or “bridging votes”. Their data are strikingly similar to ours in that only respondents from a candidate's home state place that candidate, which leads to an abundance of missingness in the final data set.
As described above, the 2014 CHES includes anchoring vignettes that we use as bridge votes to construct a cross-nationally comparable scale. BAM scaling easily handles the missing data in our model as missing values are automatically imputed via Markov chain Monte Carlo (MCMC). MCMC also directly produces measures of uncertainty that reflect both variance in the observed placements of parties as well as the degree of missingness for a given party. This yields larger standard errors for parties with fewer placements.
We specified prior positions for the vignette party placements that respect the ordering of the vignettes. This is what King et al. (Reference King, Murray, Salmon and Tandon2004) refer to as vignette equivalence and is a requirement of anchoring vignette-based scaling. That is, in order to be included in the model, experts must correctly perceive the ordering of the vignette parties.Footnote 2 Vignette equivalence is achieved in the CHES, with 90.0 percent of experts correctly ordering the EU vignettes and 97.6 percent of the experts correctly ordering gal-tan.Footnote 3 The BAM routine allows us to produce a cross-nationally comparable scale for the economic left-right, gal-tan, and pro/anti-EU dimension for 249 parties based on the input of 333 experts.Footnote 4
Figure 1 provides an illustration of these distributions by plotting the mean and 95 percent credible interval of the ten most extreme pro- and anti-EU parties.Footnote 5
Ten most pro- and anti-EU parties.

These placements help us to identify the most extreme parties on these dimensions across the members of the EU. For example, as Figure 1 illustrates, in terms of the EU dimension, the liberal parties of Italy and Finland are at the pro-EU end of the scale whereas the Greek KKE and UKIP are among the most anti-EU integration positions. Parties in the BAM rescaled data generally match expectations, lending some face validity to the data. Yet, it is obviously important to examine the rescaled data more carefully and test their performance in analysis.
2 Comparing positions
Does the scale produced by the BAM procedure differ interestingly from the unscaled placements in the CHES data? The correlations between the raw and rescaled measures are very high, between 0.97 and 0.99. As an additional test of the raw versus rescaled measures, we replicated Marks et al. (Reference Marks, Hooghe, Nelson and Edwards2006), who model support for European integration in 2002 using the economic and gal-tan dimensions. In Appendix C, we used the rescaled dimensionality measures created in this paper to replicate and extend this earlier study of party-based Euroskepticism using 2014 party positions. First, this replication supports the key finding in that paper, namely that ideological extremism is still a crucial factor to consider in understanding party-based Euroskepticism in 2014. Second, the replication offers compelling evidence that the raw and rescaled data perform rather similarly in these models, which lends confidence to users of the raw, unadjusted CHES scores.
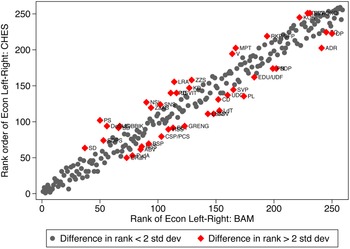
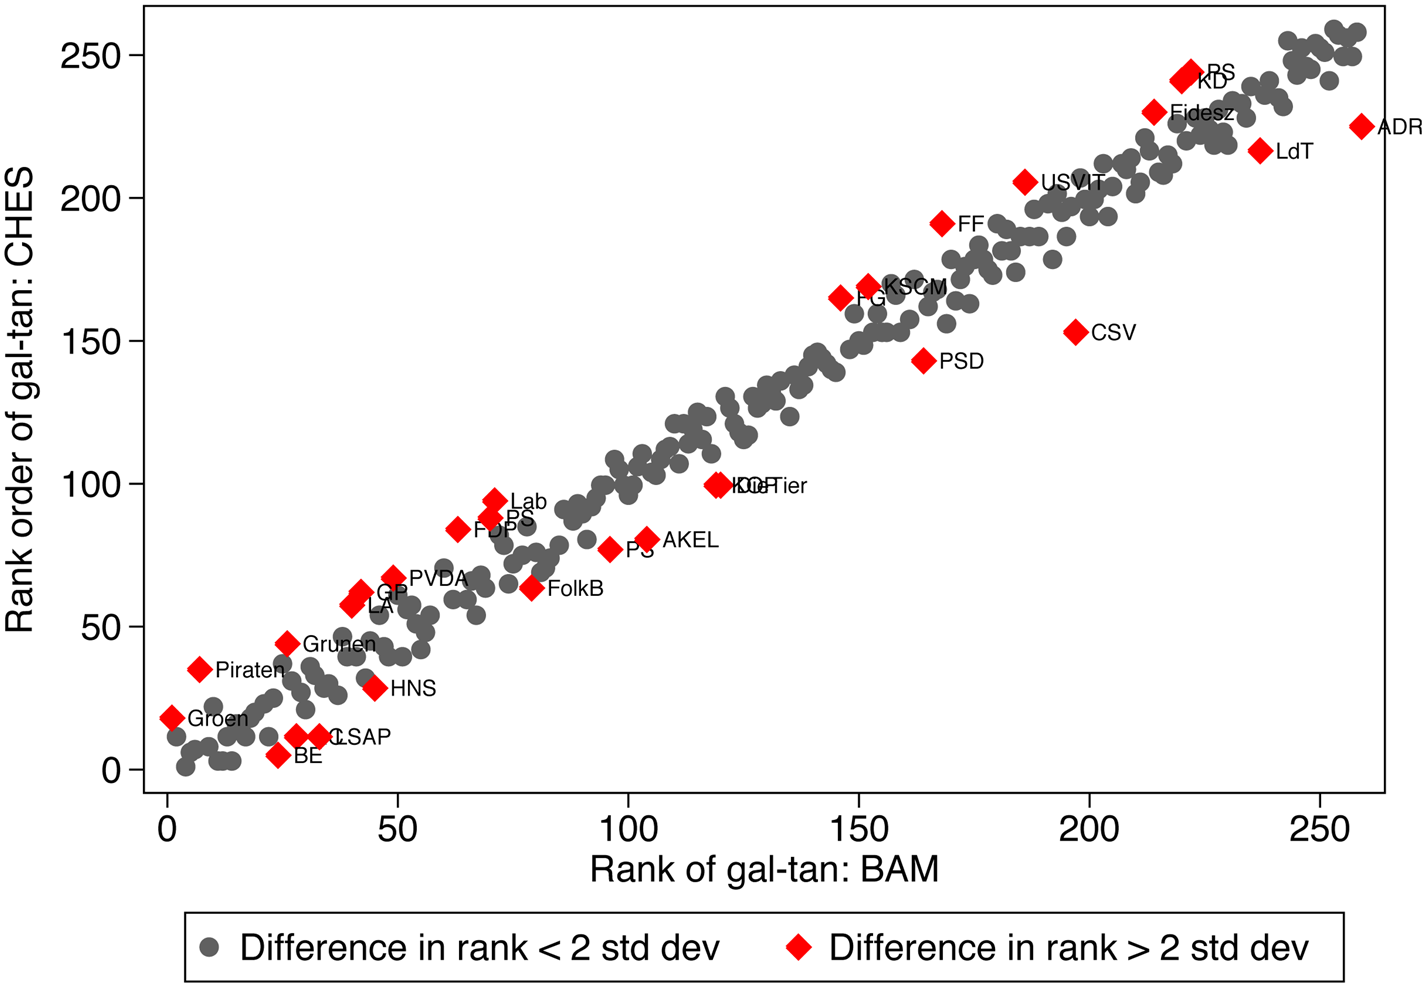
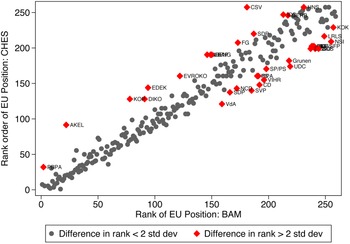
To explore this further, we sorted the data based on their rank orders on the two scales and plotted these against each other. Thus, we created two new variables for each dimension that range from 1 to 249, representing the lowest to highest values on each dimension. Next, we plot these two sets of rank orders against each other. If there were no differences in the rank orders between the BAM solution and the unscaled expert placements, the points would fall close to a 45 degree line. To the extent that the rank orders differ, the points diverge from the “perfect” fit. Figures 2–4 display these comparisons.
Comparison of economic left-right rank orders.

Comparison of gal-tan rank orders.

Comparison of EU positions.

In these plots, we highlight (with red diamonds) parties that differ in rank ordering between the two scales by at least two standard deviations in the rank ordering changes of the placements. These plots show that while there are some differences in the rank ordering across the two scales, for a majority of the parties in the data, these differences are not very large. It is particularly remarkable that the difference between the raw and adjusted data is the smallest for gal-tan, which contradicts our expectations given the complexity of this dimension relative to economic left-right and variation in its content from country to country.
Figure 4 shows that the EU dimension reflects the most change in the rank ordering of the parties. We interpret this as meaning that placements of parties on the pro/anti EU integration scale are the most vulnerable to DIF and, as such, the vignettes have the biggest effect when estimating this scale, whereas the gal-tan dimension appears to be the least vulnerable to DIF. We therefore focus the remainder of our analysis on the EU dimension.
3 EU DIF
In this section, we discuss differences in the raw and rescaled data for pro-EU party placements, because, as is apparent in Figure 4, the majority of the parties with rank order changes between the raw and BAM-adjusted data larger than two standard deviations are on the pro-EU end of the scale.
Figure 5 presents the average change in rank order EU positions for the party families of Europe. Christian Democrats show a conspicuously larger average change in rank ordering from the raw to rescaled data than other party families. This is noteworthy because Christian Democratic parties are both historically associated with driving the European integration project forward and the most pro-EU party family in the 2014 data (6.3 on the 7-point scale). This indicates that expert respondents placed Christian Democrat parties as more pro-EU than they should have given the way these same experts placed the EU vignette parties. We tentatively speculate that this could be an example of the ideological legacy of the party family and its relationship to the EU “pushing” expert placements of the Christian Democrat parties toward more pro-EU positions. The relatively small amount of changes in rank order for the most anti-EU party families in Europe, i.e., the Radical Right and Radical Left, provides additional evidence that the bulk of the changes in moving from the raw to BAM-adjusted data are located on the pro-EU side of the scale.
Changes in rank order EU position, by party family.

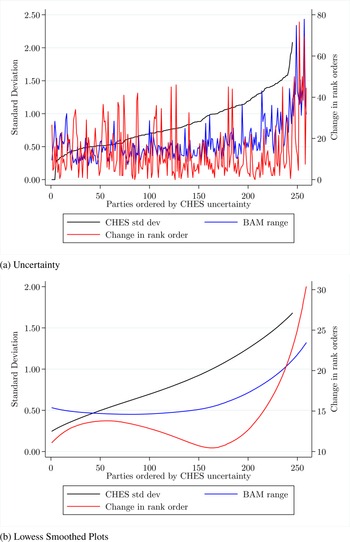
Briefly, we consider other reasons why some parties and party families shift positions more between the raw CHES scores and the BAM-adjusted placements. In Figure 6(a,b),Footnote 6 we show the relationship between expert uncertainty (as measured by standard deviations of the expert-based CHES EU position), BAM range (the uncertainty estimates for the BAM measure), and rank order changes.
EU position uncertainty and rank order changes. (a) Uncertainty and (b) Lowess Smoothed Plots

Both figures show the relationship is noisy and not simply linear, but the smoothed plot in Figure 6(b) demonstrates that more uncertainty in either the raw CHES or the BAM-adjusted positions tends to be associated with bigger changes in the rank orders.
We also explored one of the key factors in CHES uncertainty: number of experts. Using smoothed plots, Figure 7 compares EU rank order changes to economic and gal-tan. For all three dimensions, a smaller number of expert placements is associated with an increase in the number of rank order changes in party positions between the raw and adjusted scales. Note also that this relationship is weaker for economic left-right, arguably the simplest and most cohesive dimension on which experts are tasked with placing parties, but stronger for the typically more complex gal-tan dimension and European integration.
Number of experts and rank order changes.

Finally, we conducted a simple regression analysis of rank order changes across our three dimensions of interest: EU position, economic left-right, and gal-tan. The model includes our measure of uncertainty (BAM range), number of experts, ideological positions, salience, vote share, and a dummy for Eastern Europe.Footnote 7 As expected from the descriptive figures, a higher number of experts is associated with less rank order change (significant for EU and gal-tan, negative but insignificant for economic left-right) and BAM uncertainty is associated with more rank order change. Similarly, it also tends to be the case that more pro-European parties change rank orders on the EU dimension more than Euroskeptic parties.
4 Discussion
In this article, we combined a series of anchoring vignettes that depicted hypothetical political parties with Bayesian scaling techniques to produce cross-nationally comparable party positions on economic left-right, gal-tan, and European integration. There was already growing evidence that the economic left-right dimension travels well across Europe (Bakker et al., Reference Bakker, Jolly, Polk and Poole2014). Our findings here indicate that party positions on gal-tan and European integration also show a high degree of pan-European comparability. That is, the BAM scaling solution produces a cross-contextually comparable measure and given that the raw expert party positions are so closely related to the rescaled party positions, we are more confident in the cross-national comparability of the experts placements. These findings are significant both because these dimensions make up increasingly prominent aspects of party competition in Europe, and because it suggests that the items included in the Chapel Hill Expert Surveys measure these dimensions effectively. For CHES users, these results provide more confidence in the cross-national comparability of the CHES party positions.
These findings offer additional reassurance for those that work with expert surveys. On the whole, the rank order changes between the unscaled and scaled estimates we examine, while limited, are best explained by the uncertainty in party placements, which is a function of the uncertainty in the raw expert placements as well as the number of expert placements for each party. This means that the estimates in which experts have less confidence are the ones most associated with changes in ordering between the two scales, which provides more evidence that researchers should take uncertainty estimates seriously when using point estimates of party positions. Further, we supply empirical support for the intuition that the number of experts placing the parties is also associated with rank order changes between the raw and adjusted scales. For the gal-tan dimension and European integration scales, as the number of experts decreases, rank order changes increase. Future expert surveys should thus work to increase the number of respondents, while maintaining a consistent focus on rigorous criteria for inclusion as an expert.
Our findings also generate intriguing questions for future research on European politics and representation. In particular, the fact that meaningful differences between the scaled and unscaled positions on European integration tend to be concentrated at the pro-EU side requires examination. But in sum, the work that we present here supports the cross-national comparability of key concepts for party competition in contemporary European societies, and further bolsters the Chapel Hill Expert Survey as a valuable data source for political parties.
Supplementary material
To view supplementary material for this article, please visit https://doi.org/10.1017/psrm.2020.26.