Implications
This study found no effects of either increasing milk replacer feeding level within a fixed volume of liquid or protein content on age at calving of dairy heifers coupled with no milk production effects. The results from this study indicate no long-term benefits of an increased level of nutrition during the milk-feeding period. The findings from the current study provide information on which to base feeding strategies in the pre-weaning period for dairy herd replacements.
Introduction
Traditionally, in European dairying systems calves have been offered restricted quantities of either milk replacer (MR) or whole milk during the first 2 months of life, but more recently more intensive feeding of young dairy calves has been suggested as a more appropriate method of rearing dairy herd replacements. Van Amburgh et al. (Reference Van Amburgh, Tikofsky and Smith2001) and Drackley (Reference Drackley2005) suggested the adoption of much higher levels of feeding in addition to higher MR protein content (260 to 280 g crude protein (CP)/kg) in order to better meet the protein requirements of rapidly growing muscle. The aim of this ‘accelerated’ growth regime is to exploit the high lean tissue growth potential of young calves and promote greater lean growth without fattening. Diaz et al. (Reference Diaz, Van Amburgh, Smith, Kelsey and Hutten2001) suggested that feeding an MR of 300 g/kg CP increased lean tissue deposition without fattening, whereas Blome et al. (Reference Blome, Drackley, McKeith, Hutjens and McCoy2003) and Bartlett et al. (Reference Bartlett, McKeith, VandeHaar, Dahl and Drackley2006) showed that feeding increased MR protein concentration while maintaining a constant energy density decreased body fat content. However, it is important to note that calves in these studies were offered a milk-only diet with no supplementary starter concentrates that is not reflective of commercial husbandry practices for dairy herd replacements in the United Kingdom and Ireland (Morrison et al., Reference Morrison, Carson, Matthews and Mulholland2009a). A number of studies have reported improved animal performance when offering calves accelerated feeding regimes but few have found any long-term benefits of such regimes in later life. For example, Morrison et al. (Reference Morrison, Wicks, Fallon, Twigge, Dawson, Wylie and Carson2009b) investigated the effects of both MR CP level (210 or 270 g/kg dry matter (DM)) and level of MR intake (600 g or 1200 g MR/day offered at 120 g MR/l) on calf growth and development. Despite showing increased growth rates with increasing MR feeding level at time points during the first year of life, MR feeding regime had no effect of milk production during the first or second lactation.
To achieve higher MR intakes, Morrison et al. (Reference Morrison, Wicks, Fallon, Twigge, Dawson, Wylie and Carson2009b) offered calves an increased volume of MR at a fixed mixing rate but a number of authors have suggested that mixing rate should increase when adopting an accelerated growth feeding regime to ensure liquid volume does not inhibit MR intake. Diaz et al. (Reference Diaz, Van Amburgh, Smith, Kelsey and Hutten2001) increased the MR mixing rate from 15% to 18% as the feeding level increased and achieved MR intakes of >1.5 kg/day facilitating DLWG in excess of 1 kg/day. To our knowledge, no study has examined the effect of MR mixing rate with calves reared in a group situation fed using computerised milk and concentrate dispensers.
Accelerated pre-wean growth based on elevated MR feeding levels and MR protein concentrations has been shown to influence nitrogen (N) metabolism. Previous studies (Bartlett et al., Reference Bartlett, McKeith, VandeHaar, Dahl and Drackley2006; Morrison et al., Reference Morrison, Wicks, Fallon, Twigge, Dawson, Wylie and Carson2009b) have reported increased blood urea concentrations with calves offered MRs with higher CP concentrations indicative of a reduction in N utilisation. However, Blome et al. (Reference Blome, Drackley, McKeith, Hutjens and McCoy2003) reported an improvement in the efficiency of N utilisation as MR CP concentration increased, whilst Bartlett et al. (Reference Bartlett, McKeith, VandeHaar, Dahl and Drackley2006) reported an increased efficiency in CP utilisation with increasing MR feeding level. In both studies, no calf starter concentrate was offered, and therefore, the effects of additional protein supply from MR on N metabolism in these mixed type of calf diets also requires investigation.
In view of this background, the primary objective of this study was to examine the effect of increasing nutrient intake, through altering MR mixing rate and CP content of the MR, on calf performance from birth to weaning (in terms of weight gain and skeletal size), and to examine residual effects on performance through to the end of the first lactation. The second objective was to ascertain the effect of MR feeding level and MR CP content on N and energy metabolism of calves when offered whey-based MR in combination with calf starter concentrate.
Material and methods
In order to achieve the objectives two studies were performed. The first study examined the effect of MR feeding level and CP content on calf growth, development and lactational performance. The second study determined the effect of dietary treatment on nutrient digestibility, retention and absorption.
Calf growth and development study
Animals
A total of 65 Holstein–Friesian heifer calves, born between 1 October and 17 March, were sourced from the Institute's dairy herd and transferred to the experiment following weighing at <12 h old, and this weight was recorded as birth weight. Their mean birth weight was 42.4 kg (s.d. = 5.12) and mean genetic merit (PIN) was £41.0 (s.d. = 9.86). Calves not observed suckling the mother received 2 l of colostrum via oesophageal tube or teated feeding bottle before transfering to the calf-rearing unit.
Treatments and experimental design
A 4 × 2 factorial design was used comprising of four levels of MR in 6 l of water to supply 500, 750, 1000 and 1250 g/day (Table 1) and two levels of MR CP 230 g/kg DM or 270 g/kg DM. The calves were randomly allocated, to one of these eight treatments at 4 days of age to give either seven or eight replicates per treatment. Calves were introduced to their allocated MR treatment on day 5 and remained on this treatment until day 56. All procedures involving animals were carried out under the authority of Animal (Scientific Procedures) Act 1986.
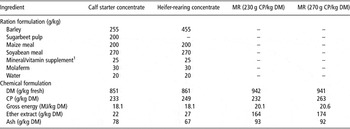
Formulation of the MR, calf starter concentrate and heifer-rearing concentrate

MR = milk replacer; CP = crude protein; DM = dry matter.
1The mineral and vitamin composition of the premix was copper (as cupric sulphate) 3000 mg/kg and selenium (as sodium selenite) 45 mg/kg; and the vitamins A (450 000 IU/kg); and E (as α-tocopherol; 4000 IU/kg).
Feeding and housing
On entering the rearing accommodation (at <12 h old), calves were penned in groups of not more than three. From day 5, calves were group-housed in straw-bedded pens with a maximum of 25 calves per pen. Calves received colostrum for the first 4 days of life (2 l fed twice daily), and a mix of half colostrum and half MR on day 5. On day 5, calves were introduced to one of two automatic calf milk feeders (operating with four holding pens), calibrated so as to provide each calf a predetermined daily amount of MR. From day 5 until weaning at day 56, MR was fed via automatic teat feeders (Forster-Technik, Engen, Germany) with the full allowance available immediately with a maximum meal size of 2 l. MR allowance was reduced in steps from day 49 to weaning at day 56. The concentrations of MR (based on fresh weight) were 7.7%, 10.4%, 14.3% and 17.2% for calves offered the 500, 750, 1000 and 1250 g MR/day, respectively.
The MRs were whey-based, containing mainly milk-derived protein (1.5% non-milk protein from spray-dried hydrolysed wheat protein), which was primarily formulated using whey-protein isolate produced by ultra filtration (Nutreco Ruminant Research Centre, Boxmeer, The Netherlands) (Table 2). A free-flow agent (aluminium silicate) was added to the powder to allow feeding through the automated machines. The flowing agent was responsible for the small increase in ash content compared with that reported in other studies (e.g. Bartlett et al., Reference Bartlett, McKeith, VandeHaar, Dahl and Drackley2006). Drinking water and straw were available at all times throughout the study.
Intake of MR and concentrate for Holstein–Friesian calves offered a range of MR treatments

MR = milk replacer; CP = crude protein; DM = dry matter; ns = non-significant.
1Significance: *P < 0.05; **P < 0.01; ***P < 0.001.
2Intakes expressed on a fresh basis.
Calf starter concentrate was offered ad libitum from day 5 via computerised automated concentrate feeders (Forster Technik) located at the front of the group pens. Formulation of the pelleted calf starter concentrate is shown in Table 1. Both milk and concentrate feeders were calibrated weekly throughout the study.
After weaning until turnout to grass in May, calves were offered grass silage ad libitum supplemented with 2 kg of concentrates/head per day. Calves were re-housed during October and then returned to pasture in April for their second summer grazing period before calving.
Fertility management and lactation performance
Oestrus detection was carried out three times a day from 6 months of age up to a confirmed pregnancy diagnosis. Heifers were artificially inseminated (AI) by a trained stockperson. Timing of insemination was based on age (aiming to calve heifers down at 24 months) and weight (minimum live weight of 315 kg). Heifers (n = 57) were presented for AI and full first lactation milk production data were recorded for 49 of these animals. Reasons for the loss of heifers during the lactation included mortality or culling due to injury/illness (n = 7) and not sustaining a lactation of >250 days (n = 1). Milk yield and composition were obtained monthly using United Dairy Farmers’ milk recording system (accredited by the International Committee for Animal Recording).
Measurements and sampling
Individual MR and concentrate intakes were recorded using the automated computer programme (Kalbman supplied by Forster Technik) on 5 days/week from day 5 until weaning at day 56. Live weight was recorded weekly and skeletal size (withers height and heart girth; Hoffman, Reference Hoffman1997) fortnightly throughout the pre-weaning phase of the study. Body condition score (BCS) was also recorded fortnightly (Edmondson et al., Reference Edmondson, Lean, Weaver, Farver and Webster1989). After weaning, live weight, skeletal size and body condition were recorded at monthly intervals. Concentrate and milk powder samples were analysed for DM, CP, gross energy, ether extract and ash within the research institute as described by Cushnahan and Gordon (Reference Cushnahan and Gordon1995) with appropriate modifications for the analysis of MR.
Statistical analysis
Statistical analysis was carried out using Genstat 6 (Lawes Agricultural Trust, 2002). Weekly feed intakes were analysed using repeated measures analysis of variance (ANOVA) with calves as the subjects, week as the time effect and fitting fixed effects of the two CP concentrations × four feeding levels of factorial treatment structure. Live weight, body size measurements, milk production and fertility data were analysed using ANOVA with fixed effects for the feed level, CP and their interaction. In addition, for the milk production data, post-calving dietary regime and PIN value were also included in the model. Contrasts were calculated to test for linear and quadratic effects of increasing MR feeding level.
Energy and N metabolism study
Forty-four autumn-born Holstein–Friesian bull calves were randomly allocated to the treatments as described in the previous study. From day 5 until weaning at 56 days, MR was fed via teated buckets in two 3-l feeds/day. Calves were housed in pairs by treatment and given access to water and calf starter ad libitum. Live weight was recorded at weekly intervals throughout the study. Single-point blood samples were taken, after morning feeding, from the jugular vein using lithium heparin coated Vacutainer sample tubes (Becton Dickinson, Plymouth, UK) at fortnightly intervals from day 5 to 10 weeks of age. Following centrifugation, plasma aliquots were frozen at −20°C until assayed. Plasma total protein, albumin and urea analyses based on kinetic UV and photometric colour tests were carried out using Roche Diagnostics’ (East Sussex, UK) kits on a Olympus clinical chemistry analyser. Globulin concentration was calculated as total protein concentration minus albumin concentration.
Calves were placed in metabolism stalls for 5 to 6 days between 3 and 8 weeks of age divided into two periods (3 to 5 and 5 to 8 weeks of age for periods 1 and 2, respectively). Total output of faeces and urine were recorded and samples were taken for N, ash, gross energy and DM analysis, where appropriate. The methods of chemical analyses are described by Steen (Reference Steen1989). Faeces and urine samples from eight calves were omitted from the N and energy analyses study due to incomplete separation. In addition, a further 17 samples were omitted from the energy analysis as they were lost in storage. In total, N balances were carried out on 36 calves and energy digestibility on 19 calves. The N and energy data were analysed using restricted maximum likelihood (REML) to fit firstly a model with fixed effects of period, level of MR feeding, level of MR CP content and their two-way interactions. As there were no significant feeding level by CP interactions this was followed by a model with no interaction terms, and then one with no interaction terms and with the qualitative term for the effects of the level of MR feeding replaced with quantitative terms for its linear, quadratic and cubic effects. The live weight data were analysed using REML to fit firstly a model with fixed effects for level of MR feeding, level of MR CP content and their interaction. This was followed by a model with no interaction term, and then one with no interaction term and with the qualitative term for the effects of the level of MR feeding replaced with quantitative terms for its linear, quadratic and cubic effects. Blood sample analysis data were analysed using REML to fit a model with fixed effect for level of MR feeding, level of MR CP content, age and their interactions.
Results
Growth and development study
There were no significant interactions between level of MR feeding and MR CP content, consequently only the main treatment effects are presented.
Intake
MR intake
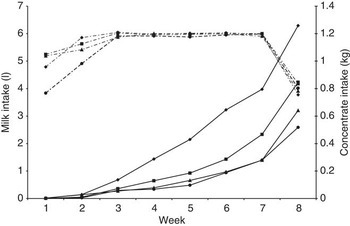
MR intake increased from 4.8 l/day in week 1 to 5.5 l/day in week 2. From weeks 3 to 7 MR intake in all treatment groups remained constant. There was an MR by week interaction (P < 0.001) with calves offered the 1250 g of MR taking 1 week longer to achieve the fixed target volume of milk intake (Figure 1). Intakes were similar for both MR (230 and 270 g CP/kg DM; Table 2).
Milk replacer (MR; —) and concentrate intake (-) during the pre-weaning phase for calves offered 500 (⧫), 750 (▪), 1000 (▴) and 1250 g MR/day (●).

Calf concentrate intake (pre-weaning)
Level of MR had a significant effect on concentrate intake (P < 0.001). Over the range of MR levels offered in this study, a 100 g increase in MR allowance decreased concentrate intake by 39 g/day (P < 0.001; s.e. = 0.01; Table 2). There was a significant level of MR by week interaction (P < 0.001) with calves offered higher levels of MR taking longer to consume a given level of concentrate (Figure 1). The CP content of the MR had no effect on concentrate consumption by the calves (Table 2).
Growth and development characteristics
Live weight and liveweight gain
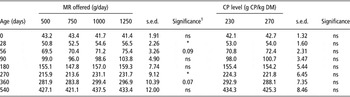
At 28 days of age, a 100 g increase in allocation of MR increased live weight by 0.76 kg (P < 0.05; s.e. = 0.39). At weaning, calves offered 500, 750, 1000 and 1250 g MR/day were 70, 70, 71 and 75 kg, respectively. Resultant daily liveweight gains (DLWG) were significantly greater with increased MR feeding level between days 0 and 28 (P < 0.001) and 0 and 56 (P < 0.01), but there was no difference between days 28 and 56. CP content of the MR had no effect on the live weight of calves at any stage (Table 3).
Live weight of calves offered a range of MR treatments (kg)

MR = milk replacer; CP = crude protein; DM = dry matter; ns = non-significant.
1Linear significance.
*P < 0.05.
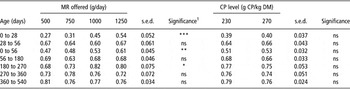
From weaning at day 56 until 6 months of age, liveweight gain of calves was not affected by the pre-weaning dietary treatment (average DLWG of 0.67 kg; Table 4). At day 270, heifers that had been offered increased levels of MR were greater in live weight (P < 0.05); however, by day 540 these differences had disappeared.
Daily liveweight gains for calves offered a range of MR treatments (kg/day)

MR = milk replacer; CP = crude protein; DM = dry matter; ns = non-significant.
1Linear significance.
*P < 0.05; **P < 0.01; ***P < 0.001.
Skeletal size and BCS
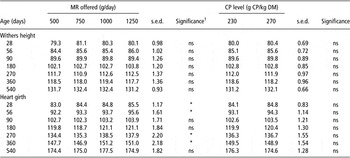
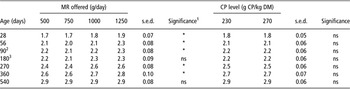
There was no effect of MR feed level or MR protein concentration on withers height from days 28 to 540 (Table 5). On both days 28 and 56, calves offered increasing MR feed level had an increased heart girth (P < 0.05), with every 100 g increase in MR allowance resulting in an increase in girth of 0.32 cm (s.e. = 0.15) and 0.42 cm (s.e. = 0.21), respectively. Although differences in heart girth with calves offered increasing MR allowances were found at approximately 9 and 12 months of age by day 540, there was no significant effect of MR level. Increasing calf BCS with increasing MR feeding level was evident throughout the first year, but by day 540 these differences had disappeared (Table 6).
Withers height and heart girth (cm) for calves offered a range of MR treatments

MR = milk replacer; CP = crude protein; DM = dry matter; ns = non-significant.
1Linear significance.
*P < 0.05.
Body condition score (1 to 5 scale) for calves offered a range of MR treatments

MR = milk replacer; CP = crude protein; DM = dry matter; ns = non-significant.
1Linear significance.
2Quadratic tendency P = 0.06.
3Quadratic tendency P = 0.08.
*P < 0.05.
Fertility
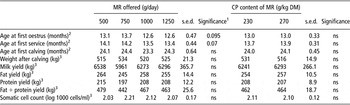
There was a linear tendency for a decreased age at first observed oestrus (P = 0.095) and first service (P = 0.07) with increasing MR feeding level although this did not result in significant differences in age at first calving (Table 7). MR CP content had no effect on age at first observed oestrus, service or age at first calving.
Breeding performance and milk production (305 days) of first lactation heifers offered a range of MR treatments

MR = milk replacer; CP = crude protein; DM = dry matter; ns = non-significant.
1Linear significance.
2Based on 14, 14, 15 and 14 heifers offered 500, 750, 1000 and 1250 g milk replacer (MR)/day, respectively, with 27 and 30 heifers offered MR containing 230 and 270 g CP/kg DM, respectively.
3Based on 12, 11, 12 and 14 heifers offered 500, 750, 1000 and 1250 g MR/day, respectively, with 23 and 26 heifers offered MR containing 230 and 270 g CP/kg DM respectively.
Lactational performance
There were no treatment effects on live weight at first calving or on milk yield or milk composition during the first lactation. There was also no treatment effect on somatic cell counts (Table 7).
Energy and N metabolism study
Live weight and liveweight gain
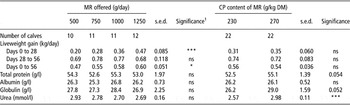
Calves offered increased quantities of MR grew faster between 0 and 28 days of age but no difference was detected from days 28 to 56 (Table 8). MR CP content had no effect on calf live weight or liveweight gain during the study.
Daily liveweight gain and blood plasma metabolites in male calves offered a range of MR treatments

MR = milk replacer; CP = crude protein; DM = dry matter; ns = non-significant.
1Linear significance.
*P < 0.05; **P < 0.01; ***P < 0.001.
Blood parameters
MR feeding level had no effect on blood total protein, albumin, globulin or urea concentration (P > 0.05); however, MR CP concentration significantly increased blood urea concentration (P < 0.001) while tending to increase both total protein (P = 0.05) and globulin concentrations (P = 0.05).
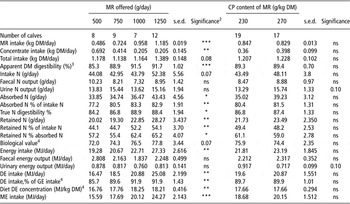
Dietary intake, nutrient digestibility and utilisation
An increase in MR allowance was accompanied by a linear decrease in concentrate consumption (Table 9; P < 0.01) with every 100 g increase in MR allowance reducing concentrate intake by 61 g (s.e. = 0.02). In addition, a significant positive linear (P < 0.001) and quadratic (P < 0.05) relationship was found between increasing MR feeding level and DM digestibility. As the MR allowance increased, quantities of N absorbed, true N digestibility, retained N as percentage of N intake all increased linearly (P < 0.05, P < 0.05 and P < 0.01, respectively). MR CP concentration had no significant effect on any N metabolism variables; however, there was a tendency for an increase in urine N output (P = 0.10) with calves offered the 270 compared with 230 g CP/kg DM MR.
DM and N intakes, apparent digestibilities and retained N from male calves offered a range of MR treatmentsFootnote 1

DM = dry matter; N = nitrogen; MR = milk replacer; CP = crude protein; ns = non-significant; DE = digestible energy; ME = metabolisable energy; GE = gross energy.
1 30 d.f. with DM/N variables and 13 d.f. with energy variables.
2 Linear significance.
3 Quadratic significance P < 0.05.
4 Quadratic tendency P < 0.10.
Biological value calculated as outlined by National Research Council (NRC) (2001).
Increasing MR feeding level was accompanied by a linear increase in gross energy intake (P < 0.01), with every 100 g increase in MR allowance increasing energy intake by 1.35 MJ/day. Neither feeding level nor MR protein concentration had an effect on faecal or urinary energy output but increasing MR allowance increased (P < 0.01) the digestible energy concentration of the diet. Digestible energy as a proportion of gross energy intake and digestible energy concentration of the diet showed significant linear responses with increasing MR feeding level with both variables showing curvilinear tendencies.
Discussion
Dairy calves are one of the few farm animals that are subjected to restricted milk intake in early life. It has been recently proposed that increased feeding rates of MR during the pre-wean phase can lead to improvements in heifer performance in later life (e.g. Van Amburgh et al., Reference Van Amburgh, Tikofsky and Smith2001). However, there is little scientific evidence for these claims of longer-term benefits. The current studies enabled an evaluation of the immediate effects of selected MR treatments on nutrient digestion and animal performance during the pre-weaning phase and an examination of the longer-term effects on growth and subsequent lactational performance.
Influence of increasing MR intake on calf performance
As per the design of the study, offering MR at over 200 g/l in this study enabled calves to consume 1.1 kg of MR/day. This level of intake, approximately twice the normal feeding level used in commercial systems in the United Kingdom, was greater than that reported by Morrison et al. (Reference Morrison, Wicks, Fallon, Twigge, Dawson, Wylie and Carson2009b) with calves offered 1200 g MR/day mixed into 10 l of water. When MR was fed at 120 g/l, calves were unable to consume 9 to 10 l of milk through the automatic feeding system until 4 weeks of age (Morrison et al., Reference Morrison, Wicks, Fallon, Twigge, Dawson, Wylie and Carson2009b). Elevated nutrient intakes in the first weeks of life are a key element of achieving accelerated growth; therefore, as hypothesised, increasing the mixing rate rather than volume was a more effective method of increasing MR intake when feeding calves using automatic feeding systems. Calf starter concentrate acts like a ‘buffer’ feed reducing the negative impact of reduced milk intake once appetite for dry feed had been established. Thus, in agreement with previous findings, as MR intake increased, concentrate intake declined (Fallon et al., Reference Fallon, Wicks and Twigge2005) with each 100 g/day increase in MR allowance reducing concentrate intake by 39 and 60 g/day in the current studies. Concentrates have been shown to encourage rumen development, more so than milk or forage (Heinrichs and Lesmeister, Reference Heinrichs and Lesmeister2005); therefore, preparing the calf for the ruminant diet. As calf starter concentrate is substantially less expensive than MR rearing costs can be reduced significantly if similar growth rates can be achieved with less MR but increased quantities of concentrates. As a consequence of increased concentrate intake with calves offered the lower MR feeding levels, average daily total DM intakes pre-weaning were similar between treatments in the current studies.
Increased MR intake, as was reported previously (e.g. Morrison et al., Reference Morrison, Wicks, Fallon, Twigge, Dawson, Wylie and Carson2009b), caused an increase in calf live weight, girth and BCS between birth and weaning but no differences were found after heifers reached 1 year of age. In contrast, Shamay et al. (Reference Shamay, Werner, Moallem, Barash and Bruckental2005) found calves that were offered a higher plane of nutrition pre-weaning (whole milk ad libitum v. 450 g MR/day) continued throughout the first 550 days to be greater in live weight but not body size, than calves fed a restricted pre-weaning diet. DLWG recorded in this study from birth to weaning (day 56) ranged from 0.5 to 0.6 kg/day and are comparable with values reported in the literature (Fallon, Reference Fallon1983; Bar-Peled et al., Reference Bar-Peled, Robinson, Maltz, Tagari, Folman, Bruckental, Voet, Gacitua and Lehrer1997; Blome et al., Reference Blome, Drackley, McKeith, Hutjens and McCoy2003; Speijers et al., Reference Speijers, Langa, Struthers, Twigge and Scaife2005). High growth rates (⩾ 1 kg/day) outlined by Drackley (Reference Drackley2008) have only been recorded in a limited number of studies such as Diaz et al. (Reference Diaz, Van Amburgh, Smith, Kelsey and Hutten2001) and Bork et al. (Reference Bork, Smith, Foote and Van Amburgh2000) with both studies feeding to percentage body weight resulting in MR DM intakes approaching 2.5 kg/day (Diaz et al., Reference Diaz, Van Amburgh, Smith, Kelsey and Hutten2001). Studies reporting growth rates of approximately 0.7 to 0.9 kg/day are relatively numerous in number but are with calves offered whole milk (Bar-Peled et al., Reference Bar-Peled, Robinson, Maltz, Tagari, Folman, Bruckental, Voet, Gacitua and Lehrer1997; Jasper and Weary, Reference Jasper and Weary2002; Shamay et al., Reference Shamay, Werner, Moallem, Barash and Bruckental2005) or with calves that are 2 weeks old at least before commencement of the study (Brown et al., Reference Brown, VandeHaar, Daniels, Liesman, Chapin, Keisler and Weber Nielsen2005a; Fallon et al., Reference Fallon, Wicks and Twigge2005; Bartlett et al., Reference Bartlett, McKeith, VandeHaar, Dahl and Drackley2006). To our knowledge, this study is the only study that has examined the effect of increasing the level of MR only with group-housed Holstein–Friesian calves with individual recording of MR and concentrates intake from birth.
Influence of increasing the CP content on live weight and body size
Drackley (Reference Drackley2000) in a review of the literature concluded that in order to achieve 0.6 kg/day liveweight gain a CP level of 253 g/kg DM is required, stating that the higher CP content of MR was required to achieve higher rates of gain without elevated levels of fat deposition. This was later reiterated by Van Amburgh and Tikofsky (Reference Van Amburgh and Tikofsky2001) in a similar review that indicated to achieve 0.7 kg/day liveweight gain, an MR containing 260 to 280 g CP/kg DM is required. Contrary to this, in both the current studies, MR CP concentration had no effect on calf growth with the average liveweight gain from birth to weaning 0.51 and 0.53 kg/day for calves offered MR containing 230 and 270 g CP/kg DM, respectively. These values are lower than the values stated by Van Amburgh and Tikofsky (Reference Van Amburgh and Tikofsky2001) and Drackley (Reference Drackley2000), and it was only calves offered 1250 g MR/day that achieved liveweight gains approaching the values stated by these authors. On the basis of energy and CP requirements (National Research Council (NRC), 2001) calves offered the 270 g CP/kg MR at 1250 g/day should have grown at ∼1.0 kg/day. However, these elevated growth rates were not reached with calves achieving a DLWG of 0.6 kg/day during the milk-feeding period. Numerous factors could potentially limit DLWG compared to NRC estimates such as diet quality or environmental stresses. For example, with calves being housed in groups in this study, energy requirements for activity would have been greater than those housed individually, which is the rearing system from which the data were obtained to create the NRC model. Only one study has reported calf growth rates from birth in excess of 0.75 kg/day in group-rearing accommodation (Bleach et al., Reference Bleach, Gould, Blackie and Beever2005) and this was achieved by offering ad libitum MR resulting in consumption >1.1 kg of MR DM/day. Dietary factors such as protein quality have been shown to affect the rate of DLWG through changes in protein digestibility and absorption. For example, Dawson et al. (Reference Dawson, Morrill, Reddy and Minocha1988) reported a significant reduction in DM, N digestibility as well as N retention, when soya protein replaced milk protein in the MR. Although the MRs used in this study contained a proportion of non-milk-derived protein (1.5% spray-dried hydrolysed wheat protein), dietary evaluation, through metabolism studies, indicated the diets offered were of good quality.
N and energy metabolism
Diaz et al. (Reference Diaz, Van Amburgh, Smith, Kelsey and Hutten2001) found calves offered greater MR feeding levels increased the quantity of retained N leading to higher growth rates but no effect on the efficiency of N utilisation was recorded. Increased MR CP concentration has been shown to increase calf growth rate and decrease the proportion of fat within the liveweight gain (Donnelly and Hutton, Reference Donnelly and Hutton1976a and Reference Donnelly and Hutton1976b; Blome et al., Reference Blome, Drackley, McKeith, Hutjens and McCoy2003). This in part has been facilitated by increased quantities of retained N and improved N utilisation with calves offered MR of higher CP concentration (Blome et al., Reference Blome, Drackley, McKeith, Hutjens and McCoy2003). These studies were based on liquid-only diets with few studies having examined N and energy metabolism in pre-weaned dairy calves offered MR and concentrates. In this study, increasing MR feeding level increased DM, N and gross energy digestibilities as well as the quantity of retained N; however, MR protein content had no effect on N digestibility or metabolism. In agreement with this study, Hill et al. (Reference Hill, Knowlton, Daniels, James, Pearson, Capuco and Akers2008) reported restricted MR diets that encouraged calf starter intake were lower in overall DM and N digestibility reflective of a greater proportion of concentrate of lower digestibility in the diet of calves offered a lower MR feeding level.
Hill et al. (Reference Hill, Knowlton, Daniels, James, Pearson, Capuco and Akers2008) reported that calves that were offered greater quantities of MR had a numerical increase in the efficiency of N retention. In this study, as MR feeding level increased, there was a linear increase in the efficiency of N retention. It is likely that the majority of this effect reflected changes in the MR : concentrate ratio of the diet rather than MR feeding per se.
Efficiency of N retention (0.49, s.e = 0.013) in this study, which was greater than that reported by Blome et al. (Reference Blome, Drackley, McKeith, Hutjens and McCoy2003) and Holmes and Davey (Reference Holmes and Davey1976), was unaffected by MR CP concentration. This was in contrast to findings reported by Blome et al. (Reference Blome, Drackley, McKeith, Hutjens and McCoy2003) with calves offered MR with increased CP concentration showing increased efficiency of N retention.
Biological value (BV) is often used as a measure of the efficiency of N deposition of digested N. The NRC (2001) model assumes a BV of 76% for MR plus calf starter diets based on the weighted average of MR (BV = 80%) and starter (BV = 70%). In this study, calves offered the highest MR feeding level and consuming minimal amount of concentrate had a diet BV of 78%. This suggests that MR protein quality was similar to that which forms the basis of the NRC (2001) model and therefore not the reason for calves in this study failing to achieve growth rates predicted by the NRC model. MR protein content had no effect of diet BV, with calves offered both MR types having equally high values comparable with those previously reported with skim-based MR (Donnelly and Hutton, Reference Donnelly and Hutton1976b).
Male calves offered increased quantities of MR had greater digestible and metabolisable energy intakes supporting the observed increases in calf growth rate. This increase in calf growth with increasing MR feeding level mirrored the findings of the heifer calf growth and development study in which increased growth rates were accompanied by increasing BCSs that may reflect greater body fat deposition. ‘Accelerated’ calf growth programmes are based on both elevated MR feeding and protein levels to encourage lean growth; yet, MR CP had no effect on growth or BCS in line with the fact that MR CP had no effect on nutrient digestion and retention.
Long-term effects of pre-weaning nutrition
Through an elevated plane of nutrition during the pre-weaning period Bar-Peled et al. (Reference Bar-Peled, Robinson, Maltz, Tagari, Folman, Bruckental, Voet, Gacitua and Lehrer1997) and Raeth-Knight et al. (Reference Raeth-Knight, Chester-Jones, Hayes, Linn, Larson, Ziegler, Ziegler and Broadwater2009) increased DLWG from 0.45 and 0.65 to 0.85 and 0.80 kg/day, respectively. The same authors monitored heifer performance through into later life showing a 28 to 31-day reduction in first-calving age with heifer calves that were offered a higher feed level up to weaning. In this study, despite a tendency for a lower age at first observed oestrus, no difference in age at first calving was found with calves offered increased levels of MR. This agrees with the findings of a number of other studies that have compared traditional and accelerated pre-weaning nutritional regimes (Aikman et al., Reference Aikman, Gould and Bleach2007; Drackley et al., Reference Drackley, Pollard, Dann and Stamey2007; Morrison et al., Reference Morrison, Wicks, Fallon, Twigge, Dawson, Wylie and Carson2009b; Terre et al., Reference Terre, Tejero and Bach2009).
It has been postulated that ‘accelerated growth’ regimes for dairy calves could lead to increased milk production in later life. Potential mechanisms for this increase in production have been suggested, such as improved mammary gland development. Daniels et al. (Reference Daniels, McGilliard, Meyer, Van Amburgh, Capuco and Akers2009) and Brown et al. (Reference Brown, VandeHaar, Daniels, Liesman, Chapin, Forrest, Akers, Pearson and Weber Nielsen2005b) reported potentially positive effects of increased nutrient intake on mammary gland development during the first weeks of life when clear differences in DLWG were apparent. However, Meyer et al. (Reference Meyer, Capuco, Ross, Lintault and Van Amburgh2006a) having examined heifers at up to 350 kg found no effect of increased nutrient intake on mammary parenchyma DNA content concluding that age at which mammary samples are taken, and not level of nutrient intake, was the main determinant of pre-pubertal mammary development. Subsequent follow-up studies found minimal effects of elevated levels of nutrition on the expression of a number of genes (Meyer et al., Reference Meyer, Rhoads, Capuco, Connor, Hummel, Boisclair and Van Amburgh2007), mammary epithelial cell proliferation or the rate of parenchyma DNA accretion (Meyer et al. (Reference Meyer, Capuco, Ross, Lintault and Van Amburgh2006b).
Shamay et al. (Reference Shamay, Werner, Moallem, Barash and Bruckental2005), Bar-Peled et al. (Reference Bar-Peled, Robinson, Maltz, Tagari, Folman, Bruckental, Voet, Gacitua and Lehrer1997) and Drackley et al. (Reference Drackley, Pollard, Dann and Stamey2007) are the only studies to find a significant positive relationship between level of pre-weaning nutrition and subsequent milk production. Both Shamay et al. (Reference Shamay, Werner, Moallem, Barash and Bruckental2005) and Bar-Peled et al. (Reference Bar-Peled, Robinson, Maltz, Tagari, Folman, Bruckental, Voet, Gacitua and Lehrer1997) compared whole milk with restricted MR, whereas Drackley et al. (Reference Drackley, Pollard, Dann and Stamey2007) reported significant increases in milk production with increased feeding levels of MR. However, the majority of published studies (Davis-Rincker et al., Reference Davis-Rincker, VandeHaar, Wolf, Liesman, Chapin and Weber-Nielsen2006; Aikman et al., Reference Aikman, Gould and Bleach2007; Morrison et al., Reference Morrison, Wicks, Fallon, Twigge, Dawson, Wylie and Carson2009b; Raeth-Knight et al., Reference Raeth-Knight, Chester-Jones, Hayes, Linn, Larson, Ziegler, Ziegler and Broadwater2009; Terre et al., Reference Terre, Tejero and Bach2009) and this study have failed to show any significant effect of level of pre-weaning nutrition on milk production.
Conclusions
Increases in pre-weaning calf growth as a result of increased MR allowance were facilitated by increased energy and N intake combined with an increase in diet digestibility and N retention. However, differences in live weight and body size recorded at or before weaning (56 days) had disappeared by 12 to 18 months. There was no benefit of a high CP MR (270 g CP/kg DM) over an MR containing 230 g CP/kg DM. Increasing the MR feeding level before weaning reduced the age at first observed oestrus but had no effect on calving age, weight or first lactation milk production.
Acknowledgements
The authors thank Mr A. Brown and the staff of the dairy heifer-rearing unit for help with collection of data. This work was funded by the Department of Agriculture and Rural Development for Northern Ireland. The authors would also like to acknowledge the support of Nutreco Ruminant Research Centre.