Introduction
Childhood obesity is a growing global health concern and is associated with a wide range of comorbidities, including dyslipidaemia, coronary artery disease, hypertension, obstructive sleep apnoea syndrome, and type 2 diabetes mellitus Reference Poirier and Eckel1According to the Framingham Heart Study, obesity is an independent and potent risk factor for sudden cardiac death. Reference Hubert, Feinleib, McNamara and Castelli2 Ventricular arrhythmias, a leading cause of sudden cardiac death, can occur due to myocardial fibrosis, hypertrophy, altered autonomic tone, and impaired conduction related to fat infiltration in obese individuals. Reference Abel, Litwin and Sweeney3–Reference Monitillo, Leone, Rizzo, Passantino and Iacoviello5
Surface electrocardiogram remains a practical and widely accessible tool for arrhythmic risk assessment. Among several repolarisation-related electrocardiogram parameters, the index of cardiac electrophysiological balance, calculated as the ratio of QT to QRS durations (QT/QRS or QTc/QRS), has emerged as a novel marker of arrhythmic vulnerability. Reference Lu, Yan and Gallacher6–Reference Efe, Oz, Guven, Kambur, Topacoglu and Karabag8 Index of cardiac electrophysiological balance reflects the balance between cardiac depolarisation and repolarisation phases and has been associated with malignant ventricular arrhythmias in adult populations, even in the absence of overt cardiac disease. Reference Sivri and Çelik7–Reference Söner, Okşul and Güzel9
While studies in adults have reported associations between elevated body mass index and increased index of cardiac electrophysiological balance/corrceted form of index of cardiac electrophysiological balance values, there is limited and inconsistent data regarding these indices in children with obesity. Whether obesity alone, in the absence of other comorbidities, influences electrophysiological balance in paediatric populations remains unclear.
Therefore, the aim of this study was to evaluate the impact of obesity on index of cardiac electrophysiological balance and corrected form of index of cardiac electrophysiological balance values in children without structural heart disease or pharmacologic confounders and to investigate the relationship of these indices with metabolic and anthropometric parameters.
Methods
Study design and population
This retrospective cross-sectional study was conducted at the Pediatric Cardiology Outpatient Clinic of Marmara University. Medical records of children aged 10 to 18 years who were referred between January 1, 2023, and January 1, 2025, were reviewed. A total of 62 children with obesity, defined according to age- and sex-specific body mass index percentiles, were initially identified. Twelve of these patients had a diagnosis of hypertension and were receiving calcium channel blockers, which are known to potentially influence electrocardiographic parameters. These patients were excluded from the analysis. The final study cohort thus comprised 50 obese children.
The control group consisted of 23 age- and sex-matched children with normal BMI. These individuals were referred for non-cardiac reasons, including school health certification, pre-participation sports evaluation, or routine screening, and had no known cardiovascular disease.
This research received no specific grant from any founding agency in the public, commercial, or not- for-profit sectors.
Data collection
Demographic data, clinical characteristics, and anthropometric measurements were retrieved from the hospital’s electronic medical records. Biochemical and hematological data—including fasting plasma glucose, serum insulin, HbA1c, total cholesterol, low density lipoprotein-cholesterol (LDL-C), high density lipoprotein-cholesterol (HDL-C), triglycerides, and complete blood count—were also obtained from routine laboratory assessments performed during clinical follow-up. The homeostasis model assessment of insulin resistance was calculated using the standard formula: homeostasis model assessment of insulin resistance = (Fasting insulin [µU/mL] × Fasting glucose [mg/dL])/405.
Electrocardiographic assessment
Standard 12-lead surface electrocardiograms recorded at a paper speed of 25 mm/s and a voltage calibration of 10 mm/mV were retrospectively evaluated. Electrocardiograms were scanned and imported into Adobe Photoshop 2025. All measurements were performed manually at 400% magnification by a single paediatric cardiologist who was blinded to the clinical data. The following parameters were assessed: heart rate, PR interval, P-wave duration (maximum and minimum), P-wave dispersion (calculated as the difference between maximum and minimum P-wave durations), QRS duration, QT and corrected QT (QTc) intervals, QTc dispersion (QTc max − QTc min), Tp-e interval (maximum, minimum, and mean), Tp-e dispersion, Tp-e/QT, Tp-e/QTc, QT/QRS, and QTc/QRS (index of cardiac electrophysiological balance).
Echocardiographic evaluation
Transthoracic echocardiographic examinations were retrospectively reviewed for all participants. Studies were performed using standard paediatric imaging protocols with parasternal long-axis, short-axis, and apical views. Children with structural heart disease were excluded from the study. The following measurements were recorded: interventricular septal thickness in diastole, left ventricular end-diastolic diameter, left ventricular end-systolic diameter, left ventricular posterior wall thickness in diastole, fractional shortening, ejection fraction, aortic root diameter, left atrial diameter, mitral E and A wave velocities, deceleration time, isovolumetric relaxation time, aortic flow velocity, pulmonary artery flow velocity, and descending aortic flow velocity. All echocardiographic measurements were performed retrospectively from archived images by a single paediatric cardiologist who was blinded to clinical and group information. Measurements were conducted independently from the study team to reduce observer bias. Left ventricular systolic function was considered as normal when both fractional shortening and ejection fraction values were within age-appropriate reference ranges.
Ethics statement
This study was approved by the Clinical Research Ethics Committee of Marmara University Faculty of Medicine (Approval No: 09.2025.25-0307, Date: April 18, 2025). All procedures were conducted in accordance with the ethical standards of the institutional research committee and with the 1964 Helsinki Declaration and its later amendments. Since this was a retrospective study, informed consent was waived by the ethics committee.
Statistical analysis
All statistical analyses were performed using Python 3.11 and statistics related packages (scikit-learn, pandas, scipy). The distribution of continuous variables was assessed using the Kolmogorov–Smirnov test. Descriptive statistics were expressed as mean ± standard deviation for normally distributed variables and as median (interquartile range) for non-normally distributed variables. Categorical variables were expressed as frequencies and percentages.
Comparisons between obese and control groups were performed using the independent samples t-test for continuous variables and the Mann–Whitney U test for categorical variables. Prior to applying parametric tests, the homogeneity of variances for continuous variables was assessed using Levene’s test; Student’s t-test was used for variables with homogeneous variances, while Welch’s t-test was applied when the assumption of homogeneity was violated.
Pearson correlation analysis was used to evaluate the association between electrophysiological parameters and metabolic/anthropometric variables, depending on data distribution. Linear regression analysis was performed to identify independent predictors of electrophysiological parameters. A two-tailed p-value < 0.05 was considered statistically significant.
Results
Demographic and clinical characteristics
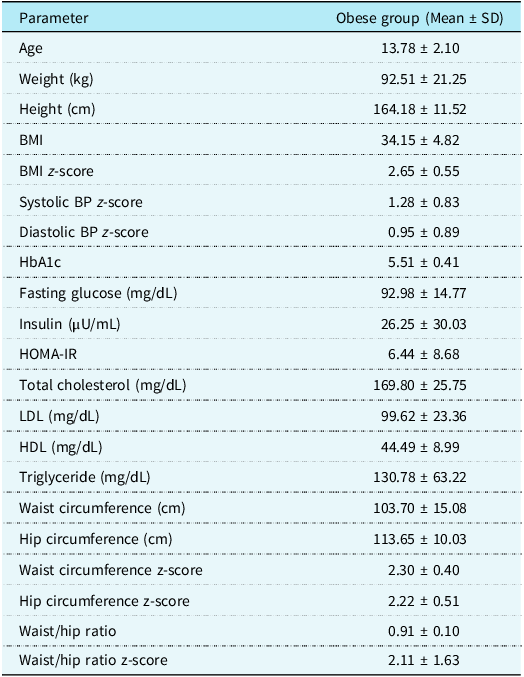
A total of 73 participants were included in the study, comprising 50 children with obesity and 23 healthy controls. There was no statistically significant difference in age between the groups (p = 0.537). The female ratio was 54% in the obese group and 43.5% in the control group (p = 0.411). Body mass index was significantly higher in the obese group compared to the controls (34.15 ± 4.82 kg/m2 vs. 18.66 ± 2.80 kg/m2, p < 0.001). Both systolic and diastolic blood pressure z-scores were also significantly elevated in the obese group (systolic: 1.28 ± 0.83 vs. 0.31 ± 0.83, p < 0.001; diastolic: 0.95 ± 0.89 vs. 0.39 ± 0.73, p = 0.011) (Table 1).
Descriptive characteristics of obese participants: anthropometric and metabolic measures

Table 1. Long description
A table comparing anthropometric and metabolic measures of obese participants. The table has 18 rows and 2 columns. The columns are labeled ‘Parameter’ and ‘Obese group (Mean ± SD)’. The rows list various parameters and their corresponding mean values and standard deviations for the obese group. Parameters include age, weight, height, BMI, BMI z-score, systolic BP z-score, diastolic BP z-score, HbA1c, fasting glucose, insulin, HOMA-IR, total cholesterol, LDL, HDL, triglyceride, waist circumference, hip circumference, waist circumference z-score, hip circumference z-score, waist/hip ratio, and waist/hip ratio z-score. Each row provides specific values for these parameters.
Electrocardiographic parameters
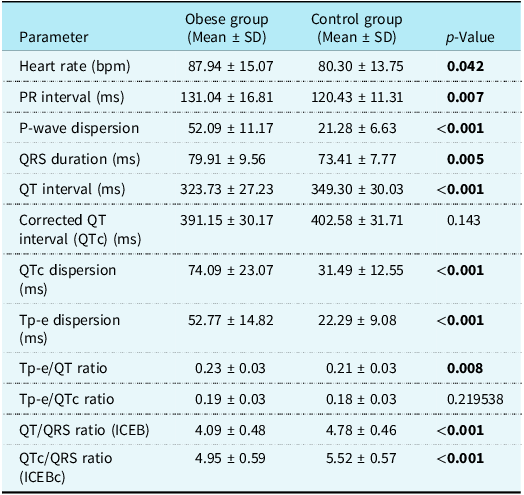
Heart rate was significantly higher in the obese group (87.94 ±15.07 bpm) compared to the control group (80.30 ± 13.75 bpm, p = 0.043). The PR interval (131.04 ± 16.81 ms vs. 120.43 ±11.31 ms, p = 0.008), P-wave duration (88.33 ± 11.57 ms vs. 75.96 ± 9.92 ms, p < 0.001), and P-wave dispersion (52.09 ± 11.17 ms vs. 21.28 ± 6.63 ms, p < 0.001) were significantly greater in the obese group. QRS duration was also longer in the obese group (79.91 ± 9.56 ms vs. 73.41 ± 7.77 ms, p = 0.006).
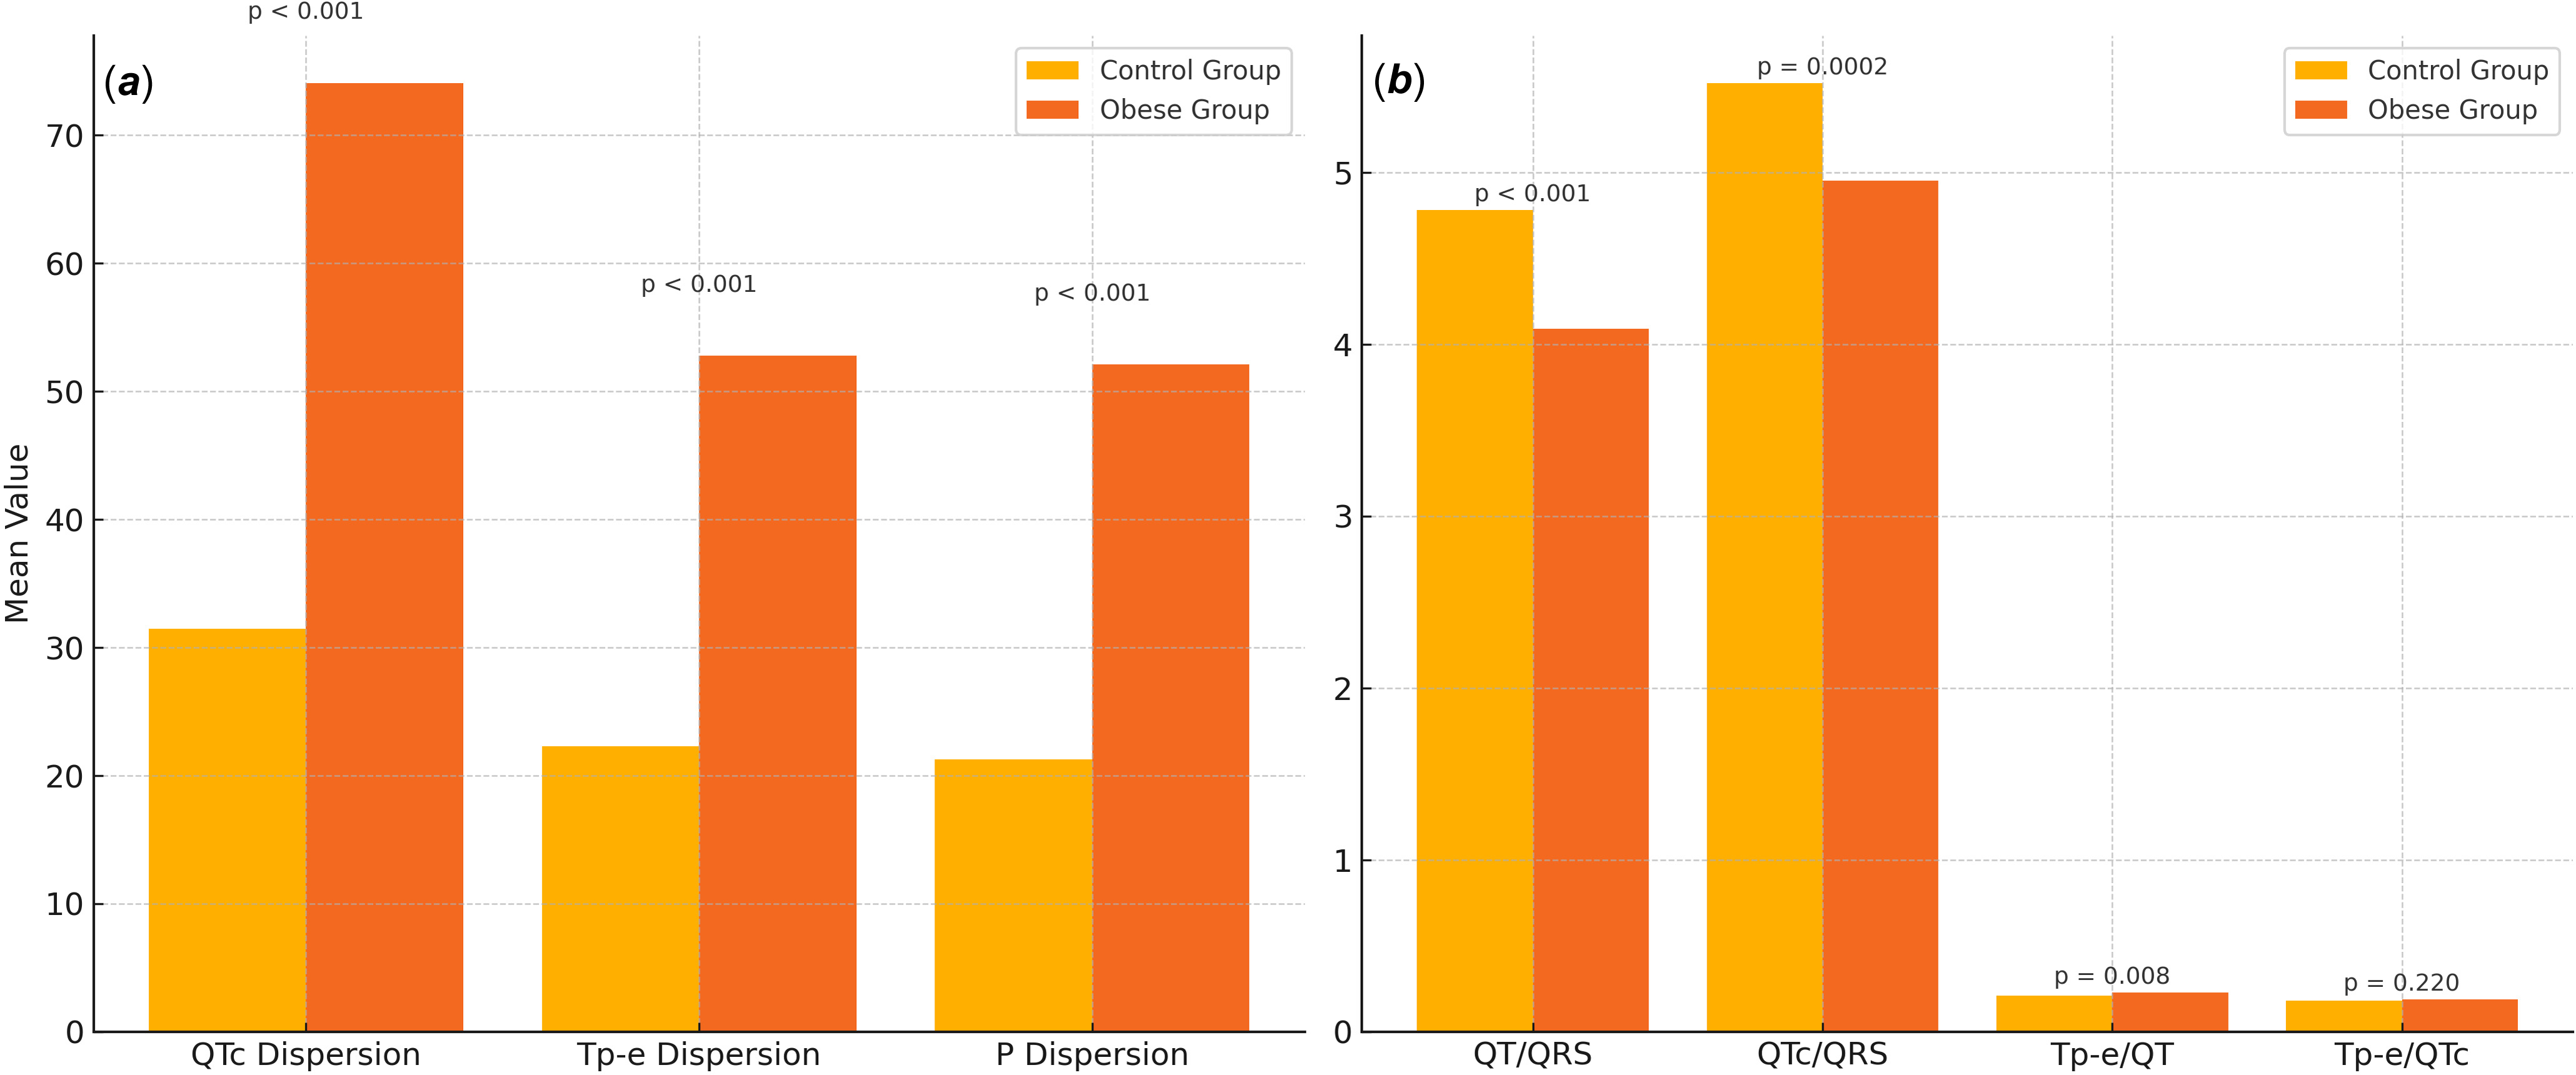
The QT interval was shorter in the obese group (323.73 ± 27.23 ms) compared to the controls (349.30 ± 30.03 ms, p < 0.001), whereas the QTc interval did not differ significantly between groups (p = 0.143). QTc dispersion (74.09 ± 23.07 ms vs. 31.49 ± 12.55 ms, p < 0.001) and Tp-e dispersion (52.77 ± 14.82 ms vs. 22.29 ± 9.08 ms, p < 0.001) were significantly increased in the obese group. The Tp-e/QT ratio was significantly higher in the obese group (p = 0.008), while there was no significant difference in Tp-e/QTc ratio (p = 0.220) (Table 2, Figure 1A).
(A) Comparison of ventricular and atrial repolarization dispersion parameters (QTc dispersion, Tp-e dispersion, and P-wave dispersion) between obese and control groups. (B) Comparison of electrophysiological balance indices (QT/QRS, QTc/QRS, Tp-e/QT, and Tp-e/QTc ratios) between the two groups.

Comparison of electrocardiographic parameters between obese and control groups

Table 2. Long description
The table compares electrocardiographic parameters between obese and control groups, with 12 rows and 4 columns. The columns are labeled Parameter, Obese group (Mean ± SD), Control group (Mean ± SD), and p-Value. The parameters include heart rate, PR interval, P-wave dispersion, QRS duration, QT interval, Corrected QT interval, QT dispersion, Tp-e dispersion, Tp-e/QT ratio, Tp-e/QTc ratio, QT/QRS ratio (ICEB), and QTc/QRS ratio (ICEBc). Each row provides the mean and standard deviation for both groups and the p-value indicating the significance of the difference. Notable trends include shorter QT intervals in the obese group compared to controls, significant differences in QTc dispersion and Tp-e dispersion, and a higher Tp-e/QT ratio in the obese group.
Bold values indicate statistically significant p values (p < 0.05).
Cardiac electrophysiological balance indices
The QT/QRS ratio was significantly lower in the obese group compared to the control group (4.09 ± 0.48 vs. 4.78 ± 0.46, p < 0.001). Similarly, the QTc/QRS ratio was significantly decreased in the obese group (4.95 ± 0.59 vs. 5.52 ± 0.57, p = 0.0002) (Figure 1B).
Echocardiographic findings
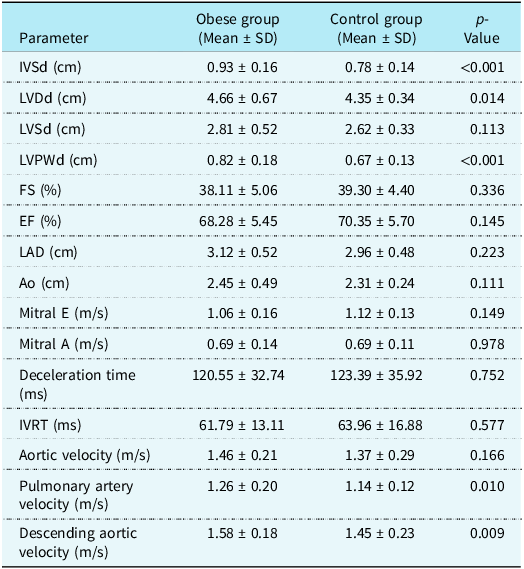
Interventricular septal thickness (IVSd) and left ventricular posterior wall thickness (LVPWd) were significantly increased in the obese group compared to controls (IVSd: 0.93 ± 0.16 cm vs. 0.78 ± 0.14 cm, p < 0.001; LVPWd: 0.82 ± 0.18 cm vs. 0.67 ± 0.13 cm, p < 0.001). Left ventricular end-diastolic diameter (LVDd) was also higher in the obese group (4.66 ± 0.67 cm vs. 4.35 ± 0.34 cm, p = 0.014). No statistically significant differences were observed in left ventricular ejection fraction (EF) or fractional shortening (FS) between groups, and both parameters remained within normal limits in all participants.
Pulmonary artery velocity was significantly higher in the obese group (1.26 ± 0.20 m/s vs. 1.14 ± 0.12 m/s, p = 0.011), as was descending aortic flow velocity (1.58 ± 0.18 m/s vs. 1.45 ± 0.23 m/s, p = 0.010) (Table 3).
Comparison of echocardiographic parameters between obese and control groups

Table 3. Long description
A table comparing echocardiographic parameters between obese and control groups. The table has 19 rows and 4 columns. The columns are labeled Parameter, Obese group (Mean ± SD), Control group (Mean ± SD), and p-Value. Each row lists a specific parameter, such as IVSd, LVDd, LVSd, and others, along with their mean and standard deviation values for both groups and the corresponding p-value. Notable parameters include IVSd, LVPWd, Pulmonary artery velocity, and Descending aortic velocity, which show significant differences between the obese and control groups.
Associations between electrophysiological indices and metabolic/anthropometric parameters
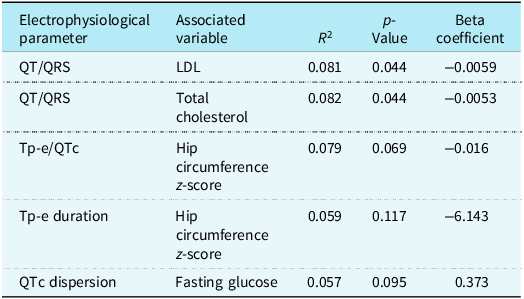
Regression analyses revealed that the QT/QRS ratio was negatively correlated with LDL cholesterol (p = 0.045) and total cholesterol levels (p = 0.044). QTc dispersion demonstrated a borderline association with fasting blood glucose (p = 0.094). Both Tp-e duration and Tp-e/QTc ratio were negatively associated with hip circumference z-score (p = 0.117 and p = 0.069, respectively) (Table 4).
Associations between electrophysiological parameters and metabolic/anthropometric variables – statistically significant findings

Table 4. Long description
A table with five rows and four columns. The columns are labeled ‘Electrophysiological parameter’, ‘Associated variable’, ‘R^2’, ‘p-Value’, and ‘Beta coefficient’. The rows present data on the associations between various electrophysiological parameters and metabolic/anthropometric variables. Row 1: QT/QRS, LDL, 0.081, 0.044, -0.0059. Row 2: QT/QRS, Total cholesterol, 0.082, 0.044, -0.0053. Row 3: Tp-e/QTc, Hip circumference z-score, 0.079, 0.069, -0.016. Row 4: Tp-e duration, Hip circumference z-score, 0.059, 0.117, -6.143. Row 5: QTc dispersion, Fasting glucose, 0.057, 0.095, 0.373.
Discussion
This study demonstrated significant alterations in electrocardiographic parameters, including repolarisation markers and indices of electrophysiological balance, in children with obesity compared to healthy peers. In particular, QT/QRS and QTc/QRS ratios—representing the index of cardiac electrophysiological balance (index of cardiac electrophysiological balance and corrected form of index of cardiac electrophysiological balance)—were significantly lower in the obese group, Reference Lu, Yan and Gallacher6,Reference Sivri and Çelik7 suggesting an association between obesity and altered ventricular electrical stability even in the absence of overt cardiovascular disease. These findings were accompanied by increased QTc and Tp-e dispersions, as well as greater P-wave dispersion, which collectively indicate heterogeneous conduction and repolarisation. Reference Monitillo, Leone, Rizzo, Passantino and Iacoviello5 Such patterns have been associated with elevated arrhythmic risk in previous adult studies, although data in paediatric populations remain limited. To our knowledge, this is the first study to evaluate index of cardiac electrophysiological balance and corrected form of index of cardiac electrophysiological balance specifically in children with obesity. While previous studies have examined the relationship between index of cardiac electrophysiological balance and body mass index in adult populations, Reference Söner, Okşul and Güzel9 corresponding data in paediatric cohorts are scarce.
Despite the absence of overt structural heart disease, echocardiographic assessments revealed significantly increased interventricular septal and posterior wall thickness, along with higher pulmonary artery and descending aortic flow velocities in the obese group. Reference Abel, Litwin and Sweeney3,Reference Molinari, Sardanelli and Zandrino4 These findings suggest increased cardiac workload and potential subclinical vascular changes. Notably, all participants had preserved systolic function and were free from medications that could affect electrocardiogram parameters, supporting the interpretation that obesity-related metabolic and structural changes may contribute to alterations in cardiac electrophysiological balance and potentially increased arrhythmogenic vulnerability in the paediatric population.
In addition to index of cardiac electrophysiological balance and corrected form of index of cardiac electrophysiological balance, we observed significant increases in QTc dispersion, Tp-e dispersion, and P-wave dispersion in the obese group compared to controls. These findings reflect heterogeneous myocardial conduction and repolarisation, which are established substrates for ventricular and atrial arrhythmogenesis. Reference Monitillo, Leone, Rizzo, Passantino and Iacoviello5,Reference De Ambroggi10 Although these arrhythmic manifestations are rarely observed clinically in children, the presence of such subclinical abnormalities may indicate early electrical remodelling potentially associated with obesity.
Recent paediatric studies support our findings. For example, a study published in 2023 reported that obese children had significantly prolonged QTc and Tp-e intervals, along with higher Tp-e/QT and Tp-e/QTc ratios. These findings suggest the presence of electrophysiological alterations associated with arrhythmogenic vulnerability, even in the absence of clinically evident cardiovascular disease. Reference Dağlı, Şap and Oflaz11 Furthermore, a 2025 study investigating children with type 1 diabetes mellitus revealed elevated index of cardiac electrophysiological balance and corrected form of index of cardiac electrophysiological balance values compared to healthy controls, despite the absence of structural heart abnormalities. This suggests that metabolic dysfunction may contribute to alterations in cardiac electrophysiological balance. Reference Ertaş, Gül, Yıldırım and Özalkak12 Collectively, these observations suggest the potential utility of index of cardiac electrophysiological balance and other electrocardiogram-derived markers for detecting early electrophysiological changes in paediatric populations with metabolic risk factors.
In our study, index of cardiac electrophysiological balance (QT/QRS) values were negatively correlated with LDL and total cholesterol levels, consistent with previous findings suggesting that dyslipidaemia can impair myocardial conduction and promote repolarisation heterogeneity by altering membrane excitability and ion channel activity. Reference Manolopoulos, Karpe and Frayn13–Reference Liu, Wu and Lee15 Although these associations were statistically significant, their explanatory power was limited, suggesting that lipid accumulation may contribute only to a limited extent to subclinical electrophysiological disturbances, even in the absence of overt structural cardiac disease.
Interestingly, Tp-e duration and Tp-e/QTc ratio demonstrated inverse correlations with hip circumference z-scores. In contrast, no significant association was observed between waist circumference z-scores and ventricular repolarisation parameters in our cohort. These findings suggest that fat distribution, rather than overall adiposity, may be associated with ventricular repolarisation characteristics in children with obesity, in line with previous reports indicating differing cardiometabolic effects of gluteofemoral versus central adiposity. Reference Alser, Naja and Elrayess16,Reference Koster, Murphy and Eiriksdottir17 However, given the limited effect size, this observation should be interpreted cautiously.
Although not reaching statistical significance, a trend towards increased QTc dispersion with rising fasting glucose levels was observed. This observation is in line with previous studies suggesting that hyperglycaemia and insulin resistance may be associated with delayed ventricular repolarisation through mechanisms involving oxidative stress and altered autonomic regulation. Reference Gallego, Zayas-Arrabal, Alquiza, Apellaniz and Casis18,Reference Hegyi, Borst and Bailey19
Taken together, our findings suggest that metabolic dysregulation and fat distribution patterns—particularly central versus peripheral adiposity—may have distinct and measurable effects on cardiac electrophysiology in children. While further studies are warranted to confirm these relationships in larger paediatric cohorts, our data underscore the importance of incorporating both biochemical markers and anthropometric indices into risk stratification models. Importantly, not just the amount but the location of adipose tissue may influence arrhythmic vulnerability in obese children.
Strengths and limitations
This study has several notable strengths. First, it is the first to evaluate the index of cardiac electrophysiological balance (index of cardiac electrophysiological balance and corrected form of index of cardiac electrophysiological balance) specifically in a paediatric population with obesity, providing novel insights into subclinical arrhythmic risk in the absence of overt cardiovascular disease. The use of a well-defined control group, matched for age and sex, strengthens the validity of the comparisons. Additionally, the exclusion of patients receiving medications that may influence electrocardiographic parameters, such as antihypertensives, ensures that the observed differences are likely attributable to obesity itself rather than pharmacologic confounders. Furthermore, the simultaneous assessment of both electrophysiological and echocardiographic parameters, along with detailed metabolic and anthropometric data, adds a comprehensive perspective to the cardiovascular implications of paediatric obesity.
Nevertheless, several limitations should be acknowledged. The retrospective design may introduce selection and information biases, and causal inference is limited due to the cross-sectional nature of the study. Although the sample size was adequate for detecting between-group differences, the relatively small cohort may restrict the generalisability of the findings. Furthermore, due to the lack of longitudinal follow-up, it remains unclear whether the observed electrophysiological alterations persist over time or are associated with clinically relevant arrhythmias.
Future studies with larger sample sizes, prospective designs, and longitudinal follow-up are needed to confirm these findings and to explore the prognostic value of index of cardiac electrophysiological balance and related electrocardiogram markers in predicting arrhythmic events in children with obesity. Additionally, investigating the effects of weight loss or metabolic interventions on these electrophysiological parameters could offer insight into potential reversibility and clinical implications.
Conclusion
This study demonstrates that obesity in children is associated with significant alterations in electrocardiographic parameters, including reduced index of cardiac electrophysiological balance and corrected form of index of cardiac electrophysiological balance values and increased dispersion markers, even in the absence of structural heart disease or medication use. These findings suggest that obesity may be associated with alterations in cardiac electrophysiological balance, which may be relevant to susceptibility to arrhythmic events at a subclinical level. As the first study to investigate index of cardiac electrophysiological balance and corrected form of index of cardiac electrophysiological balance specifically in a paediatric obese population, our results underscore the importance of early cardiovascular assessment in this high-risk group. Future longitudinal studies are warranted to confirm these findings and to explore the prognostic significance of electrophysiological markers in paediatric obesity.