





Hypertension has become a significant global health concern with over 1·4 billion persons suffering from high blood pressure worldwide(1). This is due to the role it plays in increasing the risk of CVD, stroke and renal failure(Reference Baffour, Jahangiry and Jain2–Reference Kobeissi, Hibino and Pan8). Hypertension is a leading contributor to the global disease burden, accounting for 7·8 % of total disability-adjusted life years(9). The WHO report on hypertension burden found a 41 % rise in hypertension incidence since 1990 among Europe and America, a 144 % increase among Southeast Asian regions and a 135 % increase in African regions(10), highlighting a major cause for concern.
According to the Global Burden of Disease (GBD) study, unhealthy dietary patterns are a major cause of premature deaths worldwide and can be directly correlated with hypertension risk(11). The main dietary risk factors associated with hypertension include diets low in potassium, whole grains, fruit, nuts/seeds and vegetables and high in Na, red and processed meat and excess amounts of added sugar and sugar-sweetened beverages(Reference Schwingshackl, Schwedhelm and Hoffmann12–Reference Ozemek, Laddu and Arena14).
Nuts, in particular, are a nutrient-dense food, rich in unsaturated fats, protein, fibre, vitamins, minerals and bioactive compounds such as polyphenols and phytosterols. Nuts and their dietary constituents are believed to contribute to cardiovascular health through several mechanisms(Reference Glenn, Aune and Freisling15), including improving endothelial function(Reference Xiao, Huang and Peng16), reducing inflammation(Reference Rajaram, Damasceno and Braga17) and enhancing lipid profiles(Reference de Souza, Schincaglia and Pimentel18). However, the specific impact of nut consumption on blood pressure remains a topic of ongoing research. Several clinical guidelines for CVD now recommend the consumption of nuts for cardiovascular health, including the American Heart Association(Reference Lichtenstein, Khera and Anderson19) and the European Society of Cardiology(Reference Lichtenstein, Appel and Vadiveloo20). Several systematic reviews and meta-analyses evaluating a total of thirty-five different randomised controlled trials have previously shown significant reductions in blood pressure with nut consumption(Reference Mohammadifard, Salehi-Abargouei and Salas-Salvadó21–Reference Jalali, Karamizadeh and Ferns24). One systematic review and meta-analysis of prospective cohort studies from Zhou et al.(Reference Zhou, Yu and He25) reported a borderline significant 33 % (95 % CI 0 %–56 %) reduction in risk of hypertension for each 1 serving of nuts per day; however, only four studies were included in the analysis, and the strength of evidence was not evaluated. Since that meta-analysis was published, several additional prospective cohort studies have been published on nut consumption and the risk of hypertension(Reference Lelong, Blacher and Baudry26–Reference Wei, Su and Wang29), with three of these reporting inverse associations(Reference Lelong, Blacher and Baudry26,Reference Jung, Woo and Shin28,Reference Wei, Su and Wang29) and one showing no clear association(Reference Mohammadifard, Haghighatdoost and Mansourian27).
We therefore conducted an updated systematic review and meta-analysis with the aim to synthesise the existing evidence from prospective cohort studies on the association between nut consumption and hypertension risk. By critically evaluating the available studies, we sought to provide a comprehensive understanding of how nuts may influence blood pressure levels and the implications for future dietary recommendations in the prevention and management of hypertension.
Methods
Literature and search strategy
We searched PubMed (https://pubmed.ncbi.nlm.nih.gov/) and Embase (https://www.embase.com/) databases from inception to 4 April 2026. The full search strategy terms are provided in the Supplement. Search terms included additional food items which were included as part of a wider project. For the purposes of this review, the current analysis focused on nuts. If more than one article was published from the same cohort, only the most recent article was used. We followed the PRISMA criteria for reporting meta-analyses(Reference Page, McKenzie and Bossuyt30).
Inclusion criteria and data extraction
Studies included in the meta-analysis were deemed eligible if they met all the following inclusion criteria: (1) evaluated the association between nut consumption and risk of hypertension, (2) study design of prospective cohort, nested case–control study within cohort study or case–cohort study that reported adjusted estimates of the relative risk (RR) (hazard ratios, risk ratios, OR and incidence rate ratios) for the association between nut intake and risk of hypertension or elevated blood pressure and (3) a population-based cohort (not a patient-based cohort focusing on specific patient groups). Retrospective case–control studies, cross-sectional studies, conference abstracts and grey literature were not included. A list of excluded studies and reasons for exclusion can be found in Supplementary Table S1. For inclusion in the linear dose–response analysis, the study also had to report a quantitative measure of nut intake as well as risk estimates for at least three categories of intake or on a continuous scale, while inclusion in the non-linear dose–response analysis required a quantitative measure of nut intake and estimates for at least three categories of intake.
The following data were extracted from each study: (1) name of the first author, (2) publication year, (3) country where the study was conducted, (4) study period, (5) number of participants and cases, (6) age of the study population at baseline, (7) sex, (8) exposure, (9) quantity of nuts consumed per category, (10) RR estimates and 95 % CI, (11) follow-up period and (12) variables adjusted for in the analyses. One reviewer (MM) extracted the relevant data, and these were checked for accuracy by a second reviewer (DA).
Assessment of study quality
Two authors (MM and IS) independently assessed the study quality of all included studies using a modified version of the Newcastle–Ottawa Scale previously described(Reference Halvorsen, Elvestad and Molin31), as adapted from the original version(Reference Wells, Shea and O’Connell32) which categorises a scoring domain into low (0–3), medium (>3–6) and high (>6–8) quality, respectively. Studies were given 1 point on each domain if the criteria were met, or otherwise 0. For comparability, 0·25 points were given for each confounder adjusted for up to a maximum of 2 points.
Assessment of strength of evidence
We used the grading criteria of the World Cancer Research Fund (WCRF) to assess the strength of the evidence(33). This grading system includes a range of aspects, including evidence from different study types, the number of studies available, heterogeneity, quality of the studies, dose–response relationship, biological plausibility and experimental evidence. The evidence, assessing likelihood of causality, is graded as follows: convincing, probable, limited-suggestive, limited-no conclusion and substantial effect on risk unlikely.
Statistical analysis
A random-effects model was used to calculate summary RRs (95 % CIs) for the highest compared with the lowest category of nuts consumed and the dose–response analysis for the association between nuts and hypertension risk as previously described by DerSimonian and Laird(Reference DerSimonian and Laird34). The average of the natural logarithm of the RRs was estimated, and the RR from each study was weighted using random-effect weights. For the dose–response analysis, the method reported by Greenland and Longnecker(Reference Greenland and Longnecker35) was used to calculate study-specific linear trends (slopes) across categories of nut consumption. This method requires that the distribution of cases and participants or person-years across categories is available; however, when it was missing, we used a previously described method to estimate the approximate distributions(Reference Aune, Greenwood and Chan36). For studies that reported on nuts consumed by ranges of intake, we estimated the midpoint for each category by calculating the average of the lower and higher cut-off points. When extreme categories were open-ended, we used the width of the adjacent interval to estimate a lower or higher cut-off point. For studies that reported intakes in servings/d, we converted the quantities to grams/d by using 28 g as a serving size (equal to approximately one handful of nuts), as previously reported in the literature and recommended by clinical guidance for a standard serving size(Reference Aune, Keum and Giovannucci37–40). For one study which did not report quantities of nut intake per quintile(Reference Weng, Steffen and Szklo41), we used information on quintiles of intakes from a second publication from the same study(Reference Haring, Selvin and Liang42). A potential curvilinear dose–response relation between nut consumption and risk of hypertension was examined by using restricted cubic splines with three knots at percentiles of distribution including 10 %, 50 % and 90 %, which were pooled using multivariable meta-analysis(Reference Orsini, Li and Wolk43).
Heterogeneity between studies was assessed with I 2-statistics(Reference Higgins and Thompson44). The I 2-statistic represents the amount of total variation that could be attributed to heterogeneity. We conducted subgroup and meta-regression analyses to investigate potential sources of heterogeneity between studies, including sex, duration of follow-up, geographical location, number of cases, dietary assessment method, study quality and adjustment for confounding factors. Sensitivity analyses were conducted to investigate the stability of the results by excluding one study at a time from the meta-analysis to test whether the results were determined by one very large or outlying study. In a sensitivity analysis, we re-calculated the OR reported in one study(Reference Mohammadifard, Haghighatdoost and Mansourian27) to RR, using the formula: RR = OR/(1 – p + (p X OR), where p is the incidence of hypertension in the reference (lowest) category. Publication bias was assessed by using Egger’s test(Reference Egger, Davey Smith and Schneider45) (P < 0·10 was considered significant) and by inspection of the funnel plots. The statistical analyses were conducted using STATA version 17.0 (StataCorp, College Station, TX, USA).
Results
Characteristics of included studies
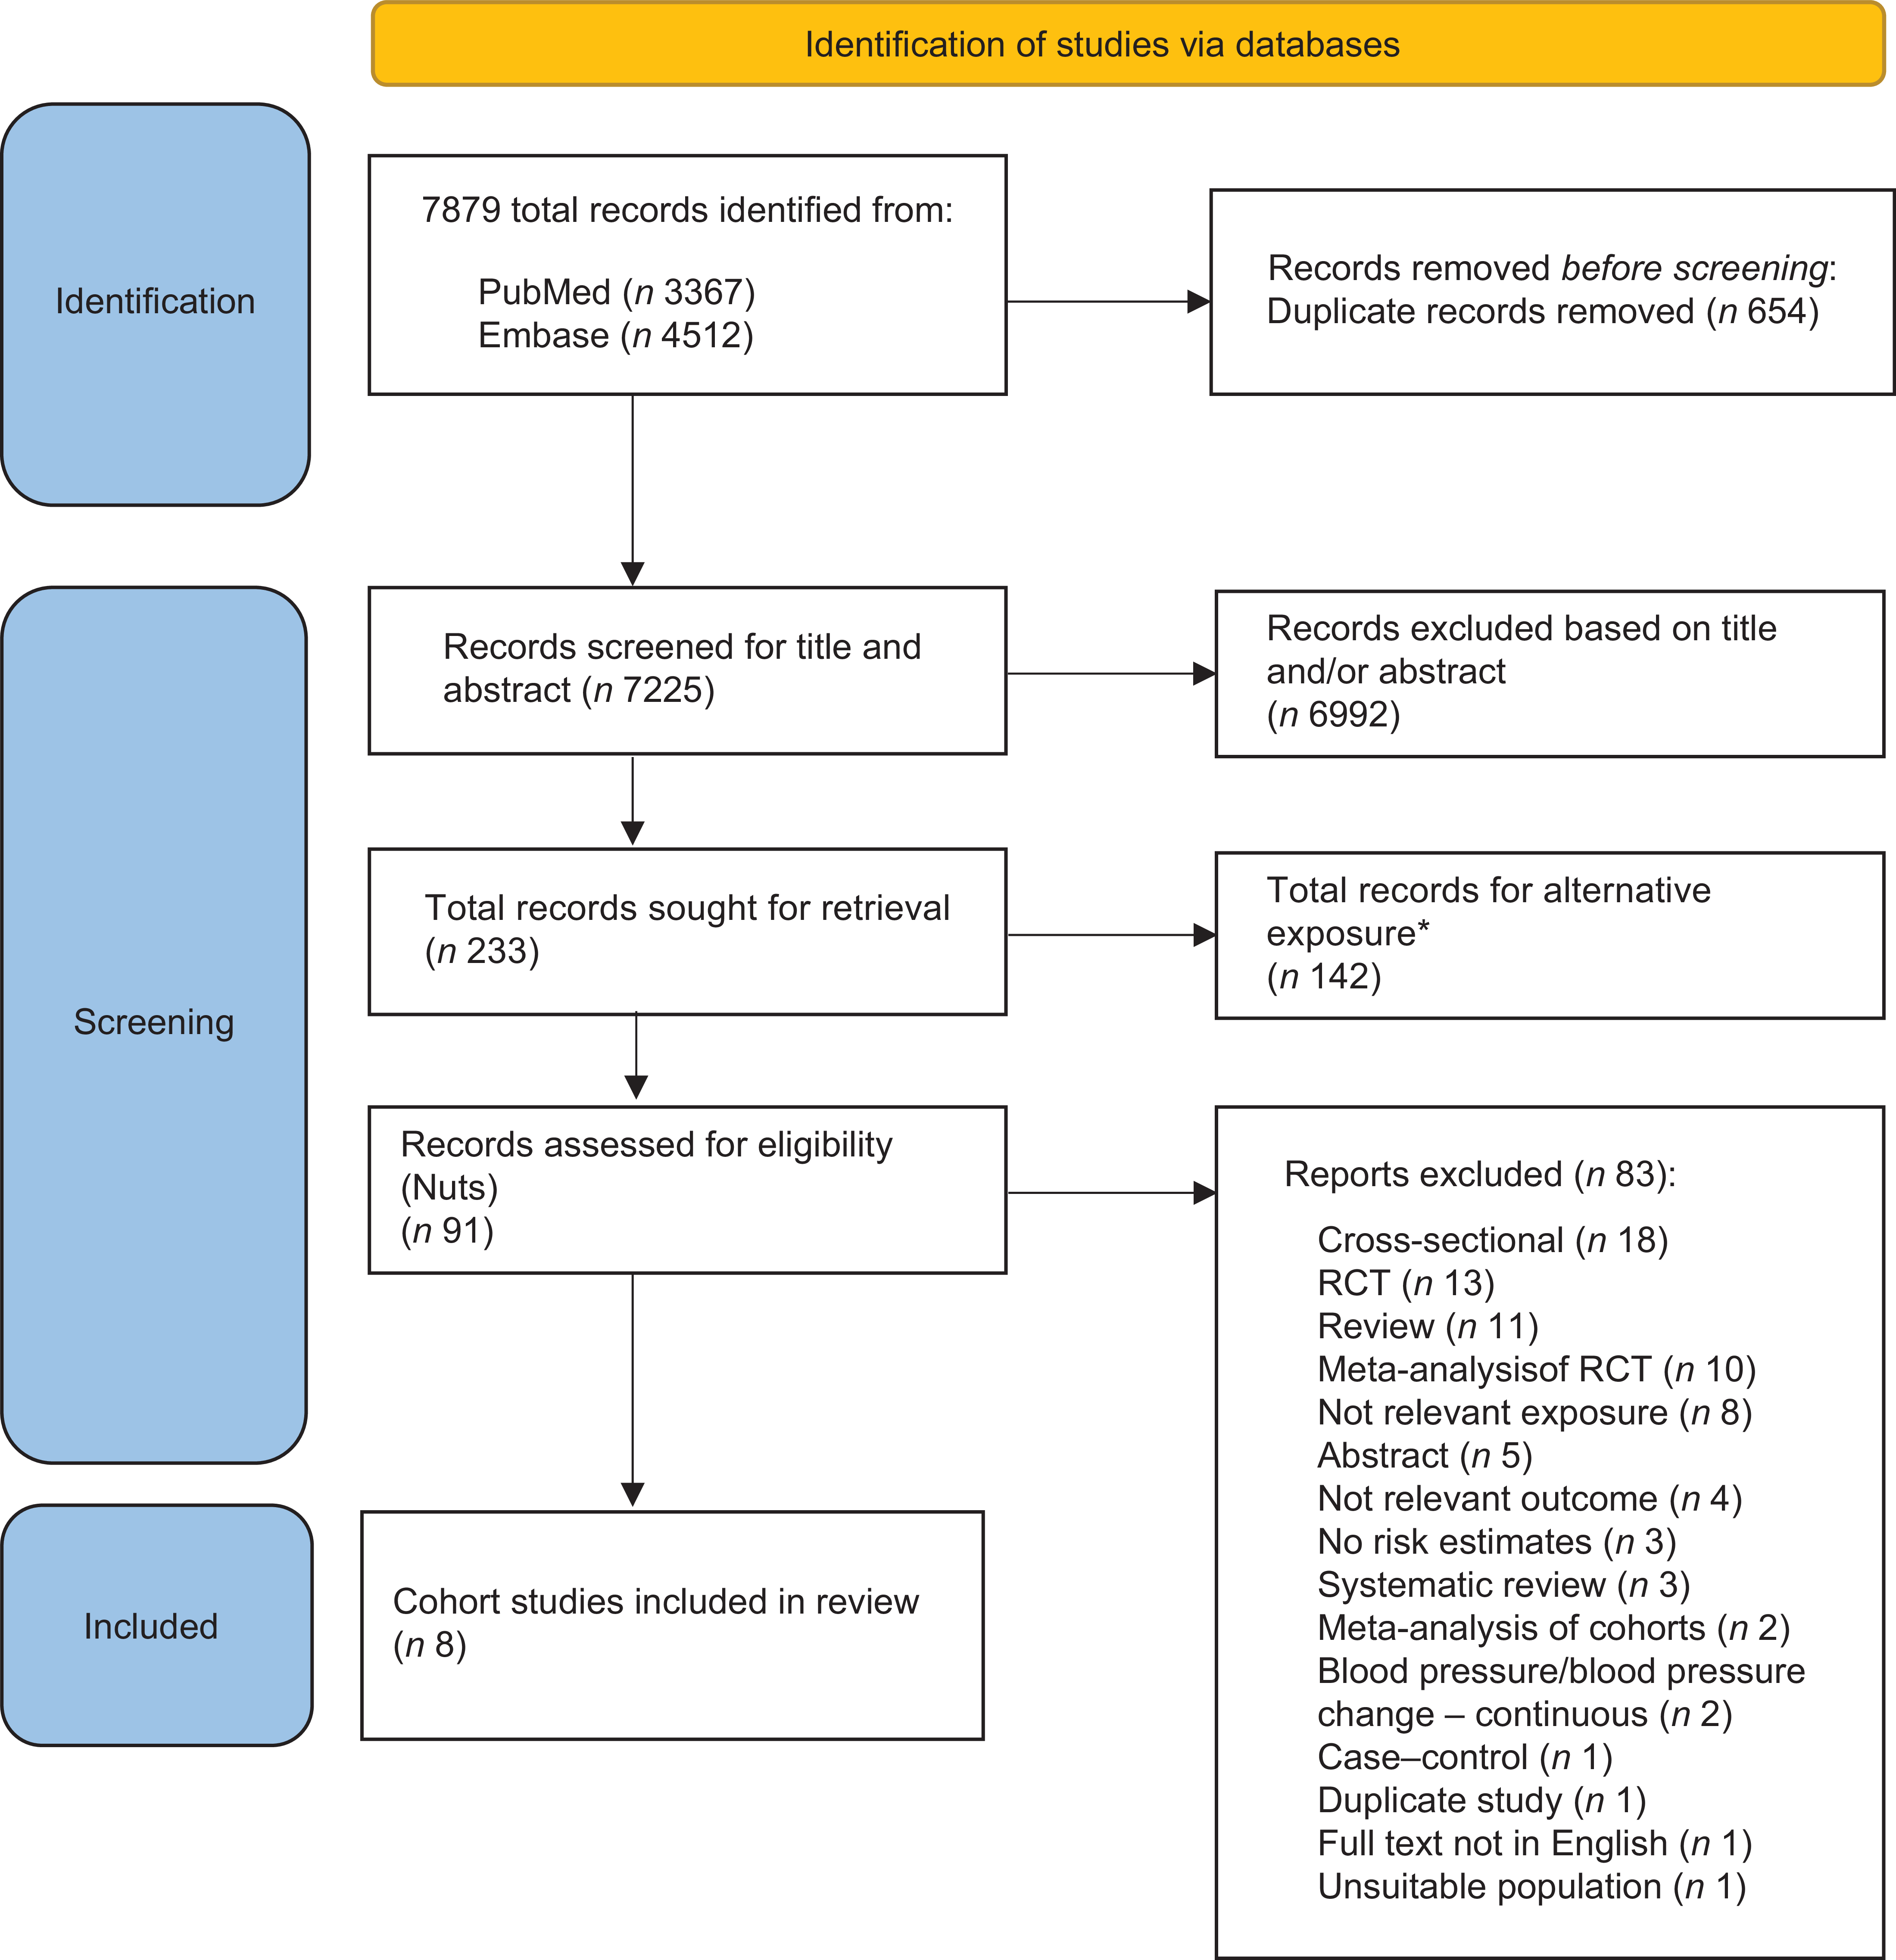
Following a comprehensive literature search and study selection, eight prospective studies(Reference Lelong, Blacher and Baudry26–Reference Wei, Su and Wang29,Reference Weng, Steffen and Szklo41,Reference Steffen, Kroenke and Yu46–Reference Martínez-Lapiscina, Pimenta and Beunza48) were included out of a previously total screened record of 7879 studies in the current systematic review and meta-analysis (Figure 1). Characteristics of the included studies are shown in Supplementary Table S2. One publication by Fernandez-Montero et al.(Reference Fernández-Montero, Bes-Rastrollo and Beunza49) was excluded because it overlapped with another publication by Martínez-Lapiscina et al.(Reference Martínez-Lapiscina, Pimenta and Beunza48) from the same study (the SUN cohort study). Three studies were from the USA, two were from Europe (Spain and France) and three were from Asia (South Korea, China and Iran). Six studies included both men and women, and two studies included only men. The age range of the participants across the studies that was reported was 18–87·1 years. The mean (median) study quality across all studies was 6·8 (7·0) out of 8, with six studies having a high study quality score and two studies having a medium-quality score (Supplementary Table S3).
Flow chart. *A comprehensive search strategy was conducted incorporating additional exposure parameters which was used for the purposes of conducting additional systematic review and meta-analyses. RCT, randomised controlled trials.

Association between nut consumption and risk of hypertension
Highest compared with lowest intakes
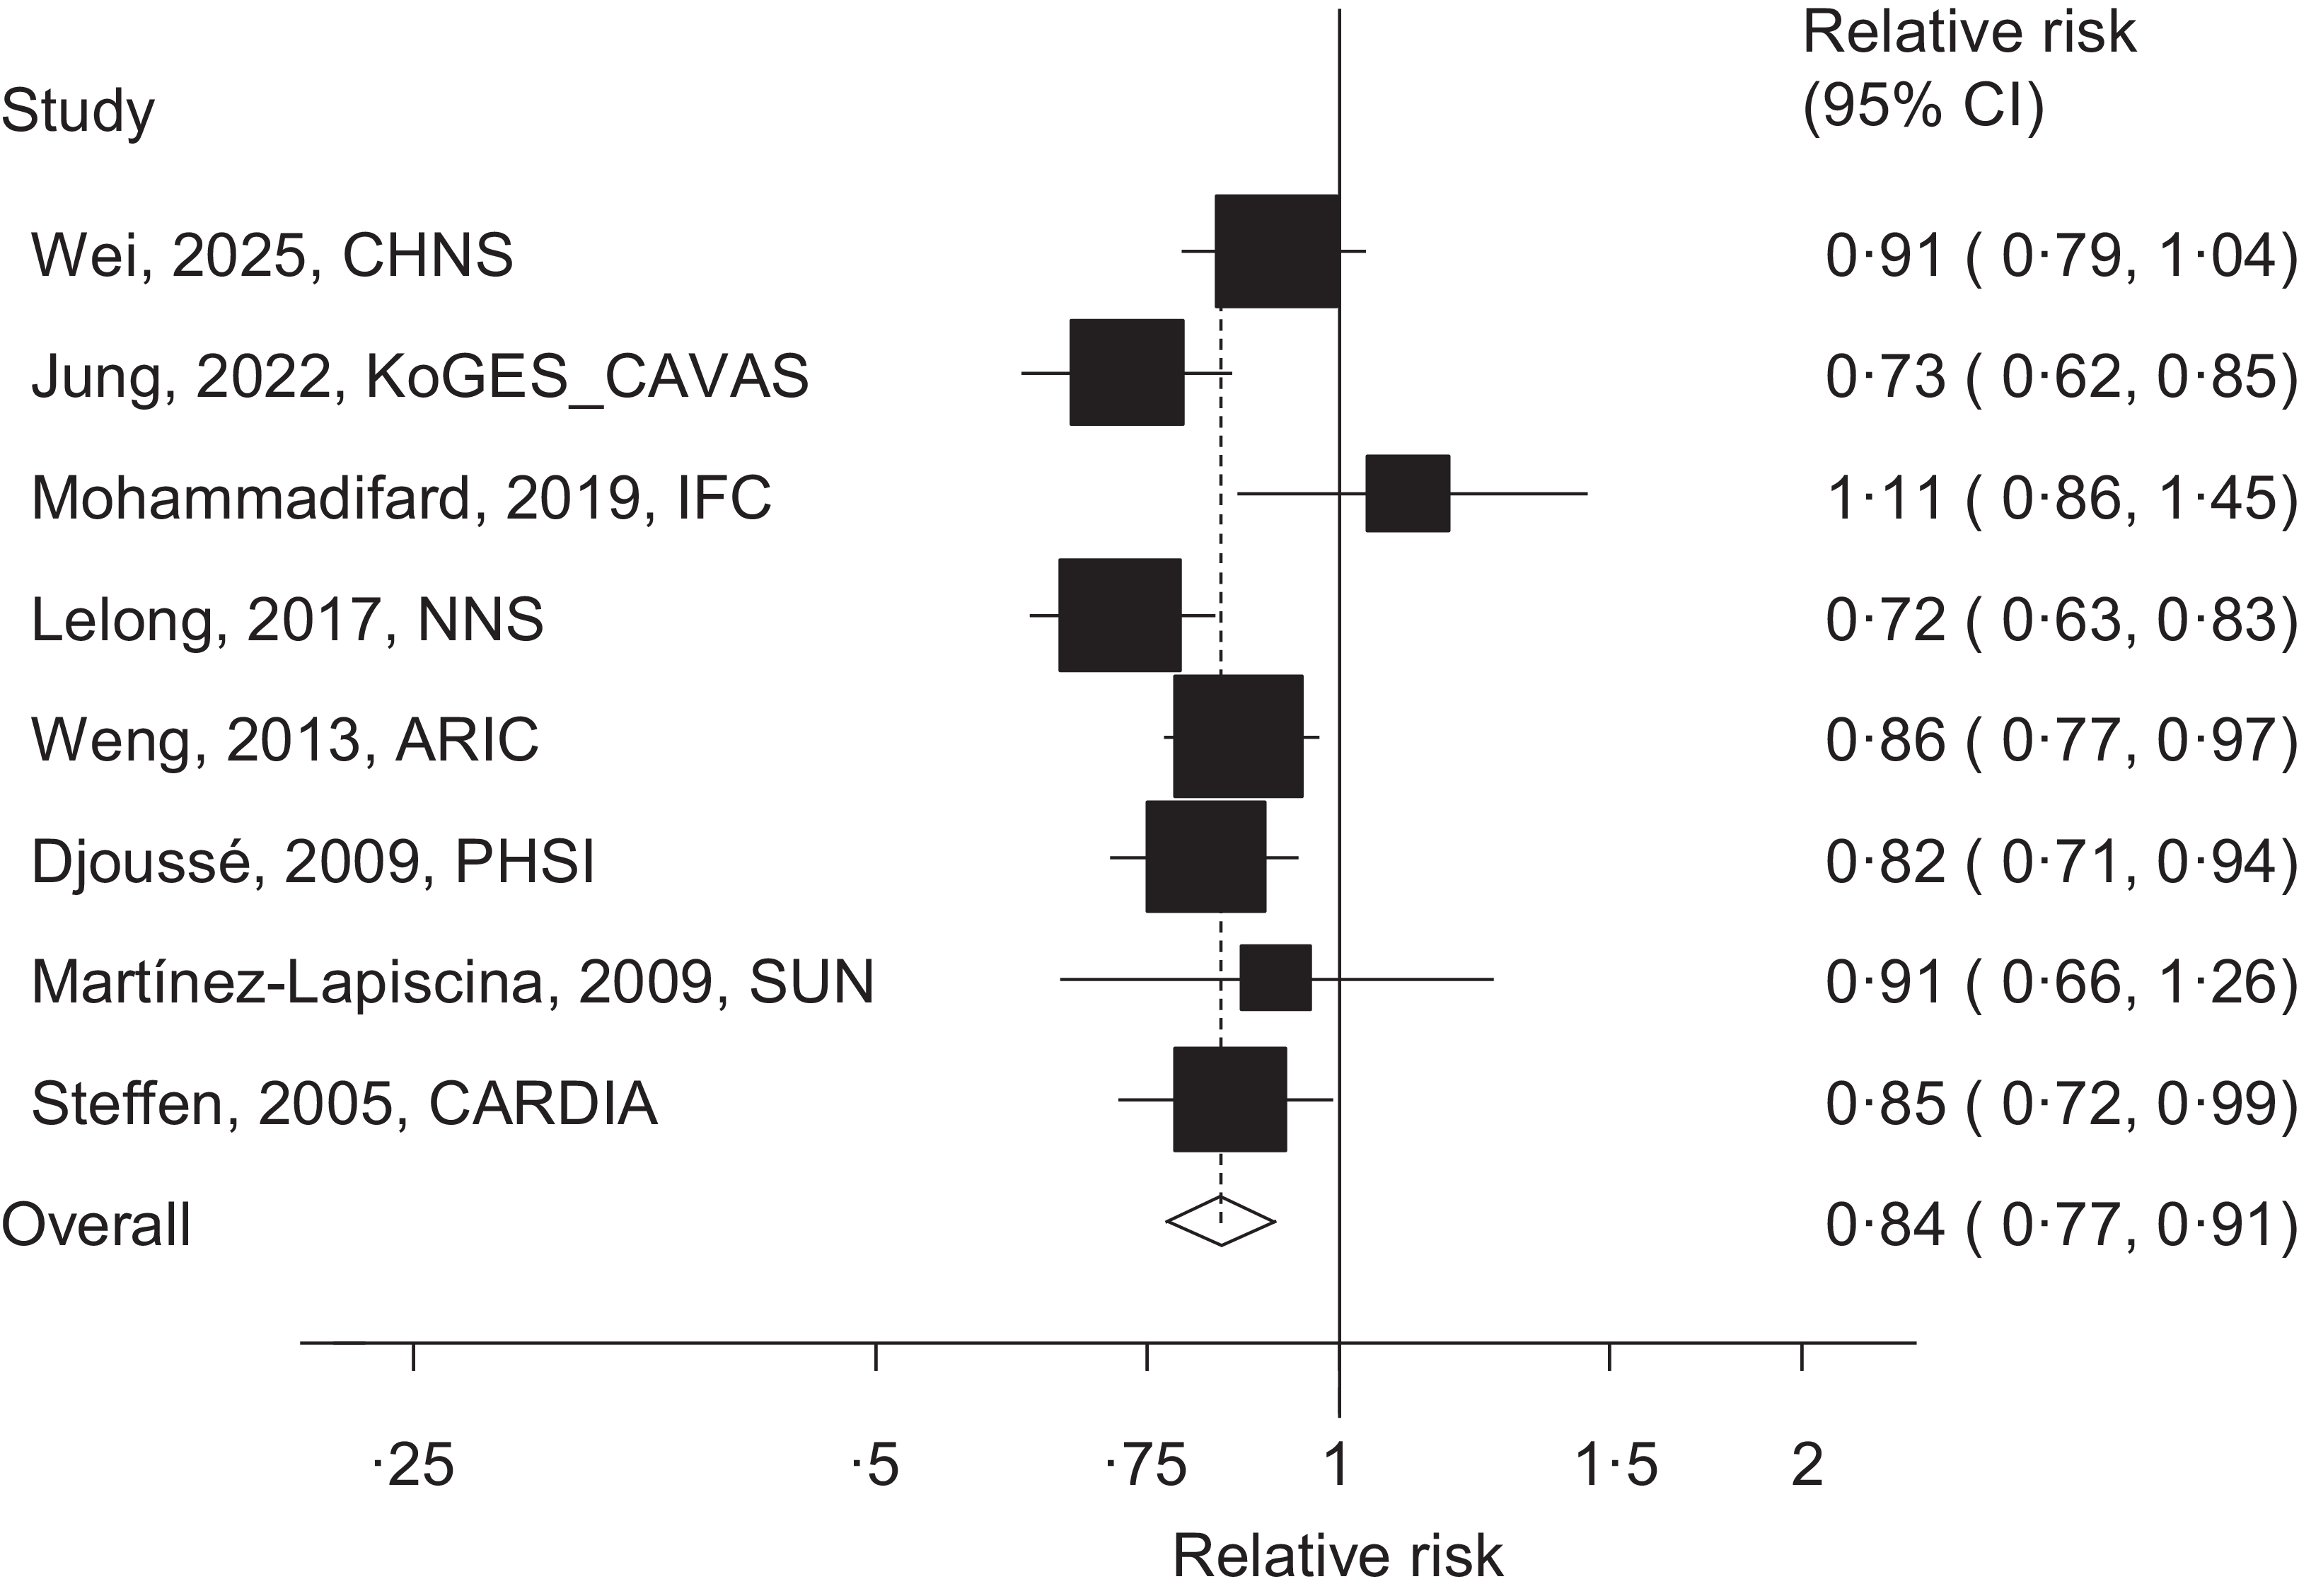
Eight cohort studies (eight publications)(Reference Lelong, Blacher and Baudry26–Reference Wei, Su and Wang29,Reference Weng, Steffen and Szklo41,Reference Steffen, Kroenke and Yu46–Reference Martínez-Lapiscina, Pimenta and Beunza48) , including 20 665 hypertension cases and 143 380 participants, were included. The highest intake of nuts was inversely associated with the risk of hypertension (summary RR: 0·84; 95 % CI 0·77–0·91, I 2 = 50·2 %, p heterogeneity = 0·05, n 8) compared with the lowest intake (Figure 2).
Nut consumption and hypertension, high v. low analysis.

Dose–response analysis
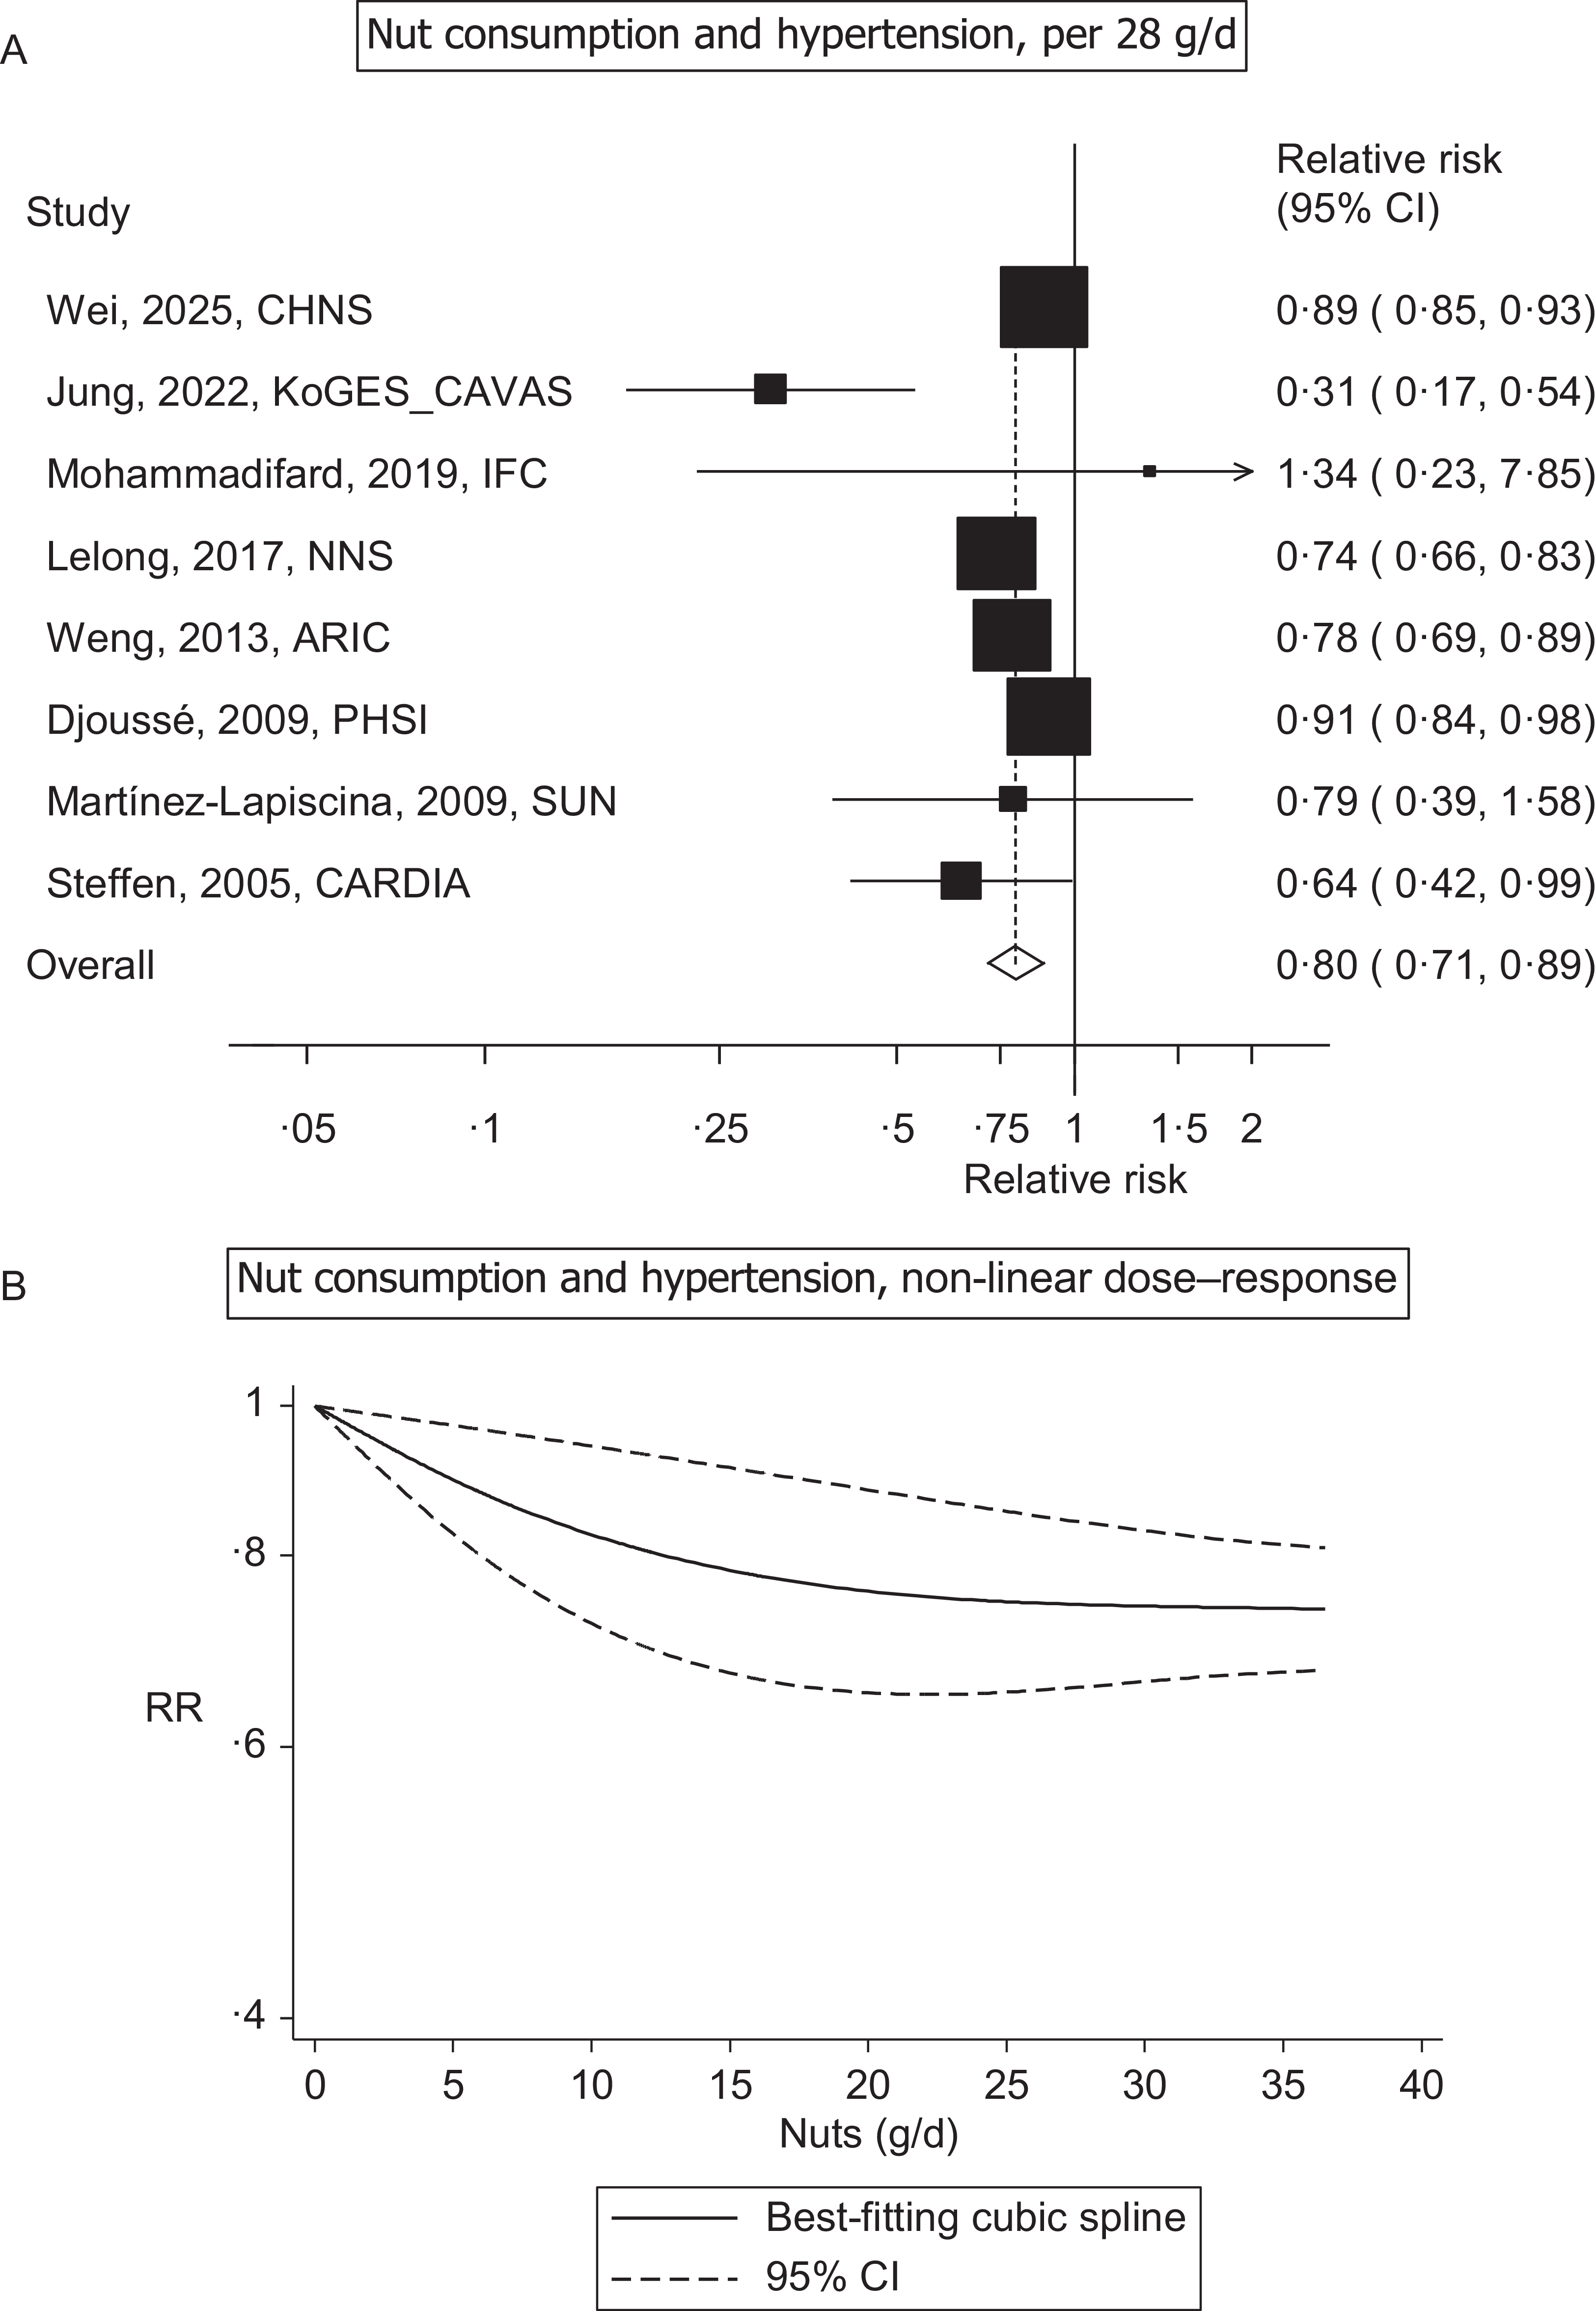
Eight studies were included in the dose–response analysis(Reference Lelong, Blacher and Baudry26–Reference Wei, Su and Wang29,Reference Weng, Steffen and Szklo41,Reference Steffen, Kroenke and Yu46–Reference Martínez-Lapiscina, Pimenta and Beunza48) . The summary RR for each 1-serving/d (28 g) intake was 0·80 (0·71–0·89, I 2 = 74·8 %, pheterogeneity < 0·0001, n 8); Figure 3A). The summary RR (95 % CI) ranged from 0·75 (0·63–0·88) when the study by Wei et al.(Reference Wei, Su and Wang29) was excluded from the analysis to 0·83 (0·77–0·90) when the study by Jung et al.(Reference Jung, Woo and Shin28) was excluded (Supplementary Fig. S1). The heterogeneity was reduced when the latter study was excluded (I2 = 58·4 %). There was no evidence of publication bias based on using Egger’s test (p = 0·10) or from visual inspection of the funnel plot (Supplement Fig. S2). We found some indication of a potential non-linear association between nut consumption and risk of hypertension (p non-linearity = 0·07) with the non-linear curve flattening at approximately 25–30 g/d (Figure 3B, Supplementary Table S4).
Nut consumption and hypertension, linear (A) and non-linear (B) dose–response analysis.

Figure 3. Long description
The image contains two panels, A and B, each depicting different types of graphs related to nut consumption and hypertension. Panel A shows a forest plot illustrating the relative risk of hypertension per 28 grams per day of nut consumption across various studies. The x-axis represents the relative risk, ranging from 0.05 to 2, while the y-axis lists the studies. Each study is represented by a square, with horizontal lines indicating the 95 percent confidence intervals. The overall relative risk is marked by a diamond shape. Panel B presents a line graph showing the non-linear dose-response relationship between nut consumption and hypertension. The x-axis represents the amount of nuts consumed in grams per day, ranging from 0 to 40, while the y-axis represents the relative risk, ranging from 0.4 to 1. The graph includes a solid line for the best-fitting cubic spline and dashed lines for the 95 percent confidence intervals. The trends indicate a general decrease in relative risk with increasing nut consumption up to a certain point, after which the risk stabilizes.
Sensitivity analysis, subgroup analyses and strength of evidence assessment
In a sensitivity analysis converting the OR reported in one study(Reference Mohammadifard, Haghighatdoost and Mansourian27) to RR, the summary RR for the highest v. lowest category of nut intake was similar (summary RR = 0·85, 0·77–0·93) to the main analysis (0·84, 0·77–0·91). We found inverse associations between nut consumption and hypertension in most subgroup analyses, and there was no evidence of between-subgroup heterogeneity (Supplementary Table S5). Using WCRF criteria (Supplementary Table S6) to judge the evidence, we considered the likelihood of causality probable (Supplementary Table S7).
Discussion
This comprehensive systematic review and meta-analysis of eight prospective cohort studies found an overall significant reduction in the risk of hypertension (16 %) by comparing the highest v. lowest intake of nut consumption and a 20 % reduction in risk per 28 g/d in the linear dose–response analysis. There was some indication of non-linearity, and there was a 26 % reduction in risk up to an intake of 30–35 g/d, equivalent to a handful of nuts. This quantity is similar to the current average daily recommendations of 28 g across several European and North American dietary guidelines(Reference Brown, Gray and Chua39,50) . We graded the likelihood of causality as probable using WCRF criteria.
These results are in line with a previous meta-analysis from Zhou et al.(Reference Zhou, Yu and He25) of four cohort studies, which found a reduced risk of hypertension with higher nut intake. However, our current meta-analysis included nearly twice as many studies as the previous meta-analysis, providing further confirmation that nut consumption may have a beneficial impact on hypertension risk. Our findings are partly consistent with meta-analyses of randomised controlled trials showing benefits of overall nut consumption(Reference Mohammadifard, Salehi-Abargouei and Salas-Salvadó21), particularly almonds(Reference Eslampour, Asbaghi and Hadi22), pistachios(Reference Asbaghi, Hadi and Campbell23) and cashews(Reference Jalali, Karamizadeh and Ferns24), on blood pressure, although not all have been consistent in showing a reduction in blood pressure(Reference Del Gobbo, Falk and Feldman51,Reference Lee-Bravatti, Wang and Avendano52) . Our results are also consistent with previous meta-analyses of prospective cohort studies that have shown a reduced risk of CVD with higher nut consumption(Reference Aune, Keum and Giovannucci37,Reference Becerra-Tomás, Paz-Graniel and Kendall38,Reference Lee-Bravatti, Wang and Avendano52) , and it is possible that a reduced risk of hypertension may contribute to the reduction in CVD(Reference Gibbs, Gaskin and Ji54).
Our results align with studies on dietary patterns and indices that are high in nuts which have shown reduced hypertension risk, including predominantly plant-based diets(Reference Tomé-Carneiro and Visioli55), such as vegetarian(Reference Yokoyama, Nishimura and Barnard56), vegan(Reference Lopez, Cativo and Atlas57), DASH(Reference Filippou, Tsioufis and Thomopoulos58) and Mediterranean(Reference Godos, Zappalà and Bernardini59) diets. Their respective indices, which score dietary quality, have all shown favourable outcomes on lowering blood pressure, such as the healthy plant-based diet index (hPDI)(Reference Kim, Rebholz and Garcia-Larsen60) and the Mediterranean dietary quality index (Med-DQI)(Reference Payandeh, Shahinfar and Jafari61). Studies have also shown benefits for adherence to the EAT-Lancet Planetary Health diet in reducing hypertension risk, which also includes nuts as an important dietary component(Reference Sawicki, Ramesh and Bui62,Reference Liu, Shen and Wang63) . These results are of particular importance given the global shift towards more sustainable plant-based dietary patterns for future food security and planetary health(Reference Aleksandrowicz, Green and Joy64–Reference Bunge, Mazac and Clark66). Nuts may contribute to the reduced risk of hypertension and CVD observed among persons following such dietary patterns, although other beneficial dietary factors such as fruits, vegetables, whole grains and legumes also contribute to these benefits(Reference Bunge, Mazac and Clark66–Reference Aune, Keum and Giovannucci68).
The plausibility of nuts, however, in directly reducing blood pressure may be based on several physiological mechanisms. Nuts may lower blood pressure through enhancing endothelial function(Reference Xiao, Huang and Peng16). Nuts contain significant proportions of l-arginine, a key component of nitric oxide, which acts as a potent vasodilator and regulator of blood pressure and was shown to reduce hypertension in a recent meta-analysis of randomised clinical trials(Reference Shiraseb, Asbaghi and Bagheri70). Nuts also contain considerable portions of dietary fibre, known to indirectly reduce blood pressure(Reference Tejani, Dhillon and Damarlapally71,Reference Reynolds, Akerman and Kumar72) . The fermentation of dietary fibre by the gut microbiota results in the production of SCFA, such as propionate and butyrate, which have been linked to blood pressure reduction(Reference Yang, Chen and Gao73,Reference Verhaar, Collard and Prodan74) . Nuts are high in anti-inflammatory and antioxidative compounds such as phenolic acid and tannins which have shown benefits in reducing markers of inflammation and oxidative stress(Reference Rajaram, Damasceno and Braga17), and both appear to correlate with hypertension and overall CVD risk(Reference Jin, Huang and Hong75,Reference Song, Yang and Cheng76) . Lastly, nuts have been associated with reduced weight and risk of obesity(Reference Mozaffarian, Hao and Rimm77,Reference Nishi, Viguiliouk and Blanco Mejia78) , and excess weight is a major risk factor for hypertension(Reference Jayedi, Rashidy-Pour and Khorshidi79).
Strengths and limitations
The main strength of this updated meta-analysis includes the detailed search strategy and analyses, improved statistical power, the use of linear and non-linear dose–response analyses to explore the strength and shape of the dose–response relationships and the inclusion of high-quality prospective cohort studies. The majority of the studies had long-term follow-up, large sample sizes, with adjustments for multiple important confounding factors, thereby minimising the possibility for confounding of the observed associations.
It is important to note certain limitations with our study that need to be considered. Although there was some indication of heterogeneity between studies, particularly in the dose–response analysis, this was to some extent driven by one study, and when excluded heterogeneity was reduced without substantially affecting the overall association. Most importantly, the majority of the studies were directionally consistent. We cannot fully exclude the possibility that residual confounding may be present; however, the majority of studies adjusted for a wide range of important confounders, thus reducing the potential for confounding. The associations also persisted in subgroup analyses stratified by adjustment for a number of confounding factors, and there was no evidence of statistical heterogeneity between subgroups. Publication bias can affect meta-analyses of published literature. Although we found no indication of publication bias in our analysis, we had a limited number of studies included, and many large cohorts have not yet published on this association; thus, further large-scale cohorts are needed. Measurement errors in the dietary assessment of nut intake could have affected the results, but none of the available studies corrected for measurement errors. Most studies also had a single dietary assessment at baseline and were not able to take into account potential changes in intake during follow-up; however, this would most likely have attenuated the observed associations. There were also differences in the methods for dietary assessment across the included studies which may have contributed to the observed heterogeneity; however, there was no indication of between-subgroup heterogeneity by whether studies used FFQ or 24-h recalls to assess diet. We were unable to evaluate the association between specific types of nuts and hypertension risk as none of the studies had reported on specific nut types. None of the studies to date reported on whether the nuts were salted or not, and this could be a limitation given the well-established role of salt in increasing blood pressure. However, most likely a sizeable proportion of nuts consumed in free-living populations are salted and could attenuate the benefits of nuts requiring further studies to clarify this question. Further limitations include the lack of studies from the Indian subcontinent and Africa, and thus these results may not be applicable to all ethnicities, warranting additional studies in more ethnically diverse cohorts. However, the observed associations were directionally consistent across the three geographic regions (Europe, America and Asia), and there was no heterogeneity in the results between these regions.
Future directions and recommendations
These findings have important public health implications, as over 1·4 billion people worldwide have hypertension(1), and because of the importance of hypertension in causing a wide range of circulatory diseases(Reference Lewington, Clarke and Qizilbash80). The current findings are consistent with previous evidence for an association between nut intake and reduced risk of CVD and premature mortality(Reference Aune, Keum and Giovannucci37) and suggest increasing nut consumption may also reduce the risk of hypertension. Any further large-scale cohort studies could clarify associations with higher intakes of nuts, different types of nuts and whether they are salted or not on hypertension risk. Future research should also prioritise investigating specific nut metabolites (e.g. l-arginine) to elucidate biological pathways underlying the observed associations.
Conclusion
In summary, our meta-analysis provides further evidence that higher nut consumption is associated with a reduced risk of hypertension. We observed a 26 % reduction in risk at an intake of 30–35 g per d of nuts. Although further large-scale cohorts would be desirable, these findings provide further support for dietary recommendations to increase the consumption of nuts.
Supplementary material
To view supplementary material for this article, please visit https://doi.org/10.1017/S0007114526108137
Data availability statement
All data analysed in this study were extracted from previously published studies. The extracted data supporting the findings of this study are available from the supplementary material and the corresponding author upon reasonable request.
Acknowledgements
The authors would like to thank Professor Lyn Steffen for providing additional information from the ARIC study.
Author contributions
Michael Metoudi: Data curation-Supporting, Writing – original draft-Equal, Writing – review and editing-Equal; Isabelle Sadler: Methodology-Supporting, Validation-Equal, Writing – review and editing-Equal; Shireen Kassam: Funding acquisition-Lead, Writing – review and editing-Equal; Dagfinn Aune: Conceptualisation-Lead, Data curation-Lead, Formal analysis-Lead, Methodology-Equal, Validation-Equal, Writing – review and editing-Supporting.
Financial support
MM, IS – Plant-Based Health Professionals UK, SK, DA – none.
Competing interests
DA declares no conflict of interest regarding the manuscript. MM and IS are both members of Plant-Based Health Professionals UK, and SK is the director of Plant-Based Health Professionals UK. The funder, Plant-Based Health Professionals UK, had no role in the design, data collection, analysis and interpretation of this study despite author affiliations with Plant-Based Health Professionals UK. SK was consulted to review the final manuscript and was not involved in the design, data collection, analysis and interpretation of the study results.


 Open access

