Introduction
A higher ranking is a topic of great concern on most if not all university campuses (Barron, Reference Barron2017; Bougnol and Dulá Reference Bougnol and Dulá2015; Collins and Park Reference Collins and Park2016; Stolz et al. Reference Stolz, Hendel and Horn2010). Hotly debated is the relationship that exists between university reputation and creativity (Casper Reference Casper2018; Krücken et al. Reference Krücken, Engwall and De Corte2018; Ohly Reference Ohly2018; Scott Reference Scott2018) and innovative character (Groof Reference Groof2018) of the scholarship that comes from the faculty. This is a complex relationship that impacts not only research and rankings but also the humanities, identity and economics (D’haen, Reference D’haen2018). Yet, every university administration, it seems, is actively seeking to ‘grow’, to increase its many numbers that are proxies for size and greater diversity.
In this review we investigate the presumed relationship between size and ranking. Conversely, the argument for more inclusiveness and diversity is not the issue here because that is clear: creativity comes from individuals of all kinds (Leahey Reference Leahey2018; Ohly Reference Ohly2018; Winiwarter Reference Winiwarter2018), not from marching columns (Bejan Reference Bejan2020). Feyerabend (Reference Feyerabend1978) saw the source of ideas in the individual’s freedom and attitude to pursue the ‘anything goes’. About creativity, Kármán and Edson (Reference Kármán and Edson1967) wrote that ‘the finest creative thought comes not of organized teams but out of the quiet of one’s own world.’ Individuality drives collective behaviour (Jolles et al. Reference Jolles, Booger, Sridhar, Couzin and Manica2017), while in scientific research large teams ‘develop’ what was known, while individuals ‘disrupt’ the established knowledge (Wu et al. Reference Wu, Wang and Evans2017).
The current study addresses the goal of higher rankings on physics grounds. If the goal is worthwhile, then perhaps the argument can be strengthened – if it is not, then perhaps it can be replaced with something better. In either case, it pays to know the physics before engaging in the policy debates that dominate academia today.
The basis for questioning is the newly emerging physics of social organization, which is represented by a growing number of physics advances. The physics literature on social organization is broad, with published advances on previously ‘intangible’ phenomena such as crowd dynamics (Lorenzini and Biserni Reference Lorenzini and Biserni2011; Miguel Reference Miguel2011; Moussaïd et al. Reference Moussaïd, Helbing and Theraulaz2011; Pauls Reference Pauls1984), economics (Chen Reference Chen2011; Saslow Reference Saslow1999; Smerlak Reference Smerlak2016; Temple Reference Temple2014; Weisbuch Reference Weisbuch2013; Weisbuch and Battiston Reference Weisbuch and Battiston2007), the evolution of the city (Fruin Reference Fruin1971; Li and Chow Reference Li and Chow2000; Lui et al. Reference Lui, Kong, Lorente, Bejan and Chow2012; Thompson and Marchant Reference Thompson and Marchant1995), hierarchy (Bejan Reference Bejan2020; Bejan and Errera Reference Bejan and Errera2017) and cultural change (Bachta et al. Reference Bachta, Dhombres and Kremer-Marietti2008; Horowitz et al. Reference Horowitz, Parrondo and Sagawa2015; Kalason Reference Kalason2007a, Reference Kalason2007b).
Physics
There is a common belief that the publication of new university rankings every year is ‘news’. This belief is good for the publishing business. It is also an opportunity for university administrators to engage in ‘designing’ the faculty – its social composition and size – in order to game the rankings published by an increasing number of businesses, magazines and universities.
The fact is that, even after the wave of e-learning, universities are not changing (Isaac Reference Isaac2017) and their rankings are not changing either. For example, in the US the top 10 or top 20 universities are always the top 10 or top 20. Climbing or falling by one or two spots means nothing in the river-like hierarchy of human flow that every single university represents on the world map.
First, some physics: one university is both source and sink for its own physical movement (life) on the globe. It is a source of new movers who carry ideas and knowledge, and new professors for the universities of the whole globe. Most of the movers are students. One university is also an attractor of students from all over the world, it spreads ideas, removes obstacles that impede movement, and generates new movement.
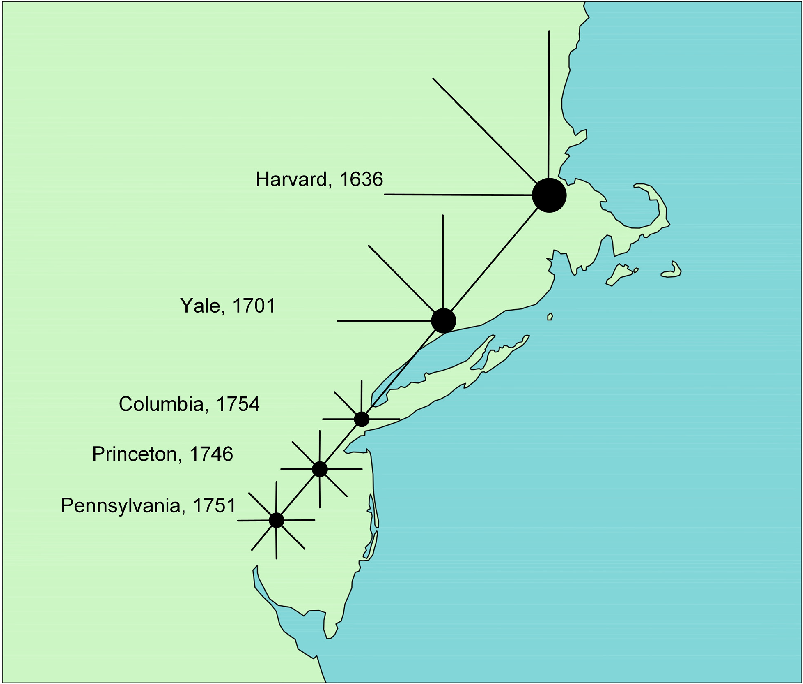
Figure 1 represents education (knowledge) as a human flow system that spreads on the map. It spreads in space and in time. What spreads are the individuals empowered by the newly acquired knowledge. They possess the new, the added ‘know how’, and, as a consequence, they have more power and move more easily, farther, faster, more safely and with greater staying power on the world map. They entrain people as they move. They generate, facilitate and enhance movement. The physical movement of the knowledgeable is why the seemingly intangible ‘knowledge’ keeps on spreading (Bejan and Lorente Reference Bejan and Lorente2012).
The birth and spreading of the university flow system in the American colonies.

The history of the beginnings of university education illustrates the phenomenon of the spreading of ideas. Figure 1 shows how the spreading started in the American colonies. From each of the early universities, the university idea spread locally, in all directions, like the seeds of the fruit falling from a tree. The seeds that fell from Harvard were carried and planted ‘far’ in those times, and they became Yale half a century later. The fruit tree of Harvard was joined by the fruit tree of Yale. After another half century, the seeds from both trees gave life to an orchard, Princeton, Pennsylvania, Columbia, Delaware (not shown), and many more of that era. From Harvard to Pennsylvania, the university system spread as a straight arrow.
In physical systems, the flow architectures that connect large areas to discrete points are destined not to change because of the physics of flow configuration and evolution (design change) on a finite area. Over time, flow structures evolve to provide greater access between territory and source or sink, and through this evolutionary design the flow architecture becomes dendritic, hierarchical, with few large channels flowing together with many small, in harmony. The embryo of this flow architecture is evident in Figure 1. The straight line continues to grow, as the trunk of the tree, and the first branches develop into the few big branches of the continental university flow system that emerges. Every university, even the smallest, is ‘global’ as soon as it sends a professor to the other side of the world, and as soon as it attracts students from distant lands.
Every university is a flow architecture configured like the crowd that flows from the entire city to one temporary point of attraction – stadium, theatre, train station. The territory (the city) is composed of many points of attraction, each with its own time-trigger of flow evolution. The territory is full of movement because it is a superposition of all the area-point (and point-area) river basins of people that flow on it, one basin for each point of attraction.
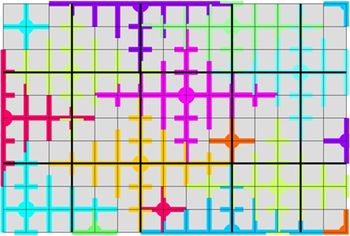
To accommodate all these river basins of people with one infrastructure (streets, public squares, buildings, sewage), the city emerges as an infrastructure with hierarchy, with few large avenues and many small streets (Bejan Reference Bejan2020). As illustrated in Figure 2, this infrastructure is a combination of tree and grid, a tree with branches and loops that serves all the possible tree-like crowds that flow and keep the city alive.
The movement on the landscape appears complicated because it leaves marks (paths) that crisscross and form grids. This is particularly evident in the evolving designs of urban traffic. Less evident is the actual flow of people and goods on the area. Every single flow is tree-shaped, from the area to the point of interest, or from another point to the same area. This flow is visible during the pouring of batter on a hot waffle iron. The city grid is the solid (but not permanent) infrastructure that accommodates all the possible and superimposed tree-shaped flows. The superposition of large tree branches forms the grid of avenues and highways. The superposition of the tree canopies forms the grid of streets, alleys, lawns and house floors. The few large and many small of urban design has its origin in the natural design of all the tree shaped flows on the landscape (to view this figure in colour please see the online version of this journal).

The hierarchy of the infrastructure is an enlarged and more muscular version of the hierarchy of channels of the oldest river basin of people that once lived in the area. The largest public square and the main roads of today are where the first points of attraction (market, castle, courthouse) and first streets were located. In the multitude of flows that cover the city, the oldest flows dug the first channels, and today those channels are the first and the most used, the biggest and the best-known. They are in place, and they grow in place, deeper and wider. The present-day crowds that inhabit the central and oldest quarter are the most important and best-known. These crowds would emerge as ‘highly ranked’ if somebody ranked all the crowds that move in the urban area, as shown in Figure 2.
The world of university life and business is no different than the city evolution phenomenon. The oldest universities created the first channels of knowledge transmission, which generated the tradition of ideas and idea-missionaries who spread and created secondary and tertiary channels of their own (Figure 1). The whole globe has access to university education, and the access is made easier for everyone by the hierarchy of university infrastructure that is in place now. The hierarchy does not change: it morphs in place to flow better, more easily and farther, just like the channels in the Amazon basin and the streets in an old European city.
Methods
Today, the university system is a global flow system. The individual names listed in university rankings are the names of the river basins of people and ideas that flow from one point to the whole globe, the flow of students and professors and publications, which, superimposed, constitute the globe of university education. The same names identify the channels of the global infrastructure for university life, which is here to stay. This is why university rankings are unchanging.
To suggest that one can ‘sculpt’ one university to change its world ranking is the same as claiming that one person can build a branch of the Mississippi to carry a larger flow than the lower Mississippi near New Orleans. That will not happen. It is true that one can block a tiny rivulet somewhere upstream, and one can build an artificial canal somewhere else, also upstream. These human acts are the river equivalent of gaming the university rankings system, and it has an effect only among the low-ranked, in the long tail of the rankings, in the peloton where every rank is in fact the same low rank.
The global university flow architecture would go unnoticed had it not been for the names of the ideas and their creators, who flow through its channels, enlarge the channels as they move through them, and signal to the whole world that all channels (universities) are not the same. They are not equally good and famous. Indeed, news, ideas and knowledge spread if they are valuable, and their spread is faster, farther, more efficient and longer-lasting when they flow first through a large channel. The known ideas and the names of their authors, cumulatively, account for the fame of that channel.
Quality
There are many features that contribute to the rank of a university. Size is one feature, which is addressed in the next section. It is certain that the fame of a university has a lot to do with the quality of the published ideas that originate from it. One measure of fame is the number of citations received by the published ideas. The large channel is so because it generates a larger stream of useful ideas and idea-people, and correspondingly a larger stream of students and idea seekers who are attracted to it. This is why the magazine rankings of universities are similar to the rankings of universities according to their numbers of highly cited authors.
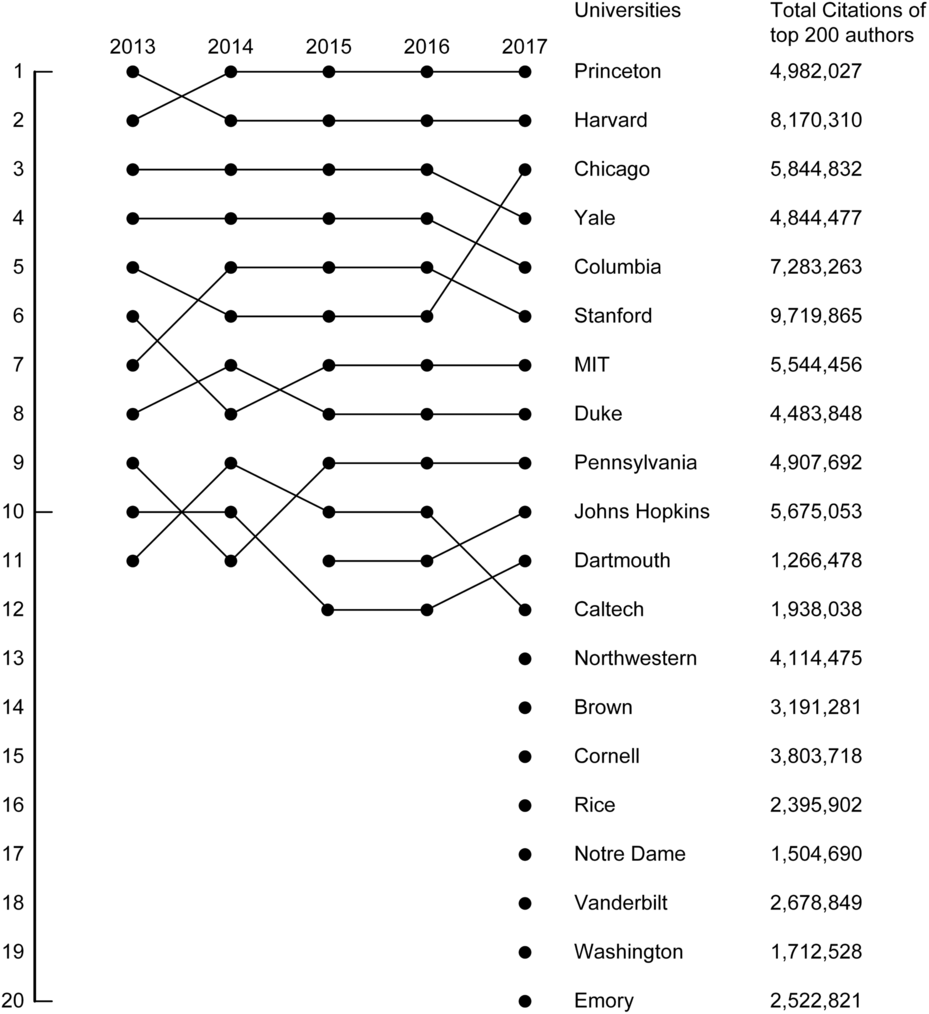
This physics description of the hierarchy of flow channels (universities) is confirmed by the US data collected over the past five years and plotted in Figure 3. The ranked universities are from the US News & World Report (The Best Colleges in America 2018). The figure shows that rankings do not change in a significant way, although they give the impression (and the hope) that they may indeed change.
The unchanging rankings of top US universities, and their relationship to the numbers of citations of the research articles that emanate from each university.

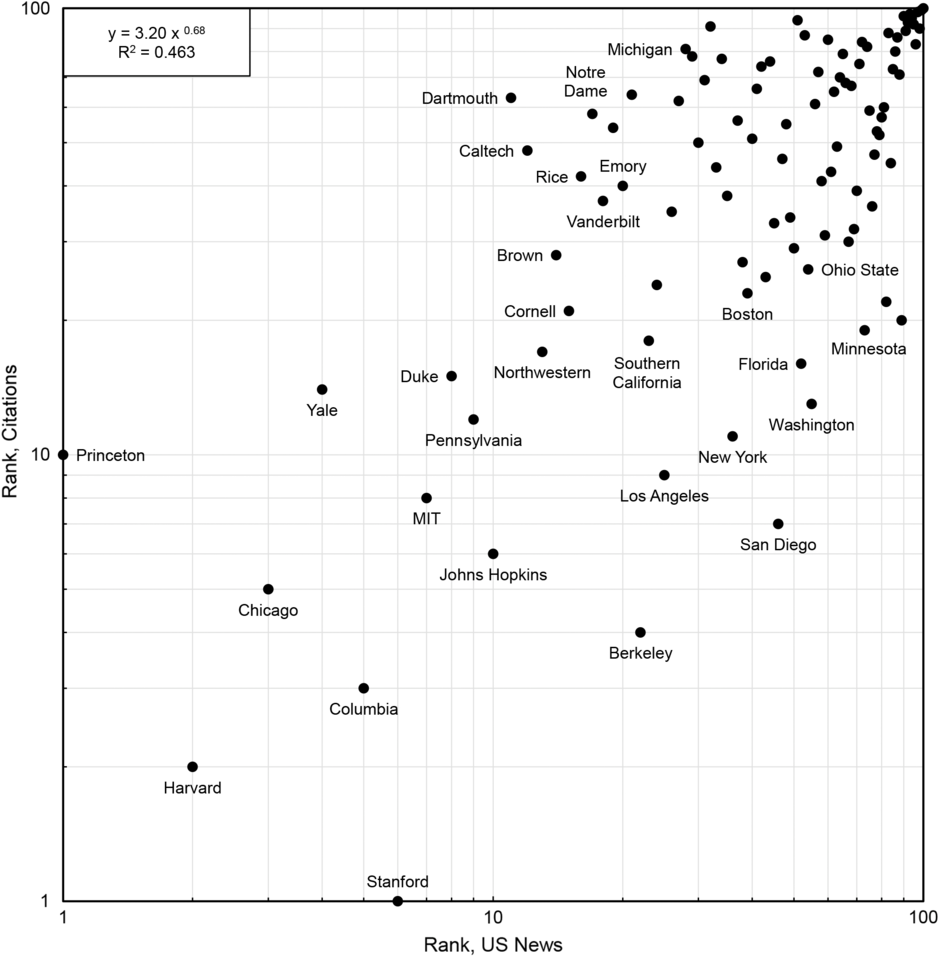
Good ideas make fame. Figure 3 also confirms that the higher ranks belong to universities that generate publications that are cited more in the world. The numerical column shows the total number of career-long citations of the top 200 authors that belong to each university. The total number of citations of an individual author was obtained on Google Scholar (2017), as were the top 200 authors of one university. All citation numbers plotted in the figures of the current paper were obtained during April and May 2017. The broad alignment of the two rankings, US News versus citations, is illustrated in Figure 4. Although there is scatter in the data, all universities hug the ascending diagonal, not the descending diagonal. Broadly speaking, more citations make a higher ranking.
The university ranking from US News, versus a ranking based on the citations accumulated by the top 200 authors of each university.

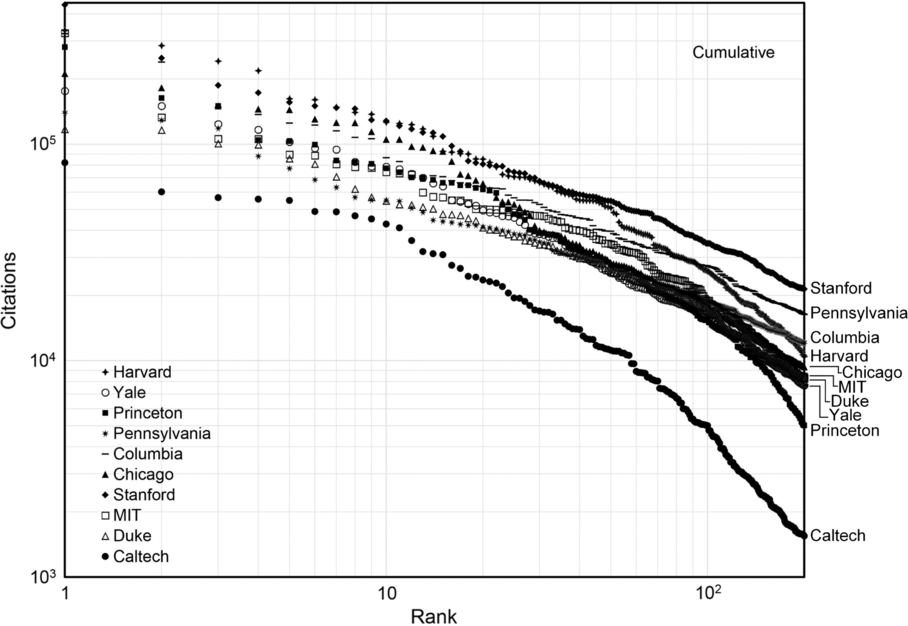
The rigidity of university rankings has the same physics origin as the rigidity of other rankings such as law firms (Staci Reference Staci2017). Every annual ranking of universities is a manifestation of the hierarchical flow architecture that emerges naturally to connect the whole globe to the individual institutions and companies that dot the world map. Who contributes to the citations of the highly ranked universities? The more highly cited authors. Figure 5 shows the total citations of the top 200 authors from the top 10 ranked universities according to US News. The data line up essentially the same way for all top universities.
The cumulative citations of the top 200 cited authors from the top 10 universities ranked in Figure 3.

Two observations stand out. On a log-log graph the data occupy a narrow band with a slope between –1/2 and –1, which resembles the slope that is found in other rankings (Bejan Reference Bejan2020) such as tree sizes and numbers on the forest floor (Bejan et al. Reference Bejan, Lorente and Lee2008), city sizes and numbers on a continent (Bejan et al. Reference Bejan, Lorente, Miguel and Reis2006), and airplane sizes and numbers in the global air traffic system (Bejan et al. Reference Bejan, Chen, Lorente and Wen2017). This coincidence lends support to the physics explanation for the presence of the global university as an evolving flow architecture with hierarchy (Figures 1 and 2).
The low end of each descending curve in Figure 5 is not the ‘long tail’ of the curve. The data in this figure account only for the most prolific and most read authors of these institutions. The long tail could not be plotted: it would fall much lower and farther to the right, where the rank on the abscissa exceeds 103, and the number of life-long citations on the ordinate drops below 103.
Size
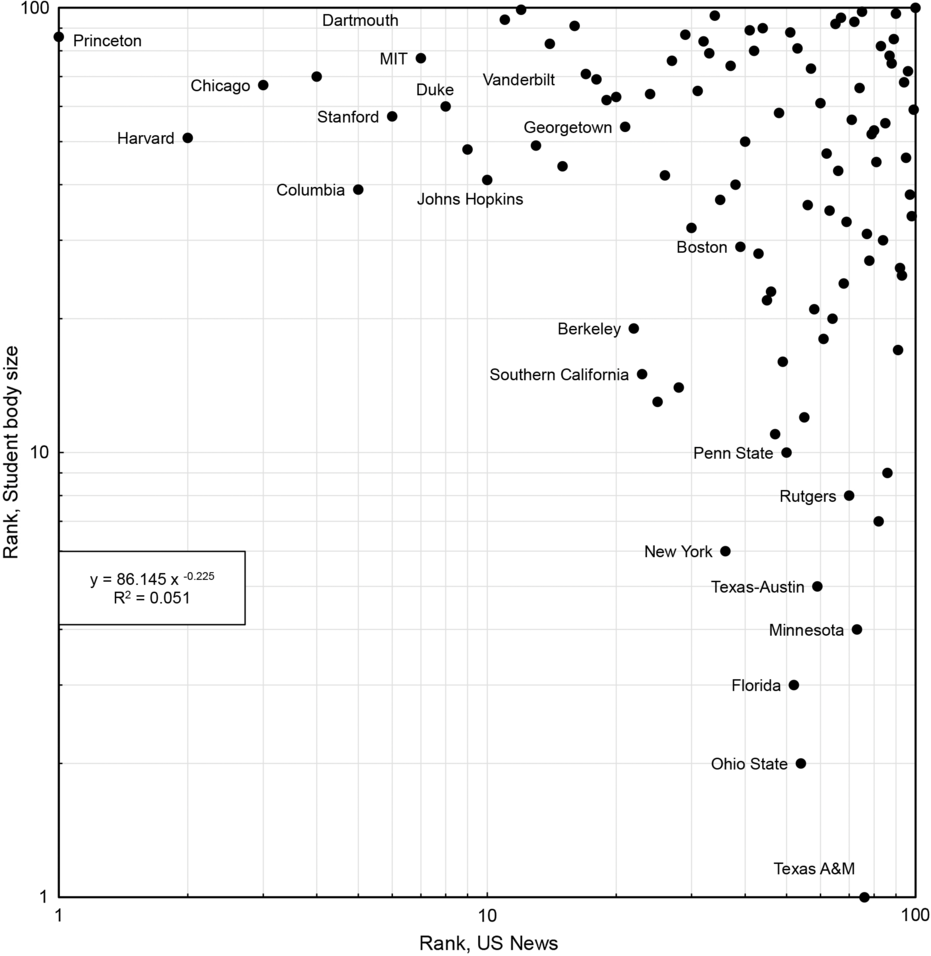
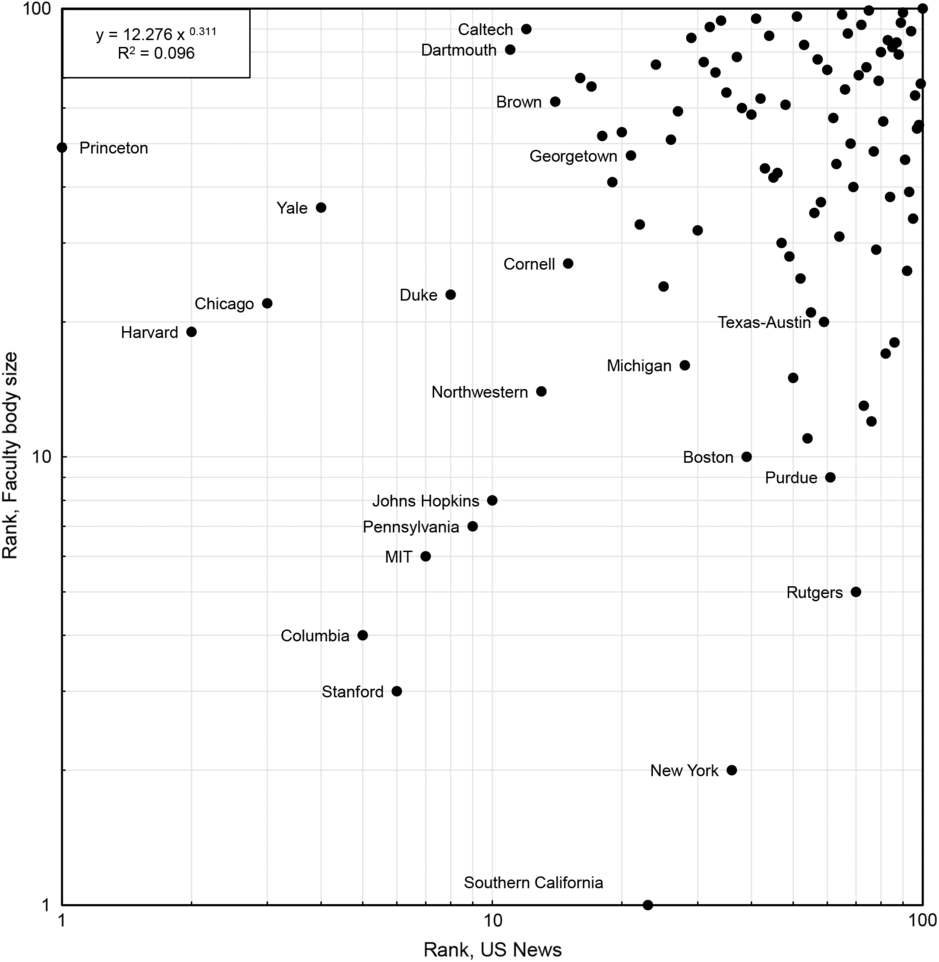
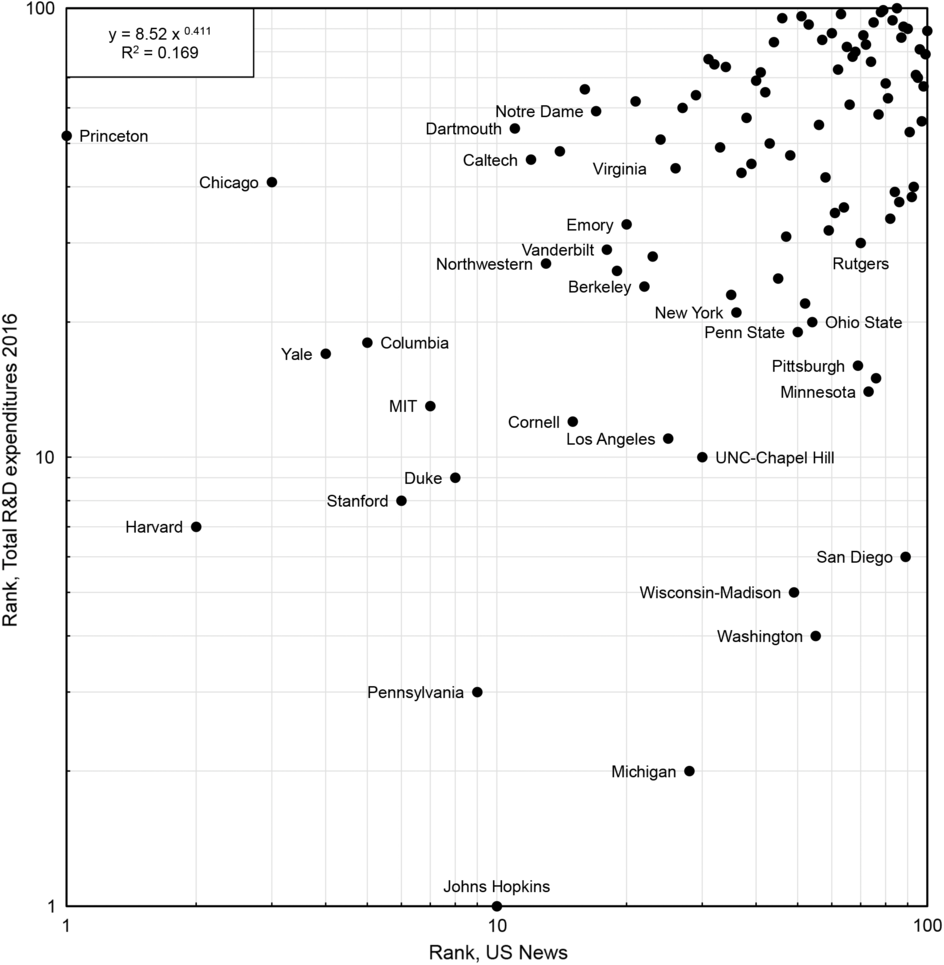
Size is another feature that distinguishes universities, and it is visibly present in the university rankings that are published every year. Is a larger size responsible for a higher ranking? This question is explored in Figures 6–9, which plot proxies for university size versus rank, in a similar way as in Figure 4 for the relation between citations and rank.
Rankings according to student body size versus the rank according to US News (The Best Colleges in America 2018).

Rankings according to faculty body size versus the rank according to US News (The Best Colleges in America 2018).

Rankings according to annual R&D expenditures versus the rank according to US News (NSF – Rankings by Total R&D Expenditures 2016).


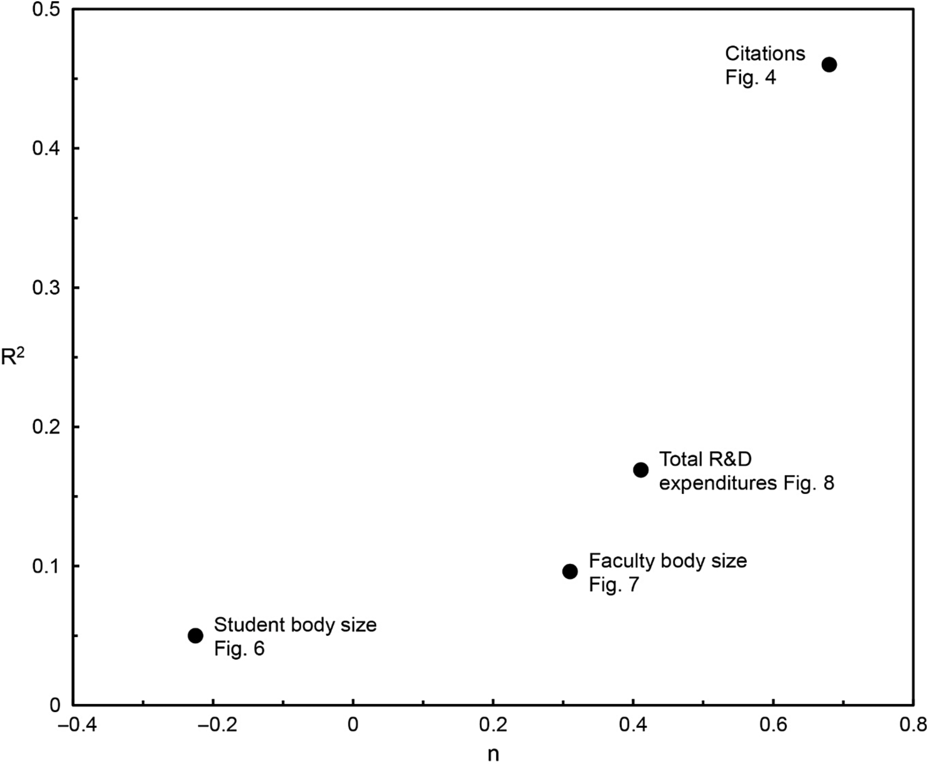
The size of a university can be measured in several ways. In Figure 6 the student body size is plotted versus university rank on the abscissa. We find that there is no correlation between the rank and the student body size, because the exponent n in the presumed y ∝ x n dependence is negative, n = – 0.225, and the coefficient of determination R 2 = 0.051 is very low compared with other R 2 values, as we will see later in Figure 9.
Faculty body size is another measure and, as shown in Figure 7, it correlates slightly better with the university rank, n = 0.311 and R 2 = 0.096. Another measure of size is the total R&D annual expenditures at a university. Figure 8 shows a somewhat improved correlation with university rank, n = 0.411 and R 2 = 0.169.
None of these attempts to find a correlation between size and rank is as successful as that found in Figure 4, where n = 0.68 and R 2 = 0.463. This n exponent (of order 1) and the high R 2 value statistically indicate an approximate proportionality between the rank of the university and the rank of the same university in terms of the number of citations counted according to the caption of Figure 4.
Figure 9 is a summary of the relative success of establishing a linear dependence of a university’s rank on quality (Figure 4) and size (Figures 6–8). Success means higher n and R 2 values. The first conclusion is that, of all these measures, quality (fame, citations) is what underpins rankings.
The second conclusion comes from the trend of the (n, R 2) points in Figure 9. The size measures that compete with citations are, first, the total R&D expenditures and, second, the faculty body size. This makes sense, because in order to generate ideas that other people cite, the university needs creative (active) professors, many of whom require funding for their research. A large number of students has a weak, perhaps detrimental effect on rankings. What does correlate with a higher ranking (in addition to citations) is higher faculty/student ratios.
Composition
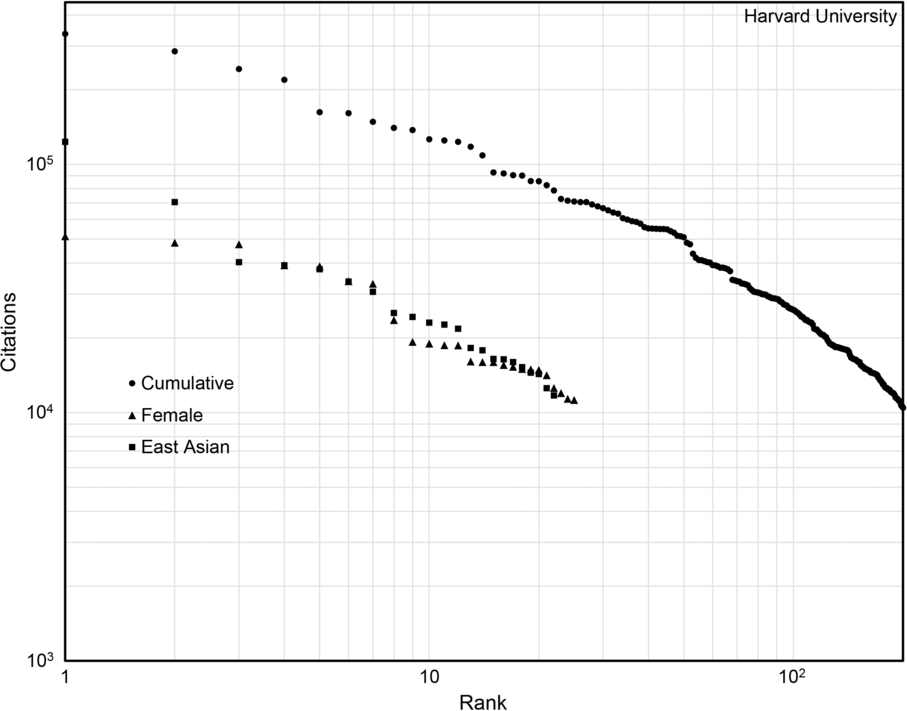
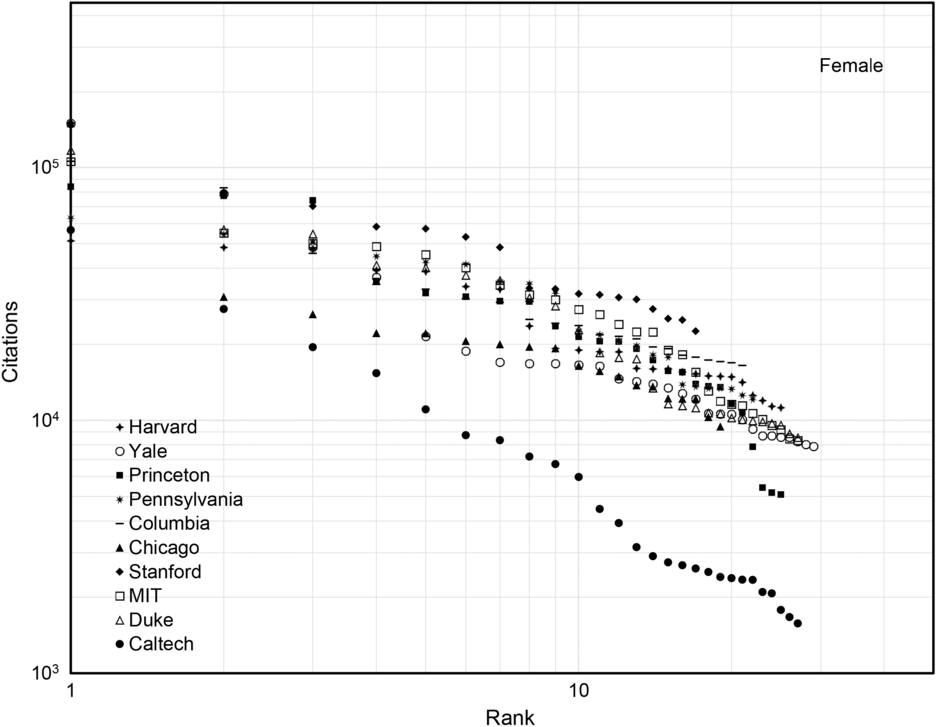
Various groups contribute in various ways to the citation performance reported in Figure 5. We explored this by counting the citations of the female authors from each group of the top 200 authors of one university. This results in plots such as that shown in Figure 10 for each university (Figure 10 is for Harvard). We find that such plots do not vary much from one top university to the next: the citations-rank curve for female authors is consistently 1/5th of the cumulative citations of each of the top campuses (Figure 5). The total citations of female authors among the top 200 cited from each university are reported in Figure 11. We conclude that the top universities have evolved the same way, naturally and independently.
The cumulative citations of the top 200 authors from Harvard, and the contribution of female and East Asian authors.

The ranking from US News versus the ranking based on the citations of female authors from among the top 200 authors in each university.

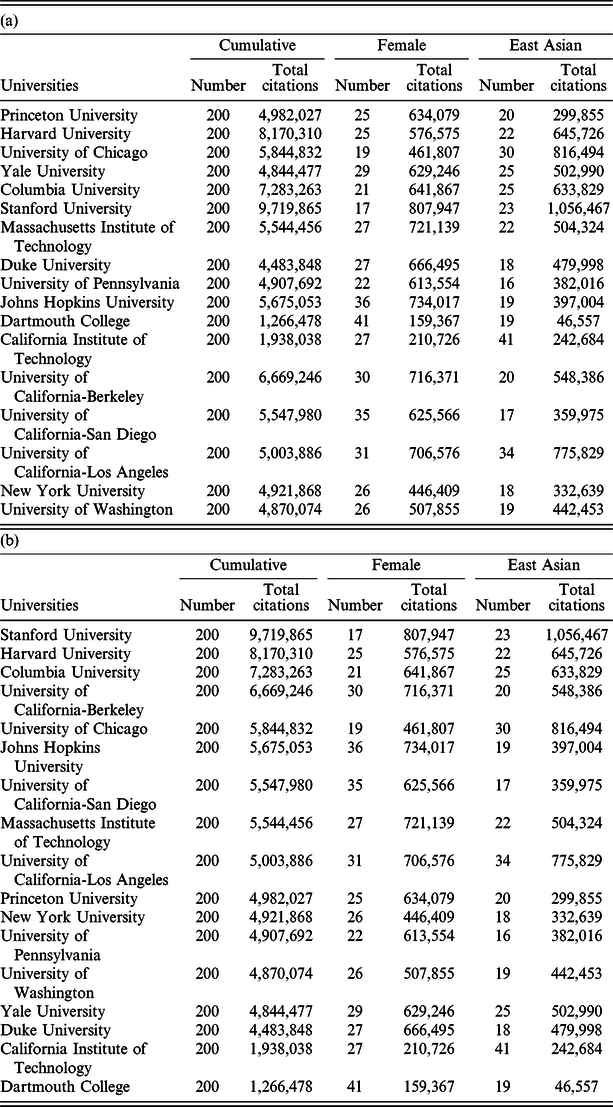
It is reasonable to argue that the 1/5 fraction is largely due to the small percentage of female authors on campus. A subtle aspect is that the 1/5 ratio is essentially the same for all the top universities shown in Table 1. This is also the ratio of female authors among the top 200. Then, it is reasonable to ask this question: if one seeks a ranking higher that of Harvard, and if one believes that greater diversity leads to higher rankings, then why would one want a composition that differs from that of Harvard?
Number of authors and total citations of the top 200 authors from the highest-ranked US universities: (a) ordered according to the 2017 ranking in US News & World Report, and (b) Ordered by the total number of citations.

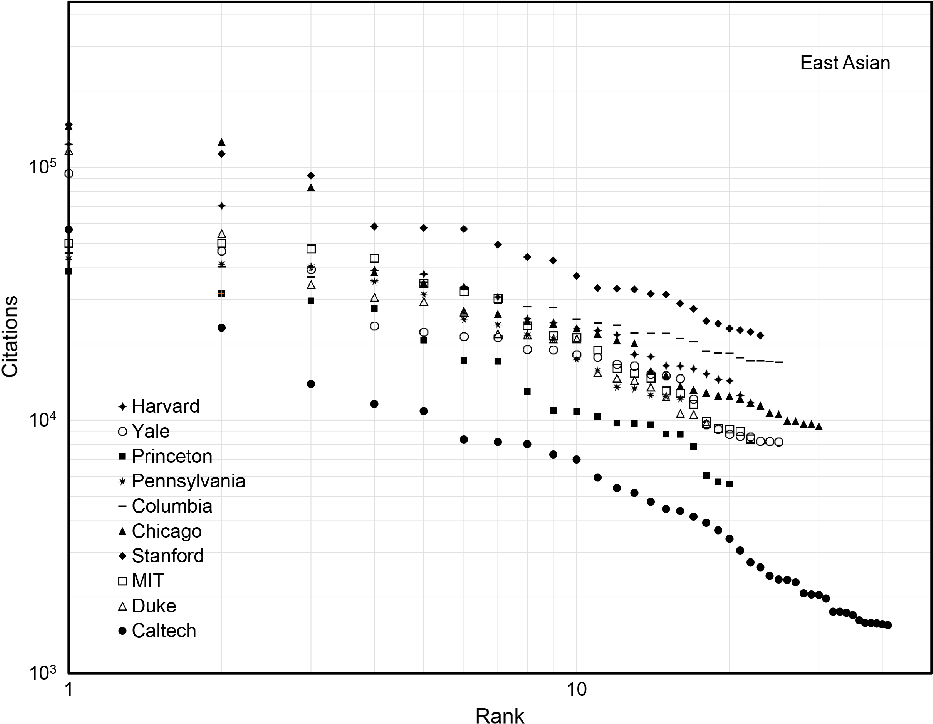
Initially, we intended to complement Figure 11 with an equivalent chart showing the citations contributed on each campus by authors of African origin. It was not possible to construct a chart such as in Figure 11 because the number of authors of African origin is extremely small. It was, however, possible to construct the corresponding chart for authors of East Asian origin, which is shown in Figure 12.
The ranking from US News versus the ranking based on the citations of East Asian authors from among the top 200 authors in each university.

The similarity between Figures 11 and 12 is remarkable. The relative rankings of the universities are essentially the same, and the curves have the same slope. Stanford is the top curve in both figures, and Caltech is at the bottom. Why these similarities? There is no policy on any campus to identify, recruit and attract talent of East Asian origin (Hartocollis and Saul Reference Hartocollis and Saul2017).
How did the East Asian authors arrive at this level of visibility as a group on each of the leading campuses? There is only one answer, and it holds equally for the female professors: by generating creative scholarship, good ideas, in freedom, independently of any university policy that might focus on them. They all came on their own, they created, and in this way they answered their calling.
The S-Curve of Spreading
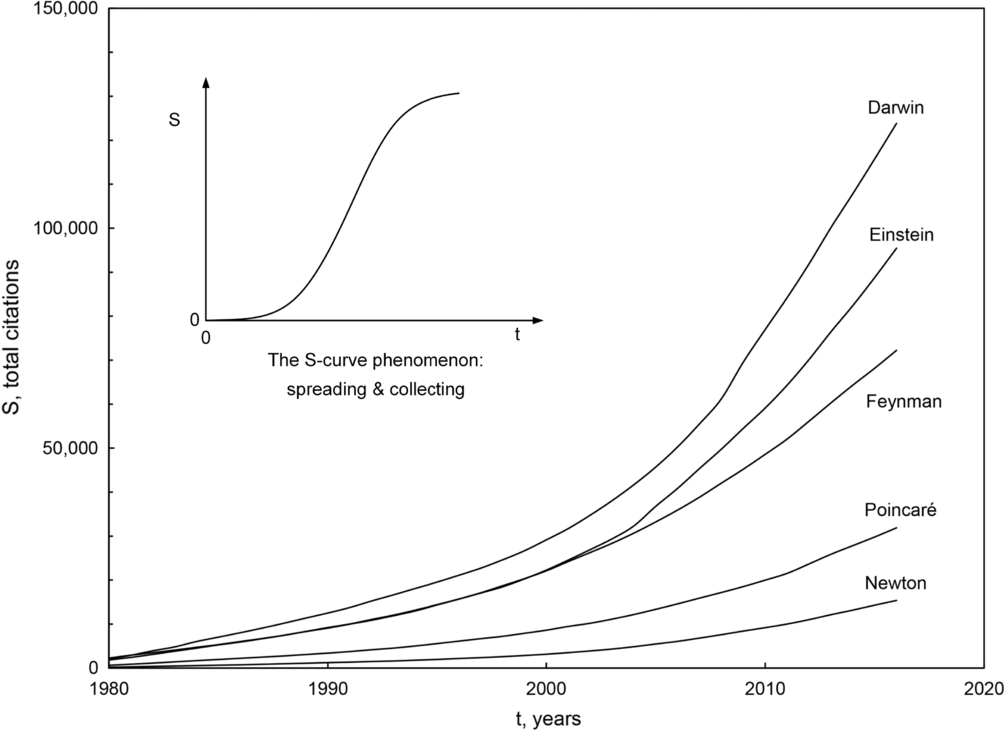
Every single piece of creative work (article, book, patent, news, etc.) that becomes public has a ‘life’ of spreading as a flow architecture on the globe (Bejan and Lorente Reference Bejan and Lorente2011, Reference Bejan and Lorente2012). The size of the population reached by a single publication increases over time in an S-curve fashion. If S(t) denotes the population size, such as the number of citations received by a single paper or book, then S(t) increases slow-fast-slow, as shown in Figure 13. The inflection point of the S(t) curve (at which its slope is maximal) corresponds to the time when the paper is being cited most frequently. This is when the spreading is said to be ‘viral’.
The current state of the total citations ‘S curves’ of some of the best known authors in the history of science. The detail shows the slow-fast-slow increase in any population.

The S shape of the citation curve is predictable once it is recognized that the spreading of the new idea does not diffuse uniformly through a crowd of identical readers who are positioned identically close to each other on the territory served by the source of an idea. Like a fresh downpour on a dry river basin, where the rain water initially flows (fast and far) through the old channels, the fresh idea flows first through the large channels that are available at the source: the English language, the internet, publications with high impact factor, and personal connections with known authors, journalists and editors of publications that popularize science, literature, art and culture. The spreading improves along the way, as the channels constantly undergo alteration.
The quality of an idea can be measured in terms of the total number of citations generated by the idea during its lifetime. Why ‘lifetime’? Because with few exceptions (e.g. Figure 13 and Klosik and Bornholdt Reference Klosik and Bornholdt2014), every S curve rises to a natural plateau. Low-cited papers reach low plateaus, and highly cited ones reach high plateaus. Golosovsky (Reference Golosovsky2017) showed statistically that low-cited papers reach the top of their S curves after 10–15 years, while the S curves of highly cited papers continue to rise indefinitely. The ‘viral’ period of a seminal, highly cited paper lasts a long time, long after the death of its author.
What holds for the S curves of individual papers also holds for ‘packages’ of papers, such as the papers published by a single author during his or her life. The cumulative number of citations of a low-cited author has an S curve with a life shorter than the author’s career. The life of the S curve of a highly cited author seems to go on indefinitely.
The total citations (S) of the few most famous authors continue to increase decades and centuries after their deaths (Figure 13). The rate of increase (dS/dt) also increases, indicating that the S curves of these few authors are still in their accelerating modes – in the convex portion of the S curve drawn in Figure 13, which shows the effect of the progressive ‘easing’ of the spreading of scientific ideas. Today, there is an accelerated increase in the number of active researchers, authors of scientific papers, numbers of journals, and readers and users of scientific results. This way, Figure 13 illustrates the physical meaning of today’s knowledge ‘industry’. Compared with today, one century ago there were few scientists, authors, and journals. The most famous from among those very few were the large branches of the ‘flow of knowledge’ tree then, and, in complete accordance with the evolutionary design of the global university system (Figure 1), they will continue to serve as a support structure for the spreading flow of ideas in the future.
What holds for the S curves of individual authors also holds for ‘packages’ of authors, such as the authors whose publishing careers are housed in a single university. The cumulative number of citations received by one university (on account of its group of top authors) increases in S-curve fashion to a high plateau if its authors are highly cited, and to a low plateau if its authors are low-cited.
Discussion
The life of a university is much longer than one professorial career. This is apparent from Figure 1, or from the long history of the first university in the world, the Alma Mater Studiorum (the nourishing mother of learning, in Latin) founded in Bologna in 1088. Generation after generation, each university renews its package of authors. Each generation adds its cumulative S(t) curve to the total number of citations of the university. The total S of the university is high when generation after generation the contributors to that total are creative, recognized and valued by users, and highly cited. This is why the total numbers of citations of highly ranked universities are high, as evidenced by the numbers compiled in Table 1.
The university that houses generation after generation of authors whose ideas spread over many users becomes recognized by the whole world as a source of ideas. It becomes famous. With every new generation, the new textbooks that are used by students illustrate how certain ideas and details fade in the narrative, while the names of their creators remain. Over the many years in the life of the university, the world remembers not the ideas but the few names of its most famous creators of ideas. The names become common knowledge worldwide, which is the physical basis for the rigidity (permanence) of university rankings.
Why is this useful to know? Because, by understanding the physics principles that underlie natural phenomena, people can position themselves and their society better in nature, can put the natural phenomena at their service and can avoid fighting losing battles (Bejan Reference Bejan2020; Basak Reference Basak2011; Reis Reference Reis2011; Wang Reference Wang2011). After all, science is about people, about what is interesting and useful to people.
This truth is useful to know and pass on to all who wish to improve themselves, their university and all of society. The public interest in the physics phenomenon unveiled in this paper is significant in view of the intensity of the contemporary debate on academic diversity (Blosser Reference Blosser2017; Hasse Reference Hasse2002; Perrault Reference Perrault2015), collective intelligence (Ellinas et al. Reference Ellinas, Allan and Johansson2017; Mann and Helbing Reference Mann and Helbing2017; Page Reference Page2007), underrepresented minorities (Eagly Reference Eagly2017; Fiscutean Reference Fiscutean2017), and immigration in academia (Tien Reference Tien1994).
Acknowledgements
Professor Bejan’s work was supported by the US National Science Foundation. Umit Gunes’ PhD research at Duke University was supported by the Scientific and Technological Research Council of Turkey (TÜBİTAK). Professor Bejan thanks Dean Ravi Bellamkonda for bringing Page (2007) to his attention.
About the Authors
Adrian Bejan is the J.A. Jones Distinguished Professor at Duke University, and is a member of Academia Europaea. He is a graduate of the Massachusetts Institute of Technology (BS 1971, MS 1972, PhD 1975) and an Honorary Member of the American Society of Mechanical Engineers. He has received 18 honorary doctorates from universities in 11 countries. He has published widely on thermodynamics, evolutionary design, and the law of evolution in nature, as physics.
Umit Gunes is a graduate of YTU (BS 2011, MA 2013, PhD 2019). In addition, he was a PhD researcher at Duke University’s Mechanical Engineering and Materials Science from January 2017 to April 2018.
Bahri Sahin is Rector of Yildiz Technical University (YTU) and professor in the Department of Naval Architecture and Marine Engineering. He is a graduate of Gazi University (BS 1985), YTU (MA 1979), and Istanbul Technical University (PhD 1985). He has worked as a research assistant (1979–1983) and a lecturer (1983–1986) in the Department of Mechanical Engineering. In addition to continuing his academic career as an assistant professor (1986–1989) at YTU, he was an associate professor (1989–1995) and a professor there since 1995. He was elected a principal member of Turkish Academy of Science (TUBA) in 2012 by the Scientific Board of TÜBİTAK.