Introduction
Productivity in the Southern Ocean is characterized by large-scale spatial and temporal variability. This is primarily due to the annual expansion and contraction of sea ice around the Antarctic continent that influences not only pelagic systems under the ice, but enhances the ecological variability and productivity of the within-ice biota (Legendre et al. Reference Legendre, Ackley, Dieckmann, Gulliksen, Horner, Hoshiai, Melnikov, Reeburgh, Spindler and Sullivan1992, Ackley & Sullivan Reference Ackley and Sullivan1994). Although heterotrophic bacteria are an essential component of the sea ice microbial community, the diversity and functional capabilities of ice-associated bacteria remain poorly characterized, particularly with respect to community-level processes such as carbon cycling (Ducklow et al. Reference Ducklow, Carlson and Smith1999, Stewart & Fritsen Reference Stewart and Fritsen2004). However, the high degree of in situ metabolic activity (Martin et al. Reference Martin, Hall, O'Toole, Davy and Ryan2008, Reference Martin, Hall and Ryan2009) and seasonal coupling between the relative abundance of bacteria and microalgae has led to the identification of an active microbial loop, similar to that of temperate oceanic systems (Sullivan & Palmisano Reference Sullivan and Palmisano1984, Azam et al. Reference Azam, Smith and Hollibaugh1991). This relationship is thought to develop when bacteria assimilate the dissolved organic matter (DOM) that is generated by the direct release of photosynthate by microalgae, the production of algal-derived extracellular polymeric substances (EPS), or the rupture and degradation of algal cells during protistan grazing (Thomas & Dieckmann Reference Thomas and Dieckmann2002, Azam & Malfatti Reference Azam and Malfatti2007). In return, bacteria are thought to facilitate primary production by providing microalgae with the vitamins and/or recycled inorganic nutrients that are required for continued growth (Kottmeier et al. Reference Kottmeier, McGrath Grossi and Sullivan1987, Kottmeier & Sullivan Reference Kottmeier and Sullivan1990, Archer et al. Reference Archer, Leakey, Burkill, Sleigh and Appleby1996, Taylor & Sullivan Reference Taylor and Sullivan2008).
An active microbial loop within Antarctic sea ice has historically been implied by regression analysis and the correlation between microalgae (or proxies such as chlorophyll a (chl a)) and estimates of bacterial abundance or production (e.g. Kottmeier et al. Reference Kottmeier, McGrath Grossi and Sullivan1987, Stewart & Fritsen Reference Stewart and Fritsen2004, Martin et al. Reference Martin, Anderson, Thorn, Davy and Ryan2011). A complete understanding of microbial dynamics within the sea ice ecosystem clearly requires information beyond the use of proxy biomass measurements (Garrison et al. Reference Garrison, Gibson, Coale, Gowing, Okolodkov, Fritsen and Jeffries2005), but this is challenging given that dissolved salts are actively excluded during freezing and microbes become concentrated in microscopic pockets of liquid brine within the ice. The majority of sea ice studies have thus relied on bulk analyses of melted ice cores or extracted brine, a methodology that does not maintain the spatial arrangement of microbes within the ice and only offers a snapshot of the microbial community at a single point in time. An alternative methodology with which to quantify trophic interactions are micro- or mesocosm simulations using seawater cultures. This technique provides an enhanced degree of experimental resolution (albeit at the expense of being a natural ecosystem) whereby factors of interest can be controlled during manipulative experiments. With respect to the assimilation of DOM, this approach has been used to mimic bloom events in Antarctic waters to ascertain possible ‘seeding’ by ice-derived organisms (Giesenhagen et al. Reference Giesenhagen, Detmer, De Wall, Weber, Gradinger and Jochem1999), and to calibrate growth rates of bacteria in the vicinity of the Ross Sea polynya (Ducklow et al. Reference Ducklow, Carlson and Smith1999). Interestingly, both these studies reported a positive response by the respective bacterial communities to dissolved organic substances and these findings probably reflect in situ microbial dynamics.
The aim of this study was to use microcosm simulations to influence photosynthesis in microalgae and document the response of bacteria to potential changes in substrate availability. Microbes from both the bottom (high DOM) and surface brine region (low DOM) of Antarctic fast ice were incubated for a period of nine days. The supply of substrate made available for bacterial metabolism was indirectly manipulated by restricting microalgal photosynthesis with 3-(3,4-dichlorophenyl)-1,1-dimethylurea (DCMU), varying the light exposure during incubation (light:dark, 14:10 h, light 150 μmol photons m-2 s-1) or incubating microbes in the dark. The cell-specific assay 5-cyano-2,3-ditolyl tetrazolium chloride (CTC) was used to quantify bacterial metabolic activity and potential shifts in community composition were examined using denaturing gradient gel electrophoresis (DGGE) of PCR-amplified 16S rRNA gene fragments.
Material and methods
Brine community experiment
Sea ice microbes were collected in November 2007 from annual fast ice in Terra Nova Bay, Antarctica (74°38′S, 164°13′E). Approximately 1.5 litres of brine (∼ 60‰) was collected using a sterile scoop from a hole drilled to a depth of 300 mm with a Kovacs ice corer (Kovacs Enterprises Inc, Lebanon NH, USA). To minimize light shock, the brine was collected under a black sheet and transported to the field camp in a sterile container with minimal disturbance. For each of the three treatments (light/dark, light/dark/DCMU, dark), triplicate 100 ml aliquots of the brine solution were transferred to 250 ml culture flasks with gas permeable lids. Incubations were carried out for nine days in a water bath maintained at -1.8°C. An ethanol:water (1:4) mix was used in the bathing solution to provide subzero temperatures and a heater stirrer was used to maintain the incubator to within ± 0.2°C. For the treatment with a chemical control, DCMU was added at a final concentration of 10-6 M on days 1 and 5. The light/dark and DCMU treatments were assigned to a light:dark regime of 14:10 h, with the light treatments being subject to 150 μmol photons m-2 s-1, while replicates for the dark treatment were incubated with no light exposure. Each culture flask was subsampled on days 1, 5 and 9 to determine bacterial cell abundance and community composition. The concentration of chl a and percentage of metabolically active bacteria was determined in the brine solution prior to incubation and at the conclusion of the experiment from each culture flask (Protocol S1, supplemental data at http://dx.doi.org/doi:10.1017/S0954102012000491).
Bottom community experiment
Microbes were collected in December 2005 from fast ice c. 2 m thick at O'Brien Bay, Antarctica (66°18′S, 110°22′E). Three holes (< 1.2 m) were drilled in close proximity with a powered ice auger (Jiffy) and cores (200–300 mm long, 130 mm diameter) were extracted from the bottom of each profile using a Kovacs ice corer. To prevent light shock, all operations were performed under a black sheet and each core was transported in a black plastic tube. Sea ice microbes were obtained by removing the bottom 30 mm of ice and melting each core section in a sterile container with 500 ml of 0.22 μm-filtered sea water (35‰, -1.8°C), under low light (< 1 μmol photons m-2 s-1), over a period of 12 h (Ryan et al. Reference Ryan, Ralph and McMinn2004). The cells from each core were combined in a single container with a final volume of c. 500 ml. For the three treatments (light/dark, light/dark/DCMU, dark), triplicate 60 ml aliquots were transferred to 250 ml culture flasks with gas permeable lids. Incubation temperature, irradiance and treatment regimes were identical to those of the brine community experiment. Each culture flask was subsampled on days 1, 5 and 9 to determine bacterial cell abundance and community composition. Given the higher microbial biomass present in the bottom of the ice, only 2 ml was removed from each flask for community composition analysis. Pre- and post-incubation estimates of bacterial abundance, metabolic activity and chl a were also determined.
On return to New Zealand, flow cytometry was used in both experiments to determine total bacterial counts and the proportion of metabolically active (CTC+) cells (Protocol S2, supplemental data, http://dx.doi.org/doi:10.1017/S0954102012000491). Bacterial genomic DNA was obtained from each filter and a 194 bp 16S rRNA fragment targeting the V3 region was amplified using primers 357F (CCT ACG GGA GGC AGC AG) and 518R (ATT ACC GCG GCT GCT GG) (Murray et al. Reference Murray, Hollibaugh and Orrego1996). The resulting 16S rRNA gene fragments from each sampling day were pooled and then separated using DGGE with a D-Code™ Universal Mutation Detection System (Bio-Rad Laboratories) (Protocol S3, supplemental data, http://dx.doi.org/doi:10.1017/S0954102012000491).
Microbial uptake of [14C] sodium bicarbonate
Sea ice microbes were collected in November 2006 from annual fast ice in Terra Nova Bay, Antarctica (74°38′S, 164°13′E). Three cores were extracted as described earlier and the bottom 50 mm of each core was cut and then melted in a sterile container with 500 ml of 0.22 μm-filtered sea water (35‰, -1.8°C), under low-light (< 1 μmol photons m-2 s-1), over a period of 12 h. The melted ice from each core was combined in a single container and the microbes were concentrated by decanting c. 1 l of seawater. To remove the majority of the flagellates and ciliates, the bottom ice solution was then passed through a 60 μm plankton net. For each of the three treatments (light, light/DCMU, dark) triplicate 10 ml aliquots of the filtrate were transferred to glass scintillation vials. For the chemical control, DCMU was added at a final concentration of 10-6 M. To provide time for the DCMU to take effect, the vials from each treatment were placed in a water bath (-1.8°C ± 0.2°C), in the dark, for 1 h. Replicates from each treatment were then spiked with [14C] sodium bicarbonate and incubated for 1 h, either in the dark or exposed to 80 μmol photons m-2 s-1. Following the incubation period, the microbes in each vial were passed sequentially through filters with the following pore sizes: 3.0, 0.8 and 0.22 μm. A subsample of the cells that passed through each filter was collected to determine total carbon production and relative species abundance (Protocol S4, supplemental data, http://dx.doi.org/doi:10.1017/S0954102012000491).
Statistical analyses
For both the brine and bottom ice experiments, a mixed model repeated measures analysis of variance was used to examine change in the abundance of bacterial cells in each treatment over time. One-way ANOVA was used to examine pre- and post-incubation estimates of chl a and CTC+ bacteria for both experiments. One-way ANOVA was also used to examine the uptake of [14C] sodium bicarbonate. These analyses were performed using SPSS (version 17.0). To analyse variation in the composition of bacterial communities, the Dice similarity coefficient was calculated on the DGGE band patterns for each pair of treatment-by-day sample units, separately for each of the experiments, using BioNumerics (Applied Maths). Patterns among samples, based on each of these similarity matrices were then visualized using non-metric multi-dimensional scaling ordination (MDS). Two-factor PERMANOVA (Anderson Reference Anderson2001, McArdle & Anderson Reference McArdle and Anderson2001) was used to compare treatments (dark, light/dark and DCMU) and days (1, 5 and 9) separately for each of the bottom ice and brine experiments, with P values obtained using 9999 permutations of the raw data (Manly Reference Manly2006). All multivariate analyses were performed using the PRIMER v6 computer program (Clarke & Gorley Reference Clarke and Gorley2006) with the PERMANOVA+ add-on package (Anderson et al. Reference Anderson, Gorley and Clarke2008).
Results
Brine community experiment
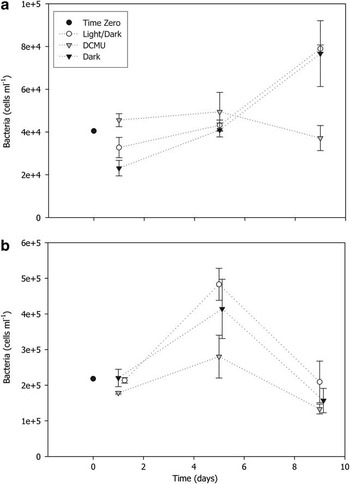
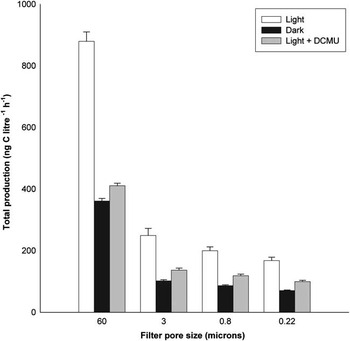
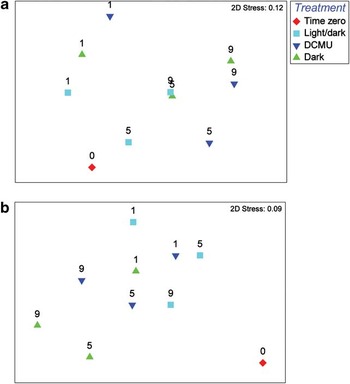
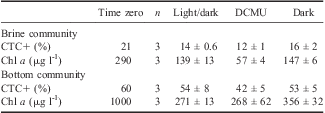
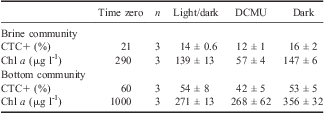
The repeated measures ANOVA revealed a significant interaction between treatments and incubation period (Wilks’ λ = 0.162, F 4,10 = 3.7, P = 0.042, Fig. 1a). A change in the total abundance of brine bacteria was observed for both the light/dark and dark treatments with an increase from c. 3 × 10⁴ to 8 × 10⁴ cells ml-1 by day 9. In contrast, there was relatively little variation in the abundance of bacteria in cultures spiked with DCMU among days 1–9 (c. 4 × 10⁴ cells ml-1) (Fig. 1a). DCMU halts photosynthesis in algae by specifically inhibiting the reoxidation of reduced coenzyme Q which is the primary electron acceptor of the PS II photosynthetic reaction centre (Karl Reference Karl1986). The herbicide was employed as a control to highlight the potential for endogenous carbon metabolism by sea ice algae rather than active photosynthesis. Because metabolic inhibitors of photosynthesis have historically been avoided due to concerns that they provide bacterial growth substrates or interrupt grazer metabolism, we employed radioactive labelling to qualify the use of DCMU. The herbicide was shown to be non-lethal and significantly reduced carbon fixation compared to the light treatment (P < 0.001 in all size fractions, Fig. 2). In addition, the continued uptake of 14C following the sequential removal of algal cells in both the dark and light/DCMU treatments (see Table S1, http://dx.doi.org/doi:10.1017/S0954102012000491) illustrates that DCMU is non-lethal to sea ice bacteria and provides indirect evidence that bacteria were metabolising organic material that had been exuded by microalgae. The proportion of metabolically active (CTC+) cells varied between 10 and 20% of the total community on day 9 of the brine experiment, but no difference was detected among treatments (F 2,6 = 2.822, P = 0.137, Table I). The concentration of chl a declined during the course of the experiment but differed significantly among treatments (F 2,6 = 29.535, P = 0.001) with less chl a in the DCMU treatment compared to either the light/dark or dark treatments (Table I). The community fingerprints that were generated for the brine experiment using DGGE contained between 12 and 17 distinct bands. There were significant differences among treatments (pseudo F 2,4 = 6.22, P = 0.006) and also changes in bacterial community structure with time (pseudo F 2,4 = 16.21, P < 0.001). Temporal effects were apparent in the MDS plot (Fig. 3a), with the average similarity between days 1 and 9 being < 40%. The fingerprints from time zero for the brine communities were distinct from the other bacterial communities, having an average similarity of only 41.7%, while the average similarity among all other samples was higher at 53.7%. Although statistically significant treatment effects were detected, the individual pair-wise comparisons did not discern these differences. At days 1 and 9, the dark and DCMU treatments were more similar to one another, and less similar to the light/dark treatment (Fig. 3a).
Total abundance of a. brine bacteria collected from annual fast ice in Terra Nova Bay, Antarctica, and b. bottom ice bacteria collected from annual fast ice in O'Brien Bay, Antarctica incubated at -1.8°C for nine days. Time zero = initial post-melt cell concentration. Light/dark = 14:10 h, 150 μmol photons m-2 s-1:dark. DCMU = light/dark regime and the addition of 3-(3,4-dichlorophenyl)-1,1-dimethylurea. Dark = zero light exposure. Data are means ± 1 SE.

Time point estimates of [14C] sodium bicarbonate incorporation by microbes collected from annual fast ice in Terra Nova Bay, Antarctica, incubated at -1.8°C for 1 h. Light = 80 μmol photons m-2 s-1. Dark = zero light exposure. Light+DCMU = light regime and the addition of 3-(3,4-dichlorophenyl)-1,1-dimethylurea. Data are means ± 1 SE.

Non-metric multidimensional scaling (NMDS) plots of centroids (n = 3) based on the Dice similarity matrix among sample units calculated from DGGE fingerprints of 16S rRNA bacterial gene fragments. Time zero = initial post-melt cell concentration. Light/dark = 14:10 h, 150 μmol photons m-2 s-1:dark. DCMU = light/dark regime and addition of 3-(3,4-dichlorophenyl)-1,1-dimethylurea. Dark = zero light exposure. Bacterial community composition was examined on the following days: 1, 5 and 9. a. Brine bacteria, b. Bottom ice bacteria.

Post-incubation estimates of single-cell metabolic activity (CTC+ cells) and chl a concentration for brine (Terra Nova Bay, Antarctica) and bottom ice (O'Brien Bay, Antarctica) microbial communities incubated for nine days at -1.8°C. Time zero=initial post-melt cell concentration. Light/dark=14:10 h, 150 μmol photons m-2 s-1:dark. DCMU=light/dark regime combined with 3-(3,4-dichlorophenyl)-1,1-dimethylurea. Dark=zero light exposure. Data are means ± 1 SE.
Bottom community experiment
The total abundance of ice-derived bacteria increased from c. 2 × 10⁵ cells ml-1 to 4 × 10⁵ cells ml-1 between days 1 and 5 in the light/dark and dark-only incubation regimes (Fig. 1b). In the DCMU treatment, the bacterial abundance increased from 2.0 × 10⁵ cells ml-1 to only 2.5 × 10⁵ cells ml-1 by day 5. The total abundance of bacteria subsequently declined in all treatments between days 5 and 9 (Fig. 1b). The repeated measures ANOVA showed no significant interaction between treatment type and incubation period (Wilks’ λ = 0.525, F 4,10 = 0.917, P = 0.491), but there was a substantial effect of incubation period (Wilks’ λ = 0.203, F 2,5 = 9.81, P = 0.019) and significant differences among treatments (F 2,6 = 5.912, P = 0.038). A post-hoc Tukey test indicated that the abundance of bacteria incubated under the light/dark regime was significantly higher than the DCMU treatment. The percentage of metabolically active bacteria assayed on day 9 varied between 35 and 69% (Table I). There was no statistically significant difference detected among treatments however (F 2,6 = 1.11, P = 0.389, Table I). The concentration of chl a was significantly lower in all treatments on day 9 compared to the initial post-melt measurement, but there was no difference among treatments (F 2,6 = 1.45, P = 0.306) (Table I). In the bottom ice experiment there were between 11 and 13 bands in each DGGE fingerprint, but no significant effects of either treatment (pseudo F 2,4 = 4.71, P = 0.089) or sampling day (pseudo F 2,4 = 2.34, P = 0.214) were evident. Temporal variation in the bottom ice experiment was quite constrained, with the average similarities among groups of samples from days 1, 5 and 9 all being > 80%. Average similarities among the treatments were also fairly high (> 76%). The average similarity among all times and treatments (except time-zero) was 84.1%, while the average similarity between any sample and the time-zero sample was only 62.4%. This distinctiveness of the time-zero fingerprint was also apparent in the MDS plot (Fig. 3b).
Discussion
This study was primarily conducted to investigate the influence of microalgal photosynthesis on bacterial activity, growth and community structure. Although we adopt the term microcosm, the experimental replicates were 60 ml (bottom ice) and 100 ml (brine) due to the logistical constraints of deep-field Antarctic research. The association of microbes with a large plastic surface area (‘bottle effect’) may have influenced the results and we also acknowledge that melting ice cores in seawater would have resulted in a minor level of DOM contamination. However, this approach can be considered an improvement on simple biomass correlations and the results provide a useful insight into the bacterial assimilation of algal-derived DOM.
Brine community experiment
The abundance of bacteria in both the light/dark and dark treatments essentially doubled during the course of the experiment. In contrast, the relatively minor changes in cell abundance between days 1 and 9 for culture flasks spiked with DCMU is indicative of substrate limitation. Although the percentage of metabolically active brine bacteria was considerably higher than the 2–10% level of activity typical of most marine systems (Bernard et al. Reference Bernard, Schäfer, Joux, Courties, Muyzer and Lebaron2000, Bernard et al. Reference Bernard, Courties, Duperray, Schäfer, Muyzer and Lebaron2001, Schumann et al. Reference Schumann, Schiewer, Karsten and Rieling2003, Longnecker et al. Reference Longnecker, Sherr and Sherr2005), the comparable activity among treatments on day 9 was unexpected given the lack of bacterial growth in replicates spiked with DCMU. Similar end-point estimates for CTC+ bacteria are difficult to interpret, but may indicate that intracellular activity can be maintained without cell division, or that substrate for bacterial metabolism was not limiting due to the rupture and degradation of algal cells associated with grazing. Importantly, the CTC assay remains controversial. Several authors have claimed that the stain in fact inhibits metabolism in bacteria and underestimates the proportion of active cells (Ullrich et al. Reference Ullrich, Karrasch, Hoppe, Jeskulke and Mehrens1996, Servais et al. Reference Servais, Agogué, Courties, Joux and Lebaron2001). We have calibrated this assay against incorporation rates of tritiated leucine in the sea ice ecosystem (Martin et al. Reference Martin, Hall and Ryan2009) and agree with Gasol & Arístegui (Reference Gasol and Arístegui2007) who suggested that the CTC assay can provide useful data when addressing ecological questions.
Although rates of protistan grazing by heterotrophic flagellates and ciliates were not directly quantified in this study, the loss of chl a in the light/dark and dark treatments may be an indication of grazing activity rather than the bleaching of photosynthetic pigments in the light treatment, the accumulation of dead or degraded cells in the dark treatment, or photoadaptation by microalgae in either treatment. However, this is speculative, changes in chl a are just as likely to reflect the availability of macro- and micronutrients or the successional maturity of the microbial community.
Bottom community experiment
The congelation layer of sea ice is characterized by favourable saline and temperature regimes as well as suitable substrates and a significantly higher concentration of DOM and other nutrients. As a result, 50% of the observed abundance and 90% of the bacterial biomass occurs in the bottom 20 cm of fast ice, where bacteria have been observed as paired or dividing cells that can be five- to tenfold larger in size than the bacterioplankton in the underlying water column (Sullivan & Palmisano Reference Sullivan and Palmisano1984). As would be expected, given the favourable high-DOM environment, both the pre- and post-incubation estimates of bacterial metabolic activity were substantially higher in the bottom ice microcosm compared to the brine microcosm (Table I). A similar level of activity has previously been reported from this region of the sea ice (Martin et al. Reference Martin, Hall, O'Toole, Davy and Ryan2008), but as in other studies it is not clear whether this response is a direct result of increasing the availability of DOM by melting the ice (Giesenhagen et al. Reference Giesenhagen, Detmer, De Wall, Weber, Gradinger and Jochem1999, Martin et al. Reference Martin, Hall and Ryan2009). Following the significant increase in abundance between days 1 and 5, the concentration of bottom ice bacteria declined dramatically in all culture flasks by day 9. For the DCMU and dark treatments this was to a level below the post-melt cell concentration. The observed decline in bacterial cells differs substantially from the findings of Giesenhagen et al. (Reference Giesenhagen, Detmer, De Wall, Weber, Gradinger and Jochem1999) who reported an increase in both bacterial production and cell abundance during a 14-day multi-microcosm experiment that utilized pack-ice microbes. Protistan grazing in the congelation layer of the ice has been documented by various authors (see Archer et al. Reference Archer, Leakey, Burkill, Sleigh and Appleby1996, Scott et al. Reference Scott, Davidson and Marchant2001, Fiala et al. Reference Fiala, Kuosa, Kopczyńska, Oriol and Delille2006) and might account for the loss of bacteria. Alternatively, substrate depletion could also account for the observed decline in bacterial abundance.
In a recent review of microbial carbon flux in the sea, Gasol et al. (Reference Gasol, Pinhassi, Alonso-Sáez, Ducklow, Herndl, Koblížek, Labrenz, Luo, Morán, Reinthaler and Simon2008) highlighted the current ambiguity associated with measuring bacterial production (leucine and/or thymidine incorporation) and recommended that both dark and light incubations be run in parallel. We adopted this approach and bacterial intracellular activity and growth was shown to be similar whether or not cultures were maintained in the dark, or exposed to a light/dark cycle. Importantly, the growth of bacteria confined to the dark is inconsistent with the assumption that bacteria are responding to algal-derived DOM. However, the physiological mechanisms of dark survival in sea ice algae remain poorly characterized and the extent to which microalgae continue to produce exudates during the metabolism of endogenous carbon reserves is not known.
Notwithstanding the issues with DNA extraction efficiency, rRNA gene copy number and PCR primer annealing efficiency (see Reysenbach et al. Reference Reysenbach, Giver, Wickham and Pace1992, Farrelly et al. Reference Farrelly, Rainey and Stackebrandt1995 for reviews), DGGE has become an established alternative to morphological-based identifications of bacterial and archaeal assemblages (Casamayor et al. Reference Casamayor, Schäfer, Bańeras, Pedrós-Alió and Muyzer2000, Gast et al. Reference Gast, Dennett and Caron2004). However, only relatively recently has a combination of PCR primer sets been applied to the same set of environmental samples as a means of validating primer choice (Sánchez et al. Reference Sánchez, Gasol, Massana, Mas and Pedrós-Alió2007). We used the primer set secondarily favoured by Sánchez et al. (Reference Sánchez, Gasol, Massana, Mas and Pedrós-Alió2007) as the recommended primers (357F and 907RM) could not be optimized for our sea ice samples. Reduced amplicon length (c. 160 bp) was therefore accepted in both experiments as a trade-off for maximizing the band-based characterization of the bacterial communities. Despite phylogenetic information being sourced from only c. 150 bp, excised DGGE bands showed acceptable (> 90%) similarity to α-proteobacteria sequences from polar regions, and high bootstrap support for these groupings was obtained in construction of a neighbour-joining tree (Fig. S1, Table S2, http://dx.doi.org/doi:10.1017/S0954102012000491).
Conclusion
By restricting photosynthesis with DCMU, the subsequent growth of bacterial cells was restricted, an effect that was most pronounced in the microbial community derived from the brine region of the ice which is typically characterized by low DOM. Bacterial metabolic activity in the brine was lower than that observed for bottom ice cells, which suggests that the availability of DOM (and the concentration of microalgae) may have a greater influence on bacterial abundance than either low temperature or high salinity in this region of the ice. Future studies will clearly require direct quantification of labile DOM components (amino acids, glycolate, sugars) as well as rates of herbivory and bacterivory. A mechanistic understanding of productivity and trophodynamics in the Antarctic sea ice ecosystem will ultimately require techniques that probe the spatial confines of the ice matrix, however, the microcosm technique represents an important step towards achieving that goal.
Acknowledgements
We acknowledge the logistical support of Antarctica New Zealand and in particular S. Gordon, project manager of the Latitudinal Gradient Project (LGP). A. Martin was supported by a Victoria University of Wellington Postgraduate Scholarship for PhD Study and also thanks the Trans Antarctic Association for support in funding this research. K. Ryan acknowledges the support of the Foundation of Research, Science & Technology contract no. VICX0706. We extend our thanks to the anonymous reviewers whose comments significantly improved the manuscript.
Supplemental material
Supplemental material describing protocols, two supplemental tables and a supplemental figure will be found at http://dx.doi.org/doi:10.1017/S0954102012000491.