1. Aim, rationale and previous work
The major aim of this work is to evaluate the most likely changes of the Antarctic ice sheet over the next few hundred years and the consequential impact on sea level. Because these future changes depend not only on future climatic forcing, including anthropogenic effects but also on the present state and past history of the ice sheet and its bedrock adjustment, it is necessary to model the ice sheet and its external forcing through the past as well as into the future.
A previous attempt to estimate the primary impact of future warming on the Antarctic ice sheet by Reference Budd, MeInnes, Jenssen, Smith, Van der Veen and OerlemansBudd and others (1987) suffered from a number of limitations. Although high resolution (20 km) was used for ice-stream flow bands, the whole Antarctic continent was only treated at a coarse resolution (100 km). The dynamics of the ice shelves were also not explicitly treated and the effects of possible increased accumulation with future warming were not addressed. The relatively large increases in Antarctic accumulation derived from an atmospheric General Circulation Model (GCM) study of future warming conditions by Reference Budd, Simmonds and WellerBudd and Simmonds 1991) also emphasizes the need to include this in the ice-sheet modelling and sea-level assessment.
A comprehensive Antarctic ice-sheet modelling study has been carried out by Reference HuybrechtsHuybrechts (1992). This work included modelling of past changes through the last ice-age cycle, as well as simulations for future warming conditions. The model resolution was 40 km and the ice shelves were explicitly treated. For the future warming simulations, Huybrechts considered changes in surface accumulation and surface-melt rates derived from a diagnostic model, dependent on the prescribed temperature changes. Only relatively small basal-melt rates were included (~1m a-1). Here, we consider that increased basal melting can be expected to be the dominant cause of loss of Antarctic ice due to future warming. Consequently, sensitivity studies have been carried out with basal-melt rates up to 10m a 1, as could be expected from the ocean warming discussed below.
The resolution of 20 km used here, as discussed by Reference Budd and JenssenBudd and Jenssen (1989), is also higher than that used by Reference HuybrechtsHuybrechts (1992), in order to try to represent the concentrated high flow rates in the large ice streams and outlet glaciers more clearly. The time step used here is 0.5 a. The input data for the model were obtained by adding to a compilation initially derived from the SPRI Map Folio of Reference DrewryDrewry (1983), for surface and bedrock elevation, and from the compilation of Reference Budd and SmithBudd and Smith (1985) for the surface-accumulation rates, and temperatures. Later data have subsequently been added, e.g. in East Antarctica from Reference Hamley, Smith and YoungHamley and others (1985) and later traverses, and for the West Antarctic ice streams and the Ross Ice Shelf from Reference Shabtaie and BentleyShabtaie and Bentley (1987), and the Filchner-Ronne Ice Shelf from Reference ThyssenThyssen (1988) and Lange and Reference Lange and MacAyealMacAyeal (1989). The original data set was digitized to 10 km resolution then reprocessed, for smoothness, consistency and compatability with the floating criterion and the grounding locations to form the current 20 km gridded data set.
The major new development in the model as described by Reference Budd and Jenssen Budd and Jenssen (1989) has been the addition of an explicit formulation for the ice shelves, taking account of transverse and longitudinal stresses as well as free-floating strain rate and calving at the front. The ice-shelf model is efficient to compute, it gives a close representation of the present ice-shelf flow regime and, as part of the ice-sheet model, allows the rapid simulation of the growth of the ice sheet and the ice shelves to equilibrium from initially no ice conditions.
The aim of the project reported here is to use the model to simulate the present state of the ice sheet and ice shelves, taking account of the past history, and then to compute the likely future behaviour, particularly over the next 100–500 years. This then takes account of the natural rates of change, plus the impact from the expected global warming, in order to estimate the expected influences on sea level.
For the specification of future warming conditions, the results from global General Circulation Models are used to derive changes in the net surface mass balance and the basal melting beneath floating ice as the primary forcing for the ice sheet and ice shelves.
2. Major problems in establishing the basic state for present and future predictions
The future behaviour of the Antarctic ice sheet is greatly dependent on the changes in past climatic forcing as well as the future changes. In particular, the large global changes which took place at the end of the last ice age impacted on the Antarctic ice sheet primarily through changes in the accumulation rate and to sea level. Modelling sensitivity studies show that, although the coastal regions of Antarctica generally respond more quickly than the interior, the reaction at the coast may still be taking place even 5000–10000 years after the imposed changes. The interior takes several tens of thousands of years to approach a new equilibrium from the accumulation change. The deep-ice temperature regime responds even more slowly. Near the coast, the bedrock isostatic response gives a delayed uplift rate continuing well after the ice thinning and retreat. The current state of the ice sheet, particularly in the marginal regions, is found to be very sensitive to the timing and magnitudes of these large past changes. Consequently, the uncertainties in our knowledge of the present state of balance, and the past history of the changes, adds to the uncertainty in the results of simulations of the future changes.
The remaining problems needing emphasis here concern the uncertainties in the future climatic forcing. These uncertainties relate first to the possible changes in anthropogenic fossil-fuel usage and, secondly, to the way in which the global climatic system responds to changes such as the increase in greenhouse gases. These uncertainties involve the magnitudes of the future changes as well as the timing of their rates of development. Consequently, here we deal only with sensitivity studies to a range of gross long-term changes to cover the variety of possible foreings which could he expected over the next century or longer. As a guide to these expected changes, the results of GCM studies for the equivalent of 2 × CO2 and 4 × CO2 will be used with an expected linear progression from the present to 2 × CO2 by the middle of the next century and continuing at a reduced rate further on.
3. Ice-sheet-ice-shelf model
The basic ice-sheet model is a development from the dynamic, thermodynamic model described by Reference Budd and JenssenBudd and Jenssen (1989). Only a few of the more important points are emphasized here. For grounded ice with 20 km or more horizontal resolution and small surface slopes, it is assumed that the dominant stress governing the flow is the basal shear stress:

where ρ is the average ice density, g is the gravitational acceleration and the surface slope α and ice thickness Z are averaged over the 20 km scale. This tacitly assumes that, over the grounded ice, the net effects of transverse and longitudinal stresses at these scales arc negligible. For the floating ice, the basal shear stress is negligible and the flow is controlled by the longitudinal and transverse stresses. Consequently, the horizontal strain rates for the grounded ice flow are continually monitored to check that these other stresses are negligible, as discussed by Reference Budd, MeInnes, Jenssen, Smith, Van der Veen and OerlemansBudd and others (1987). This ensures a smooth transition from grounded ice-stream flow to floating ice shelf flow.
For the grounded ice, the equations for internal deformation (horizontal shear) and temperature are solved simultaneously for each column along the lines given by Reference Budd and JenssenBudd and Jenssen (1989). The present runs use 30 points in the vertical. The continuity equation is solved using a staggered grid over the domain. A detailed account of the procedure, including the computer routines, has been documented by Reference MavrakisMavrakis (1993).
The floating criterion for ice of elevation E and critical thickness Z c is given by

where ρ i is the density of ice, ρ w is the density of sea water and p is an increment of thickness to take account of the lower density of the surface firn (p ≈ 20 m).
For grounded ice, with the bed below sea level, the ice thickness above bouyancy Z
* is the thickness in excess of the floating condition This thickness above bouyancy is used in the relation for basal sliding velocity

where k 2, a 1, a 2, v are constants and θ is the basal temperature relative to pressure-melting point. For the present runs, the basic values of the constants are as follows: k 2 = 1.5 × 10⁸ m3 a 1 bar -1, a 1 = (50 m)2, a 2 = 3.5 km 1, v = 0.2°C-1.
The basal temperatures and melt rates are computed from the thermodynamics but the meltwater flow is not normally treated within the model. A separate routine can be used for studying the large-scale average meltwater flux as given by Reference Budd, Jenssen, Van der Veen and OerlemansBudd and Jenssen (1987).
Ice-shelf flow
The ice-shelf formulation is the main new addition to the model of Reference Budd and JenssenBudd and Jenssen (1989). Space allows only a brief outline of the scheme here. A comprehensive description has been given by Reference MavrakisMavrakis (1993). The main principles are as follows. The program locates grounded and floating points from the floating criterion. Grounded-ice velocities are computed from the sliding and deformation relations. For the floating ice, it is assumed that ice flow is directed down ice-thickness gradients (or elevation gradients) towards an edge for which a calving criterion applies. For unobstructed ice, inward from the floating edge, the free-floating ice-shelf strain rate applies (Weertman creep). It is assumed that the shear stress decreases with distance from an obstruction. This allows the locus of minimum transverse shear strain rate and maximum velocities to be computed. Shear strain rates are computed with increasing transverse stress towards the obstructions. The velocities are then computed by integrating over the ice shelf from the known grounded points towards the free-calving boundaries
This scheme allows the ice shelves to grow or shrink, ground or float as obstructions appear or disappear. The ice-thickness changes and continuity ensure that the flow tends to move around obstacles and be directed towards a free edge.
At this stage, basal melt rates arc prescribed. For the present studies, to avoid problems with large episodic calving, a simple calving criterion dependent only on thickness has been used, together with a fractional grid-space edge position, beyond the last grid point. This gives a smooth gradual change in floating-ice area with time
4. Future climatic forcing
The impact of future warming on the Antarctic ice sheet is greatly dependent on the response of the sea ice, which strongly influences both the hydrological cycle and the ocean temperatures. An adequate treatment of the open-water fraction in the sea ice is important to simulate the changes in heat fluxes, evaporation and precipitation over the Antarctic ice sheet and the surrounding ocean (Reference Budd, Simmonds and WellerSimmonds and Budd, 1990; Reference Budd, Simmonds and WuBudd and others, 1991).
Some transient simulations for increasing CO2 warming, with coupled atmosphere-ocean models, have shown small changes in the Antarctic sea-ice zone relative to the results obtained from GCMs using only surface oceans for equilibrium simulations (Reference CubaschCubasch and others, 1991; Intergovernmental Panel on Climate Change, 1992; Reference Manabe, Spelman and StoufferManabe and others, 1992). These transient runs, however, have usually been for less than 100 years. Here we need to consider the increase in CO2 which has already taken place over the last century and the warming which continues for several hundred years into the future. The warming over these time-scales then relates more to the equilibrium results. The recent transient simulations extending to 500 years for 2 × CO2 and 4 × CO2 scenarios by Reference Manabe and StoufferManabe and Stouffer (1993) provide a firmer basis for the projected future warm conditions
Some detailed sensitivity changes of the response to both Antarctic sea-ice area changes and warming have been carried out by Reference Budd, Simmonds and WuSimmonds and Budd (1991). The impact on the Antarctic mass-balance changes was summarized by Reference Budd, Simmonds and WellerBudd and Simmonds (1991). Consideration of both precipitation and evaporation, under present-day conditions, compared to their changes under future warming, with reduced sea-ice extent, resulted in greater Antarctic net-accumulation changes than previously estimated. A summary of the results for changes or precipitation (P), evaporation (E) and the net (P-E) with increasing open-water fraction (W) and also for the effects of global warming (corresponding to effective 2 × CO2) for which the sea-ice area is reduced by about two-thirds, are given in Table 1. This table is revised from table 5 of Reference Budd, Simmonds and WellerBudd and Simmonds (1991) for which the complete results for the present conditions (W20), corresponding to a mean of 20% open-water fraction, were not available. The corresponding Antarctic temperature changes are shown in Table 2
Modelled changes to Antarctic precipitation (P), evaporation (E) and balance (P-E) for different percentage (i) open-water fractions (W i) and the proportional changes relative to the present (≈ W20). Also shown are the results for the warm (≈ 2 × CO2) - type scenario. Modified from Reference Budd, Simmonds and WellerBudd and Simmonds (1991)

Changes in mean surface temperature (Ts) and near-surface air temperature (Ta) for the Antarctic region as a function of open-water Faction (Wi for i %) and the WARM, scenario, relative to the present (W20), from the results of Reference Budd, Simmonds and WellerBudd and Simmonds (1991). Units °C

For the equivalent 2 × CO2 warming (WARM), the increases in P, E and P-E amount to 60%, 22% and 95%, respectively. These computed changes are high compared to some earlier estimates of accumulation-rate changes which were based on consideration of precipitation changes alone. The relatively large component of evaporation in the present budget, plus its smaller percentage increase, contributes to the larger proportional increase in P - E. A more comprehensive evaluation of the associated atmospheric circulation changes has been given by Reference Budd, Simmonds and WellerSimmonds and Budd (1991). For our sensitivity studies here, simulations were run with increased basal melting and with accumulation prescribed at: the present values, 50% increase and 100% increase.
For the case of the 2 × CO2 equivalent simulation of Reference Budd, Simmonds and WellerBudd and Simmonds (1991), the mean air-temperature changes are given in Table 2 for the global mean, the sea-ice zone and the Antarctic ice sheet. The summer temperature increases were much less (~3°C) and consequently only small increases in net melt run-off resulted, confined primarily to low-elevation slopes below a few hundred metres. This generally occurs in only part of the last grid interval for the steep coastal slopes or, in the case of the flat ice shelves, results in percolation and refreezing. Consequently, the net loss from surface melt was assumed to contribute a negligible fraction to the net-balance changes.
Basal melting
Increases in basal melting have been the primary cause of concern for the fate of the Antarctic ice shelves and the possible greatly increased ice-stream flow, particularly in West Antarctica. A rapid disappearance of the large ice shelves can lead to high strain rates and thinning rates near the grounding lines of the ice streams. Sensitivity studies of such thinning-rate changes were carried out by Reference Budd, MeInnes, Jenssen, Smith, Van der Veen and OerlemansBudd and others (1987). Here, with the ice shelves modelled explicitly, the basal melt rates become the primary forcing. A survey of present ice-shelf melt rates was given by Reference Budd, MeInnes, Jenssen, Smith, Van der Veen and OerlemansBudd and others (1987). There is still considerable uncertainty regarding melt-rate dependence on temperature, particularly regarding scale. Nevertheless, the laboratory studies of Reference Russell-HeadRussell-Head (1980) and the inferences made from icebergs by Reference Hamley and BuddHamley and Budd (1986) agree sufficiently well to provide a guide. Table 3 indicates the basis for the melt rates adopted here as a function of temperature above freezing. The melting (or freezing) under ice shelves depends also on the ocean dynamics. It is beyond the scope of this paper to address the current ocean dynamics or the expected future changes. Here we consider only the order of magnitudes to be expected from the ocean-temperature increases.
Melt rates (M) of fresh ice in ocean water as a function of temperature (T) and the temperature above freezing (∆T) (from Russ ell-Head, 1980)

The impact of the warming on the melting depends on the peak ocean warming during summer and the length of the period for which the water column, reaching below the ice shelf, stays significantly above freezing. The (WARM) run simulation of Reference Budd, Simmonds and WellerBudd and Simmonds (1991) corresponds to about 3°C ocean warming in summer with an open-water period extended from 3 to 7 months. Consequently, a possible melt rate of 10 m a-1 appears to be quite plausible.
Because of the uncertainties in the timing and magnitude of the future climatic warming, it is considered to be most appropriate to simulate the ice-sheet response to a range of increased melt rates, and accumulation rates, separately and in combination.
5. Sequence of modelling procedure
The model is first initialized with the present ice-thickness distribution to compare the computed velocities with observed velocities, over inland ice, outlet glaciers or ice streams and the ice shelves. The ice is then removed and the isostatic bed depression relaxed. The model is then run forward with the present accumulation (modified as a function of elevation) to reach an equilibrium state which can be compared with the present surface configuration. Sensitivity studies have been carried out for changes in accumulation, sea level and climatic temperatures. Surface temperatures are also a function of elevation relative to the present. It has been found from these tests that the present accumulation distribution leads to an equilibrium ice sheet that is too large. The use of a lower rate, more appropriate for the ice-age average (say about two-thirds of the present) gave an equilibrium closer to the present ice sheet. This type of result was found previously by Reference Budd and SmithBudd and Smith (1982) and also Reference HuybrechtsHuybrechts (1992). Sea-level lowcring allows the large ice shelves to ground and thicken and also the margins around the continent to extend. In fact, some offshore islands are only captured, and incorporated into the contiguous ice sheet, by sea-level lowering and then remain connected after sea-level rise.
Sensitivity to surface-temperature changes is relatively small. The accumulation and ice thickness changes have similar impacts on the deep temperatures. The uncertainty in the geothermal heat flux is the main factor controlling the uncertainty in the basal temperatures with sensitivity as shown by Reference Budd and JenssenBudd and Jenssen (1989) and Reference HuybrechtsHuybrechts (1992).
Finally, a series of runs through the last glacial cycle has been carried out, with prescribed accumulation and temperature variations derived from the Vostok records, and sea-level changes from the results of Reference Budd, Jenssen, Van der Veen and OerlemansBudd and others (l987). It was found from these runs that a reasonable match to the present ice-sheet configuration could be obtained. These results were not very sensitive to resolution and even with 100 km grid spacing the model generated a reasonable performance. The modeled present state, however, was very sensitive to the timing of the accumulation and sea-level changes. Similar results were obtained by Reference HuybrechtsHuybrechts (1992) with the modeled present still adjusting to the past changes. Consequently, for the simulations for the future, a number of runs have been carried out starting from different initial conditions for the present. These include: the present observed configuration, the modelled present, resulting from the ice-age cycle, and an equilibrium approximating the present. In each case, a base run was carried out simulating the continuation of the present climate into the future. Then a series of anomaly runs was carried out with prescribed accumulation or melt-rate changes. In general, it was found that the model deviations from the base runs did not depend strongly on the initial state. It is therefore these deviations associated with the prescribed changes which will be considered here.
Ice volume and changes (10 6 km3) from the model runs for melt rates 1, 3, 10 m a-1 (M1, M3, M10) and combined with double the present accumulation rate (M 1 + A, M3+ A, M10 + A) and also the associated contributions to sea-level change (m)

6. Results from simulations for future scenarios
Although occasional strong non-linearities in the ice-sheet response occur, the general results show smooth monotonic progression and additive responses to the imposed changes. Consequently, a summary is provided by the volume changes, relative to the base run, after 100years and 500 years for the model with the imposed changes in melt rate of 1, 3 and 10m a-1, and for accumulation rates of the present and double the present, as shown in Table 4. Sea level is only affected by changes in the grounded ice, so the table shows separately the floating, grounded and total ice-volume changes. More precisely the sea-level changes depend on the change in that fraction of the grounded ice above the floating level. The small changes dealt with here involve an almost constant fraction of the total for the melting and almost all of the gain for the addition of the accumulation. An approximate conversion to sea level may therefore be done relatively easily
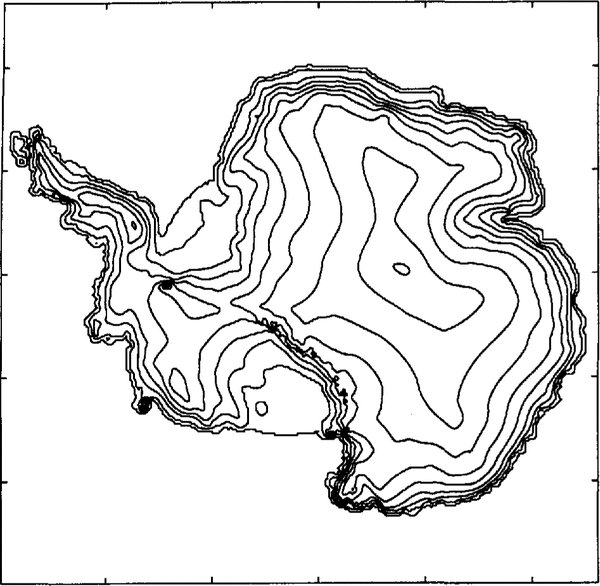
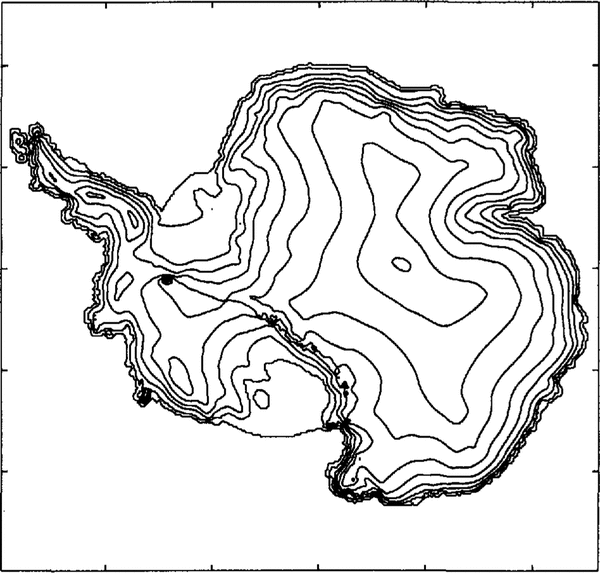
An indication of the changes in the appearance of the ice sheet after 500 years are shown in Figures 1–4for the cases of: the base run with the present climate, additional 10 m a1 melt (M10), double the accumulation (+ A) and the combination of these two (M10 + A), respectively. Sensitivity studies have shown that these results are not very dependent on the resolution or the inclusion of the thermodynamics, or a small feed-back of sea-level change. Preservation of the Amery Ice Shelf, however, appears to require the addition of the basal growth for the present, as found from the observations
Base simulation for 500 years with the present climate. Surface elevations with smooth contours at 0, 100, 500 m and subsequent 500 m intervals show little change from the present.

Simulation for 500 years with additional 10 m a1 basal melt. The same elevation contours show little change inland but drastic reductions of the ice shelves occur.

Simulation for 500 years with increased accumulation to double the present. The ice shelves advance and elevation increases inland, particularly in West Antarctica.

Simulation for 500 years with combined increased melt (10 m a-1) and double the accumulation. The ice shelves are still greatly reduced but thickness inland increases.

For the case of 1 m a1 increased melt, relatively little change takes place for the first 100 years, but by 500 years there is a substantial reduction in the ice shelves and a similar volume loss from the grounded ice by increased flow and grounding-line retreat. For the 10 m a-1 case, this volume of loss occurs in the first 100 years as the ice shelves largely disappear. The rate of loss reduces over 500 years as the slow approach towards the new equilibrium starts to set in.
The effect of increased accumulation, to double the present, practically just offsets the loss from grounded ice in the first 100 years of the 10 m a-1 case without having significant impact on the ice-shelf loss. Smaller accumulation increases give approximately proportionally reduced responses.
By 500 years, the gain from the increased accumulation more than completely reverses the loss from the 10 m a-1 melt rate to an even larger gain for the grounded ice. The corresponding impact on the contribution to sea-level change is larger still, because of the relatively different fractions of above-floating-volume change for the gain and loss. By 500 years, the reduced ice shelves are close to stationary and the rate of accumulation on the grounded ice about half compensated by the increased flux at the grounding line.
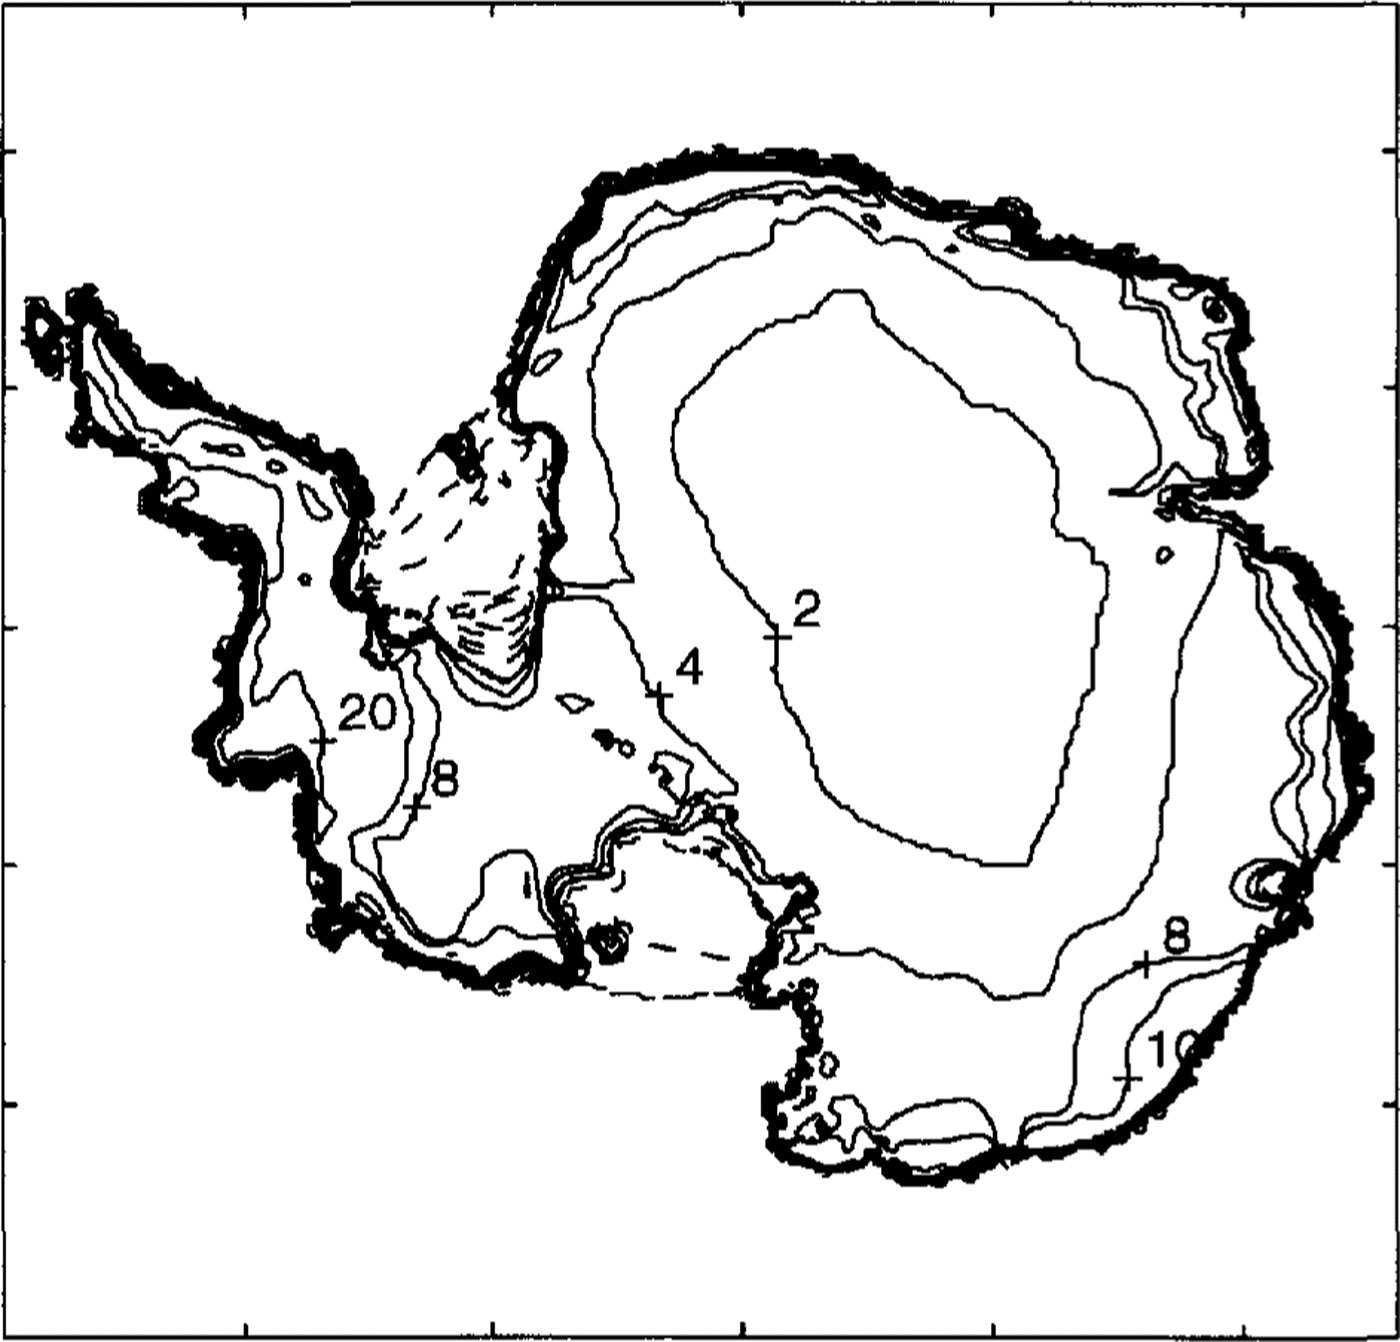
The figures show that for the high-melt case the large ice shelves almost completely disappear. By contrast, the increased accumulation in the absence of extra melting causes the ice shelves to thicken and advance beyond their present edge positions. In addition, it can be seen that the elevations inland increase, particularly from the contours in West Antarctica. The increase in ice thickness in the interior is approximately proportional to the accumulation rate but this is somewhat reduced near the outlet ice streams due to increased ice flow. For the combined high melt plus accumulation (M10 + A), the ice shelves still largely disappear but the inland ice surface rises, tending to a new equilibrium of a thicker but reduced-area ice sheet, as shown in Figure 4 with the difference from the base run shown in Figure 5.
7. Implications for sea-level change
A summary of the implied contributions to sea-level change from the various runs is also shown in Table 4. The grounded-ice-volume change contributes to sea-level change but only by that fraction above floating. For the relatively small losses here, from melt and retreat, this traction averages about 0.5. For the accumulation gains it is closer to 0.9. For the high melt rate (M10) the positive sea-level changes, of 0.36 m after 100 years and 0.63 m by 500 years, are not unlike the results obtained by Reference Budd, MeInnes, Jenssen, Smith, Van der Veen and OerlemansBudd and others (1987) for the 0.01-0.05% a-1 thinning rates. The addition of the increased accumulation, however, changes those results to about zero after 100 years and 1.2 m by 500 years. During the early stages, the changes are almost directly proportional to the prescribed forcing and the time. This means that intermediate forcing and responses can be approximately estimated by interpolation. With the gradual growth of accumulation rate along with melt rates, due to warming, the net effects for the first century could be expected to be rather small. In the longer term, the gain in accumulation over loss may be able to provide some offset to the sea-level rise expected from thermal expansion.
8. Conclusions
The impact of global warming on the Antarctic can be expected to cause large decreases in the ice shelves but have little impact on the grounded-ice volume or sea level over the shorter term of about 100 years. In the longer term, over 500 years, the increased accumulation may contribute to sea-level lowering, partly reducing the impact of ocean thermal expansion. The sensitivity studies here suggest that the ice-sheet model results are fairly robust. Nevertheless, more comprehensive observational data sets are required to provide better validation of the model simulations of the present regime, particularly the flow of the large ice streams, and the current state of balance
The dominant uncertainties for future conditions still rest largely on the uncertainties in the climatic forcing. Fully coupled atmosphere, sea-ice and ocean models, with high resolution around the Antarctic continental shelf, will be needed to derive the present heat and mass transfers well, before too much reliance can be placed on the simulations of the future scenarios. In the interim, sensitivity studies with the ice-sheet models for a wide range of climatic conditions can provide a useful guide to possible Antarctic mass-balance changes and the effects on sea level