I. INTRODUCTION
Thermoelectric (TE) materials are becoming increasingly important in the search for alternative sources for energy harvesting and conversion. Bi2Te3-based alloys are commonly accepted to be the best thermoelectric materials for near-room-temperature applications due to their high figure of merit.Reference Tritt and Subramanian1–Reference Yamashita, Tomiyoshi and Makita3 Recently, the figure of merit in a p-type (Bi0.25Sb0.75)2Te3 bulk alloy was further improved with an approximate 40% increase of its peak value at 373 K by hot pressing mechanically milled nm-scale powder.Reference Poudel, Hao, Ma, Lan, Minnich, Yu, Yan, Wang, Muto, Vashaee, Chen, Liu, Dresselhaus, Chen and Ren4 Electrical transport measurements and microstructural observations show that the ZT improvement is attributed to low thermal conductivity caused by increased phonon scattering by grain boundaries and defects. This discovery validates the nanocomposite approach in developing high performance low-cost bulk thermoelectric materials.Reference Dresselhaus, Chen, Tang, Yang, Lee, Wang, Ren, Fleurial and Gogna5 The efficiency of a thermoelectric device is determined by the materials’ dimensionless figure of merit, defined as ZT = S 2T/(ρκ), where S is the Seebeck coefficient, ρ is the electrical resistivity, and κ is the thermal conductivity. Due to the interdependence of the various thermoelectric parameters, a viable strategy for maximizing ZT is first to maximize the power factor (S 2T/ρ), for example, via tailoring the chemistry by doping, and then to minimize the lattice thermal conductivity by increasing the degree of phonon scattering. By incorporating the concept of a nanostructured material, a composite system has the theoretical potential to benefit from both quantum confinement effects and grain boundary scattering of phonons, resulting in enhanced thermopower and lowered thermal conductivity, respectively. Therefore, it is of interest to study the nanoscale size effects on the transport properties of the Bi2Te3 system.
The Bi2Te3 alloys have a rhombohedral structure, with space group R3m. They are composed of atomic layers in the order of -Te(1)-Bi-Te(2)-Bi-Te(1)- along the c-axis. The Bi-Te(1) and Bi-Te(2) are mainly covalent, while the bonding between Te(1)-Te(1) layers is due to van der Waals interactions. The van der Waals interaction leads to materials being easily cleaved along the basal plane. Consequently, the conventional synthesis methods of zone melting, Bridgman and Czochralsky techniques,Reference Scherrer, Scherrer and Rowe2 or powder metallurgy techniques such as hot extrusionReference Park, Seo, Cho, Choi and Lee6 result in materials with good thermoelectric performance but poor mechanical properties along the crystal-growth or extrusion direction (parallel to the cleavage plane).Reference Yamashita, Tomiyoshi and Makita3, Reference Perrin, Chitroub, Scherrer and Scherrer7 The low mechanical strength, that is, low hardness and easy cleavage, often causes difficulties in fabrication and mechanical handling, especially for application in miniature thermoelectric modules. Spark plasma sintering (SPS) is a novel technique to produce nanostructured materials providing rapid densification during powder sintering with minimal grain growth (i.e., a few minutes at the sintering temperature).Reference Munir, Anselmi-Tamburini and Ohyanagi8, Reference Mukhopadhyay and Basu9 SPS is a pressure-assisted sintering method while applying high frequency ON-OFF DC pulsed current (~3 ms/pulse). It has been suggested that a discharge plasma is momentarily generated in the gaps between powder materials, causing the cleaning of the powder surface and promoting mass transport to physically contact regions between particles.Reference Omori10, Reference Mamedov11 Joule heating is also generated due to pulsed current flow, overheating areas with high electrical resistance while keeping the average sintering temperature comparably low.Reference Omori10, Reference Mamedov11 It has been reported that bulk nanostructured Bi2Te3-based materials consolidated by spark plasma sintering (SPS) not only exhibit improved thermoelectric performance, but also enhanced mechanical strength.Reference Zhao, Zhang, Li, Zhang and Liu12–Reference Fan, Yang, Chen, Yun, Zhu, Bao and Duan14 In addition, related studies reported that SPS sintering has the advantage of promoting the formation of c-axis texture along the loading direction exhibiting simultaneously a preferential thermoelectric and mechanical anisotropy that is not available in conventional powder metallurgy techniques such as hot extrusion.Reference Chen, Jiang, Shi, Nolas, Yang, Hogan and Johnson15 Despite these efforts, fundamental information on the correlation between microstructural evolution and thermoelectric properties of Bi2Te3-based alloys by SPS is limited, in part due to the lack of a direct comparison between the SPS consolidation behavior and thermoelectric properties using powders with different length scales. This study is undertaken as an effort to investigate the thermoelectric properties of Bi2Te3 with structural characteristics at the microscale and nanoscale level as well as the underlying electrical and thermal transport mechanisms.
II. EXPERIMENTS
A. Materials
The primary feedstock materials used in this study were pure Bi2Te3 powders (99.99%) with a nominal size of 100 μm supplied by Alfa Aesar (Ward Hill, MA) and powders with a nominal size of 10 μm supplied by Cerac Inc. (Milwaukee, WI). Nanostructured powders with a size of 200 nm were produced through the mechanical milling of the 10 μm powders using a planetary ball mill for 3 h. The milling was conducted using stainless steel vessels and tempered steel balls in a nitrogen glove box.
B. SPS consolidation
The SPS was conducted under an axial compressive pressure of 50 MPa at 673 K in an SPS-825S apparatus (SPS Syntex Inc., Kanagawa, Japan). The Bi2Te3 powder was loaded in a cylindrical graphite die with an inner diameter of 14 mm using two graphite plungers of the same size to seal the die on both ends and transfer the load during consolidation. The powder compact was first preheated to 373 K with an initial load of approximately 15 MPa in 4 min. The sintering pressure was increased to 50 MPa within 20 s after the temperature reached 363 K. The powder compact was then heated to 673 K with a ramping rate of 50 K/min and held for 3 min. Bulk disks with a thickness of 3 mm were produced from the 100 μm, 10 μm, and nanostructured powders and the samples thereafter were designated as BT3 (100 μm powder), BT10 (10 μm powder), and NBT20 (200 nm powder).
C. Material characterization
The microstructure of the Bi2Te3 alloys was characterized by x-ray diffraction (XRD), scanning electron microcopy (SEM), and backscattered electron imaging (BEI). The XRD were performed using a Scintag XDS 2000 instrument. The SEM and TEM observations were performed using JEOL 6400F (JEOL Ltd., Tokyo, Japan) at 15 KV and JEOL 2010F (JEOL Ltd., Tokyo, Japan) at 200 KV, respectively. The texture analysis was conducted by XRD and electron backscattered diffraction (EBSD) using JEOL SEM 5910 (JEOL Ltd., Tokyo, Japan) with an Oxford INCA (Oxford Instruments, Oxfordshire, UK) system.
The Seebeck coefficient, electrical resistance, thermal conductivity, and Hall effect were measured from 2 to 400 K using a physical property measurement system (PPMS, Quantum Design Inc., San Diego, CA). The Hall effect measurement was conducted by sweeping the magnetic field ±1 T at each temperature, and the carrier concentration was calculated from n = −1/R He where R H is the Hall coefficient and e is the electron charge. The Hall mobility was calculated on the basis of μ = 1/neρ, where ρ is the electrical resistivity.
III. RESULTS AND DISCUSSION
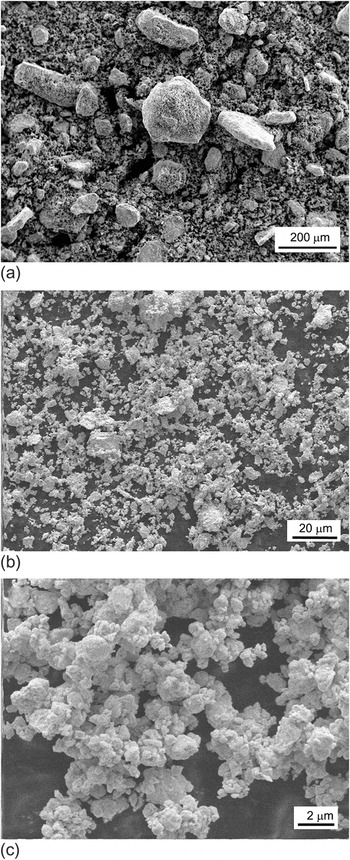
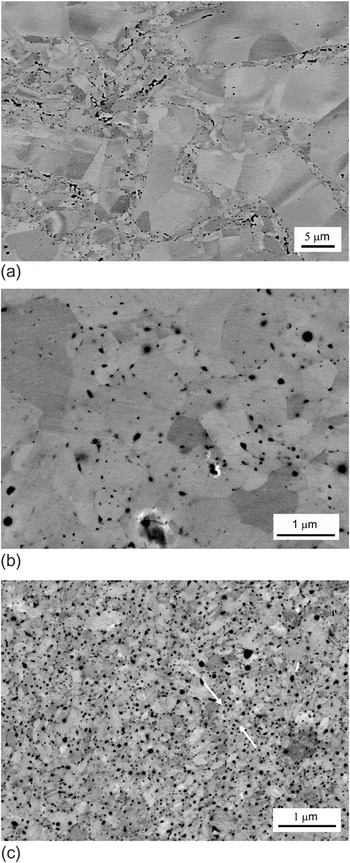
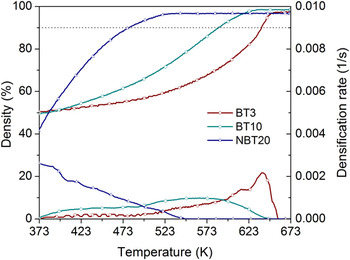
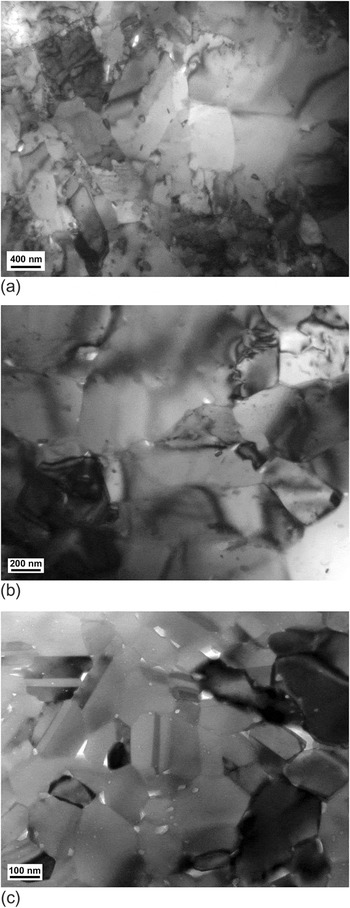
The typical particle size and morphology of the starting powders, 100 μm, 10 μm, and nanostructured powder aggregates are shown in Fig. 1. The powder with a nominal size of 100 μm ranged approximately from 10 to 200 μm [Fig. 1(a)] and the powder with a nominal size of 10 μm varied approximately from 1 to 20 μm [Fig. 1(b)]. The nanostructured powder [Fig. 1(c)] was produced by mechanical milling the 10 μm powder for 3 h and the aggregate size of the nanostructured Bi2Te3 powders was about 0.2–2 μm. Figure 2 shows the back scattered electron images (BEI) of the Bi2Te3 bulk, sintered from the 100 μm, 10 μm, and nanostructured powders, and designated as BT3, BT10, and NBT20, respectively, indicating clearly a grain size refinement with powder size reduction. The average grain size of the SPS bulk samples BT3, BT10, and NBT20 was measured to be approximately 5 μm, 1 μm, and 200 nm, as listed in Table I. By comparing these measurements to the particle size distribution of the starting powders, it is possible to note that the grain size in the bulk samples depends closely on the starting powder particle sizes, and this is attributed to the rapid sintering process of SPS. As shown in Fig. 2(a), sample BT3 exhibited a heterogeneous microstructure with some fine-grained (1–2 μm) regions dispersed in coarse grained (>~5 μm) regions. In sample BT10 [Fig. 2(b)], the microstructure was less heterogeneous, with a few coarse grains (>~2 μm) distributed in the fine-grained (~1 μm) matrix. Sample NBT20 showed a uniform microstructure with a grain size of approximately 200 nm, as shown in Fig. 2(c). Meanwhile, sample NBT20 showed significantly higher nanoscale porosity (i.e., the dark spheroid) compared to samples BT3 and BT10. To provide insight into the mechanisms that govern pore formation, the relative density of the powder compact of the samples BT3, BT10, and NBT20 was determined from the ramhead displacement and plotted against temperature during the heating stage as shown in Figure 3. The initial packing density for both the μm-scale powders BT3 and BT10 was approximately 50% whereas the initial packing density for the nm-scale powder NBT20 was approximately 42%. The random dense packing density of spherical particles was in the range of 56–64%Reference Swinkels and Ashby16; therefore, during the initial consolidation stage (relative density <90%), the densification process involves powder particle rearrangement, neck formation, and pore transition from cusp shape to spheroid shape. With the relative density increasing (>64%) and temperature rise (i.e., yield stress decreasing), localized deformation near the contact region becomes the dominant densification mechanisms as a result of the localized heating caused by the pulsed current. When the relative density becomes higher than 90%, pore enclosure and speroidization occurs,Reference Atkinson and Davies17, Reference Arzt, Ashby and Easterling18 and different densification mechanisms such as grain-boundary diffusion and power-law creep take over,Reference Olevsky, Kandukuri and Froyen19 as evidenced by the peak densification rate around 90% relative density for the compact BT3 and BT10. However, in the case of the compact NBT20, the densification curve did not follow this trend: the densification rate decreased monotonically and pore enclosure and spheroidization occurred much earlier (lower temperature) driven by the high surface energy (surface curvature) associated with the nm-scale particles. Accordingly, the high porosity in NBT20 may be attributed to early pore enclosure and limited sintering time for void removal through the rate controlling mechanisms such as power law creep and grain boundary diffusion or the Ludwig–Soret effectReference Olevsky and Froyen20 of thermal diffusion in which pores may serve as vacancy sinks that impede densification in the final densification state as a consequence of the local Joule heating effect of SPS. Note that the pore size in sample NBT20 [Fig. 2(c)] was homogeneous, as opposed to conventional sintering, in which a large pore grows at the expense of small ones. This is in agreement with observations by Stanciu et al.,Reference Stanciu, Kodash and Groza21 where the authors attributed the homogeneity to the interaction of pores and an electrical density and temperature gradient that led to vacancy diffusion. In the Stanciu et al. framework,Reference Stanciu, Kodash and Groza21 vacancy diffusion occurred from large to small pores and resulted in overall reduced pore size. Careful examination of the nanopore distribution revealed that the nanopores were not completely randomly distributed, but preferentially oriented perpendicular to the loading direction [marked by arrows in Fig. 2(c)], and this will be discussed further in a subsequent section. The TEM images of the samples BT3, BT10, and NBT20 are shown in Fig. 4. Dislocations were present in sample BT3, but not in samples BT10 and NBT20. Note that even in the fine-grained regions in samples BT3 and BT10 where the grain size is comparable to that in sample NBT20, the porosity level is much less than in sample NBT20. It should be pointed out that the TEM observation confirms that the dark spheroids in Fig. 2 correspond to nanopores and that any possible phase contrast resulting from oxides or other impurities that typically form during milling may be excluded.
SEM image of Bi2Te3 powders with different size distributions: (a) 10–200 μm, (b) 1–20 μm, and (c) 0.2–2 μm.

BEI images of Bi2Te3 samples with different grain sizes prepared using spark plasma sintering: (a) BT3, (b) BT10, and (c) NBT20. The dark spheroids in the image reveal the pores in the sample.

The densification curves of Bi2Te3 powder compacts.

TEM bright-field image of bulk nanostructured Bi2Te3 alloy: (a) BT3, (b) BT10, and (c) NBT20.

Grain size, porosity, and texture of Bi2Te3 samples.

a Determined from image analysis.
b Determined from Archimedes’ method with a theoretical density of 7.86 g/cm3.
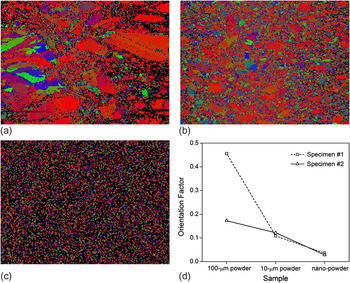
The grain orientation of the sintered Bi2Te3 disks measured perpendicular to the loading direction is shown in Fig. 5. The coarse-grained BT3 and BT10 exhibit a preferred orientation of (0 0 l) whereas the fine-grained areas were nearly isotropic. In the nanostructured sample NBT20, no apparent preferred orientation was observed. The variation of c axis textures is in agreement with the XRD results that were obtained on the basis of the Lotgering method,Reference Lotgering22

Texture in bulk Bi2Te3 samples prepared using spark plasma sintering: (a) BT3, (b) BT10, (c) NBT20, and (4) XRD orientation factor.

where P and P 0 are the ratios of the integrated intensities of all (0 0 l) planes to those of all (h k l) planes for the preferentially oriented and randomly oriented samples, respectively. For each SPS sintered sample, two specimens sectioned from different positions were measured. The orientation factors F of the (0 0 l) planes of the BT3 samples were calculated to be 0.18 and 0.46 for the two different samples, implying that the BT3 samples had a heterogeneous microstructure. This is consistent with the observation from EBSD images that the (0 0 l) texture had a preferred orientation in the loading direction, thought only for large particles. The orientation factors F for the BT10 samples were calculated to be 0.11 and 0.12, and the orientation factors for the NBT20 samples were 0.028 and 0.036. It was suggested that the preferential orientation formation was mainly attributed to the lamellar crystal structure and the weak van der Waals bonding between Te(1) and Te(1).Reference Fan, Yang, Chen, Yun, Zhu, Bao and Duan14 The particles with basal planes bonded by the van der Waals force would rotate perpendicular to the pressing direction and the rotation was further promoted by the pulse current under a high electric field. However, such a mechanism contradicts the observation that the orientation factor increases with increasing particle size but did not depend on the sintering temperature.Reference Chen, Jiang, Shi, Nolas, Yang, Hogan and Johnson15 Therefore, the preferred orientation might simply result from a geometrical effect; that is, particles with large size have a platelet geometry (with the c axis perpendicular to the platelet) and these platelet shaped particles tend to stack aligned in the direction of the SPS loading direction.
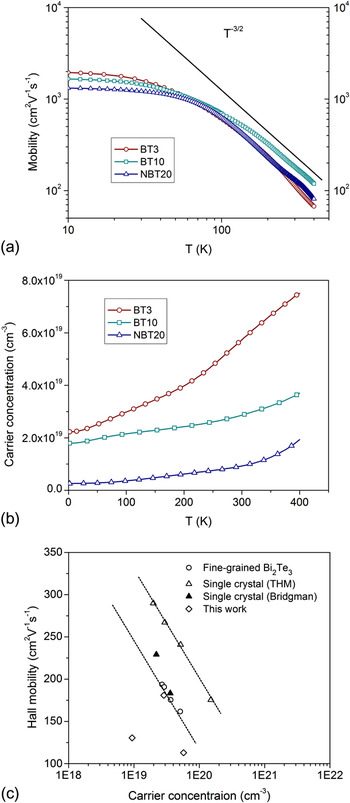
Figure 6(a) shows the temperature dependence of the Hall mobility of the Bi2Te3 disks measured in the radial direction (hereafter designated as the in-plane direction). All the samples had n-type properties. Above 100 K, the mobility varies following ~T –3/2, indicating that the predominant scattering mechanism was acoustic phonon scattering. At low temperatures, in which phonon scattering becomes insignificant (<~100 K), the mobility shows a plateau with respect to temperature. The factors that affect the mobility could include grain boundary scattering,Reference Gothard, Ji, He and Tritta23, Reference Martin, Wang, Chen and Nolas24 impurity scattering,Reference Martin, Wang, Chen and Nolas24, Reference Seeger25 and/or dislocation scattering.Reference Seeger25 Further, the mobility showed a plateau below 100 K and did not follow a temperature dependence of T 3/2, which suggests that impurity scattering was not the primary carrier scattering mechanism. Dislocation scattering appeared to be operative in sample BT3, as shown in Fig. 4(a). The mobilities of samples BT10 and NBT20 were lower than for sample BT3, suggesting that boundary scattering of charge carriers is a dominant scattering mechanism below 100 K. Figure 6(b) gives carrier concentration as a function of temperature and shows that carrier concentration decreases with decreasing average grain size D. A similar trend was observed by Kim et al.Reference Kim and Mitani26 in fine-grained n-type Bi2Te3, where it was suggested that grain boundaries played the role of acceptors. In Bi2Te3 alloys, the carrier concentration is also sensitive to lattice defects. Navr'atil et al.Reference Navratil, Stary and Plechacek27 have proposed that Te vacancies,  , are generated by mechanical grinding, which causes mechanical deformation of the cleavage slip type due to weak van der Waals bonding between Te(1)–Te(1) layers. During SPS sintering, the Bi atoms may enter into Te vacancies. Holes, h• may be thus created by the generation of the antisite defects
 because of the small difference in electronegativity between Bi and Te (χ = 0.3).Reference Horak, Cermak and Koudelka28 Miller and LiReference Miller and Li29 demonstrated the existence of antisite defects
 in Bi2Te3 through density measurements and calculated the formation energy of lattice defects. The decrease in carrier concentration thus might be attributed to the increase in hole concentration described as

Temperature dependence of (a) Hall mobility and (b) carrier concentration. (c) Hall mobility as a function of carrier concentration.

Other studies reported that the n-type carrier concentration was reduced from 6.1 × 10¹⁹/cm3 to 0.6 × 10¹⁹/cm3 by raising the SPS temperature from 673 K to 723 K using mechanically milled Bi2Te3 powdersReference Zhao, Zhang, Li, Zhou and Liu30 and p-type carrier concentration increased in p-type (Bi0.25Sb0.75)2Te3 sintered at a temperature higher than 683 K.Reference Fan, Yang, Chen, Yun, Zhu, Bao and Duan14Figure 6(c) plots the variation of mobility versus carrier concentration in n-type Bi2Te3 compounds. Note that the mobility in the present study is significantly lower than the data by Kim et al.,Reference Kim and Mitani26 suggesting that the current samples yield additional scattering consistent with increased boundary scattering of electrons from nanopores. It should be pointed out that at high temperatures (>~100 K), the mobility of sample BT3 dropped quickly and became comparable to that of sample NBT20, although the former had a larger grain size. This was attributed to its high carrier concentrationReference Masetti, Severi and Solmi31 that increased quickly with temperature.
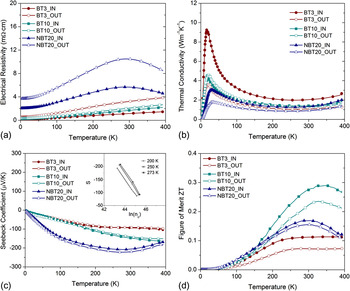
Figure 7(a) shows the temperature dependence of electrical resistivity for the Bi2Te3 samples measured both in the in-plane direction and the axial direction (hereafter designated as the out-plane direction). Samples BT3 and BT10 showed an increase in electrical resistivity with increasing temperature from 2 to 400 K, indicating metallic conduction. However, sample NBT20 encountered a maximum in electrical resistivity around 300 K before a decrease toward an intrinsic semiconductor behavior above 300 K. Compared to sample BT3, samples BT10 and NBT20 showed a more isotropic resistivity along the in-plane and out-plane directions. This is a result of the reduced c axis texture along the loading direction, as shown in Fig. 5. In the in-plane direction, the magnitude of electrical resistivity was in the following order: NBT20 > BT10 > BT3. The electrical resistivity is a function of carrier mobility μ and carrier concentration n, and is expressed by ρ = 1/(neμ). At a low magnetic field (1 T), it is reasonable to assume that the Hall mobility, μH, is equal to the carrier mobility μ.Reference Kim and Mitani26 Therefore, the variation of electrical resistivity among samples BT3, BT10, and NBT 20 in the in-plane direction can be explained by the Hall mobility data shown in Fig. 6. However, in the out-plane direction, the electrical resistivity of sample BT3 is larger than that of BT10, as will be discussed in the subsequent section, this was attributed to transport anisotropy due to the presence of texture in sample BT3.
Temperature dependence of (a) electrical resistivity, (b) thermal conductivity, (c) Seebeck coefficient, and (d) figure of merit ZT in Bi2Te3 samples prepared using spark plasma sintering.

Figure 7(b) shows the temperature dependence of thermal conductivity for the Bi2Te3 samples. In the direction parallel to the cleavage plane, the thermal conductivity for n-type Bi2Te3 single crystal by THM (traveling heater method) was found to vary between 2.0 and 3.3 W/Km.The lattice thermal conductivity was estimated to be 1.7 W/Km. At 300 K, the thermal conductivity of BT3 in the in-plane direction was measured at 2.0 W/Km, the thermal conductivity of BT10 and NBT20 was 1.4 and 1.3 W/Km, respectively, less than the lattice thermal conductivity of single crystal Bi2Te3 compound, suggesting phonon scattering by grain boundaries and nanopores. The electron thermal conductivity κE can be calculated from the electrical resistivity (ρ) according to the Wiedemann–Franz relation: κE = LT/ρ, where L is the Lorentz constant (L = 2.45 × 10⁻⁸ WΩ/K2). In the in-plane direction, the lattice thermal conductivity was hence estimated to be 0.97 Wm/K for BT10 and 1.2 Wm/K for NBT 20. Since an increase in ρ would result in a decrease in κE, the larger lattice thermal conductivity in sample NBT20 compared to sample BT10 was attributed to the slight grain elongation perpendicular to the loading direction; thus the nanopores had a higher chance to distribute in the in-plane direction.
Figure 7(c) shows plots the Seebeck coefficient against temperature. The Seebeck coefficient S can be expressed as S = k B/e [δ + C − ln nc], where e is the electronic charge, δ is the scattering parameter, and n c is the carrier concentration. From this equation, the Seebeck coefficient should be a linear function of ln(n c). The inset is a plot of S versus ln(n c), where the linearity in the high temperature regime suggests that the decrease of the Seebeck coefficient in the order NBT20 < BT10 < BT3 was due to the decrease in carrier concentration.
Figure 7(d) shows the temperature dependence of the figure-of-merit (ZT) of the Bi2Te3 alloys. In their study of the fine-grained n-type Bi2Te3 compound, Kim et al.Reference Kim and Mitani26 found that the figure of merit increased with decreasing average grain size. In the present study, the lower ZT values in sample NBT20 compared to sample BT10 suggest that nanopores increase the electrical resistivity more than they decrease the thermal conductivity. While nanopores adversely affected ZT in this study, He et al.Reference He, Hu, Tang, Lan, Yang, Wang, Ren, Hao and Chen32 studied the Co1–xNixSb3 system and found that pores greatly improve ZT depending on carrier concentration. They found that at low carrier concentrations, ZT is more sensitive to the presence of pores. Note that sample NBT20 had a low carrier concentration. Therefore it is possible for the nanopores to play a positive role in improving the ZT values by increasing the carrier concentration, which will be explored in a future study.
Above 300 K, thermal radiation often causes a slight increase in the lattice thermal conductivity. However, in sample NBT20, the low carrier concentration appeared to have caused the bipolar effect that increased the thermal conductivity. While the bipolar thermal conductivity is not as large at low temperatures, often it can be a significant contribution to the thermal conductivity at high temperatures. The bipolar effect is due to the fact that there are two types of carriers, electrons and holes. At high temperature, many electrons are thermally excited from the valence band to the conduction band, leaving behind an equal number of holes. The presence of these two types of carriers allows heat conduction to take place even if the net electrical current is zero. Furthermore, since electrons and holes have opposite charges, the Seebeck coefficient is significantly suppressed, as seen in Fig. 7(c). Thus, reducing the bipolar effect can improve the figure of merit in two ways. While many thermoelectric materials are usually so highly doped that the bipolar effect is not strong, in sample NBT20, the bipolar thermal conductivity is a significant component of the total thermal conductivity and the Seebeck coefficient was markedly reduced above 300 K. In related studies of a p-type BixSb2–xTe3 alloy, a reduced bipolar effect was observed, and modeling indicated that the electrons in the p-type BixSb2–xTe3 were more strongly scattered by the grain boundaries than the holes, resulting in a decreased electron contribution to the transport properties.Reference Minnich, Dresselhaus, Ren and Chen33 Therefore, the nanopores formed in the current study may represent a beneficial contribution in p-type Bi2Te3 materials.
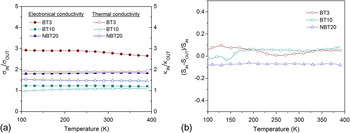
Figure 8(a) shows the anisotropic ratio of electron and thermal conductivity between the in-plane and out-plane directions. Theoretically, the anisotropic ratio for electron conductivity in the cleavage plane and perpendicular to the cleavage plane is predicted to be four, and the anisotropic ratio for thermal conductivity is two.Reference Fleurial, Gailliard, Triboulet, Scherrer and Scherrer34 Accordingly, there is a factor of two in figure of merit ZT between the direction parallel and perpendicular to the cleavage planes. As shown in Fig. 8, in sample BT3 the anisotropic ratio in electron conductivity (σIN/σOUT) is approximately three, and the anisotropic ratio in thermal conductivity (κIN/κOUT) is approximately two, resulting in an anisotropic figure of merit of approximately 1.5 between the two directions. The anisotropic ratio in figure of merit is approximately 1.2 in sample BT10 and approximately 1.1 in sample NBT20, suggesting a decrease of anisotropy in figure of merit with decreasing grain size, which is consistent with the grain orientation measurement in Fig. 2. It is worth noting that the ratio of (σIN/σOUT)/ (κIN/κOUT) in sample NBT20 is higher than that in sample BT10, opposite to the anisotropic figure of merit ratio between sample BT10 and NBT20. This is attributed to the opposite changes of Seebeck coefficient [i.e., change of sign in (S IN – S OUT)/S IN] between the two directions, as shown in Fig. 8(b). Therefore, the apparent higher anisotropy for electron and thermal conductivity in sample NBT20 than that in sample BT10 is a result of anisotropic distribution of nanopores rather than metallographic texture.
Anisotropy in Bi2Te3 prepared using spark plasma sintering: (a) electrical and thermal conductivity, (b) Seebeck coefficient.

IV. CONCLUSIONS
(1) The nanostructured Bi2Te3 showed insignificant c axis texture, in contrast to that in the coarse grained counterpart leading to anisotropic thermoelectric and transport properties.
(2) The thermal and electric conductivity both decreased with decreasing grain size in the bulk Bi2Te3 alloys synthesized using SPS. The samples with the smallest grain size consisted of many nanopores. These nanopores showed an orientation effect and this resulted in an anisotropic electrical and thermal conductivity in the SPS consolidated bulk samples.
(3) After mechanical milling, the carrier concentration in the nanostructured n-type Bi2Te3 was significantly decreased compared to the sample sintered using the as-received powders.
ACKNOWLEDGMENTS
This research was supported by Sandia National Laboratories under Contract No. 826008. Sandia National Laboratories is a multiprogram laboratory operated by Sandia Corporation, a Lockheed-Martin Company, for the United States Department of Energy.