I. INTRODUCTION
Er-doped LiNbO3 (Er:LN) is a promising substrate material for integrated optics because it combines laser properties of Er3+ with excellent electro-optic, acousto-optic, and nonlinear optical properties of LN. Over the past years, a family of Ti (vapor Zn)-diffused Er:LN waveguide lasers,Reference Brinkmann, Sohler and Suche1–Reference Das, Ricken, Quiring, Suche and Sohler5 amplifiers,Reference Huang and McCaughan6 and integrated devicesReference Becker, Oesselke, Pandavenes, Ricken, Rochhausen, Schreiberg, Sohler, Suche, Wessel, Balsamo, Montrosset and Sciancalepore7–Reference Cantelar, Torchia, Sanz-Garcia, Pernas, Lifante and Cussó9 have been demonstrated. However, the photorefractive effect not only affects the performances of these devices but also limits both the pumping and operating wavelengths and hence hinders further demonstration of more efficient or new devices such as 980-nm-pumped green upconversion and mid-infrared (2.7 μm, 4I13/2 ↔ 4I11/2) waveguide lasers and various quasi-phase-matching devices based on the concept of periodically poled LN waveguide. Although addition of >4.6 mol% MgO into growth melt can effectively suppress the photorefractive effect,Reference Bryan, Gerson and Tomaschke10 heavy MgO codoping causes difficulty in growing high optical–quality Er:Mg:LN single crystal while moderate MgO-doping cannot effectively suppress the photorefractive effect. In addition to the Mg2+, the In3+ dopant can also effectively suppress the photorefractive effect,Reference Volk and Rubinina11–Reference Kasemir, Betzler, Matzas, Tiegel, Wöhlecke, Rubinina and Volk13 and a lesser amount of dopants (>3.0 mol%) is required to prevent the photorefractive effect, making it possible to grow high optical quality Er–In-codoped LN single-crystal. Therefore, an Er:LN crystal codoped with >1.5 mol% In2O3 would be a promising substrate material for realization of optical-damage-resistant Ti (or Zn vapor)-diffused Er:LN active waveguide device. To achieve optimum performance of the active devices fabricated on such material, it is crucial to have the entire knowledge of the indium codoping effect on the spectroscopic properties of Er3+.
For the case of singly Er-doped and Mg–Er-codoped LN crystals, a large number of article have been published to report the optical, spectroscopic, and defect structure characteristics and the device fabrication and performance characterization. In contrast, less work has been done for the Er–In-codoped crystal. Only two relevant papers could be found in the earlier literatures as far as we know.Reference Zhen, Xu, Li and Xu14, Reference Sun, Yang, Li, Xu and Zhao15 In 2004, Zhen et al.Reference Zhen, Xu, Li and Xu14 first reported the growth and dopant segregation coefficient of the Er–In-codoped congruent crystals. These authors also studied the resistance to optical damage of the crystals by using the transmitted beam pattern–distortion method. The results show that a crystal codoped with 1.5 mol% In2O3 can withstand a 488 nm light intensity of 2.84 × 10⁵ W/cm2 without the optical damage being observed. In 2007, Sun et al.Reference Sun, Yang, Li, Xu and Zhao15 reported mainly the In-codoping effect on the transient behavior of Er3+ green upconversion emission of the crystals codoped with 0 and 1.5 mol% In2O3. Along with these earlier works, recently we have performed a Judd–Ofelt (J–O) spectroscopic study on the Er–In-codoped LN crystals grown from congruent melts containing 0.0/0.5, 0.5/0.5, and 1.0/0.5 mol%/mol% In2O3/Er2O3.Reference Zhang, Qi, Hua and Pun16 Besides the spectroscopic parameters related to the J–O analysis, the absorption and emission cross sections at the typical Er3+ transition wavelength regions of 0.53, 0.56, 0.66, 0.98, and 1.5 μm are also important spectroscopic parameters to be determined. Over the past years, much work on this subject has been done for the Er:LN single-crystalReference Huang, McCaughan and Gill17–Reference Dinand and Sohler20 or the Ti-diffused Er:LN strip waveguide.Reference Veasey, Gary, Amin and Aust21–Reference Rebolledo, Vallés and Setién25 For the Er–In-codoped LN crystal, however, the relevant study could not be found yet. In this study, we report polarized emission and absorption cross section spectra at all the above-mentioned typical transition wavelength regions of Er3+ ions in the Er–In-codoped LN crystals, on which we have done the J–O study. As mentioned earlier, the mid-infrared emission at 2.7 μm would enable to develop a commercially available 980-nm laser-diode-pumped mid-infrared coherent source, which may find wide uses in the fields of fiber testing,Reference Miyashita and Manabe26 high-resolution molecule analysis,Reference Hinkley, Nill, Blum and Walther27 and sensing of many atmospheric trace gases such as HF, CO2, CH4, NO, N2O, SO2, CO.Reference Petrov, Curl and Tittel28 Present study includes particularly the mid-infrared results. In addition, the lifetimes of the emissions at the 559, 673, 996, and 1530 nm wavelengths were also measured and used to evaluate nonradiative multiphonon relaxation rate.
II. EXPERIMENTAL DESCRIPTION
By using the Czochralski method, Er–In-codoped LN crystals used in this study were pulled in air from the congruent melts containing fixed 0.5 mol% Er2O3, while with varied In2O3 concentrations of 0.5, 1.0, and 1.5 mol%. The raw materials used for the crystal growth, including Li2CO3, Nb2O5, In2O3, and Er2O3, have the same purity of 99.99% for the former three chemicals and the spectral purity for the Er2O3. The crystals were grown under the temperature gradient of 30–50 °C/cm, rotation rate of 20–25 rpm, and pulling speed of 0.5–1.0 mm/h. The crystals grown are clear, transparent, and crack-free. The plates used for this study were cut from the central part of the grown boules. The 0.5 mol% In2O3-doped plate was cut perpendicular to the y crystallographic axis and the other two were cut perpendicular to the ferroelectric z axis. Two surfaces of each plate were optically polished.
Visible, near-, and mid-infrared emission spectra were all measured by a HORIBA Jobin–Yvon Fluorolog-3 (Horiba Jobin-Yvon, Edison, NJ) double-grating-excitation spectrofluorometer equipped with a standard photomultiplier for visible, an NIR photomultiplier for near-infrared, and a PbS photodetector for mid-IR detection. A 450-W continuous xenon lamp was used as the excitation source. Except for the spectra of the emission at 0.98 μm, all spectra of the other emissions at 0.53, 0.56, 0.67, 1.53, and 2.7 μm were recorded under the excitation of 980 nm (∼20 mW). A couple of 1200 grooves/mm gratings blazed at the wavelength of 750 nm were used to disperse the excitation light. The visible, near-, and mid-infrared fluorescence was dispersed by a visible (1200 grooves/mm), near-infrared (600 grooves/mm), and mid-infrared (300 grooves/mm) grating, respectively. The 0.98-μm spectra were measured under the 657 nm excitation. In this case, another couple of 1200 grooves/mm gratings blazed at the wavelength of 330 nm were used to disperse the excitation light and the near-infrared grating (600 grooves/mm) to disperse the 0.98-μm fluorescence. The width of the exit slit was adjusted to give a spectral resolution of 1 nm for visible, 2 nm for near-infrared, and available maximum 65 nm for mid-infrared fluorescence measurements. Both the π- and σ-polarized spectra were recoded for all visible and near-infrared emissions, and the recording conditions under the two polarizations were identical for each sample. Because of the lack of a suitable polarizer for mid-infrared regime, only polarization-unresolved mid-infrared emission spectrum was recorded. For better detection of the relatively much weak mid-infrared emission, the excitation light was modulated at a frequency of 140 Hz and a standard lock-in amplifier was used. All spectra were recorded at room temperature.
The lifetimes of the emissions at 559, 673, 996, and 1530 nm wavelengths were also measured at room temperature. A flash xenon lamp with a pulse width of 3 μs was used as the excitation source. The 559 and 673 nm emission decays were measured by pumping the 2H11/2 (527 nm) or 4I11/2 (980 nm) level. The 996 and 1530 nm lifetimes were measured under the 657 and 980 nm excitations, respectively.
III. RESULTS AND DISCUSSION
Before the discussion on the emission and absorption cross sections, it is essential to give a brief description for the ability to resist the photorefractive damage and the dopant concentration in the crystals studied. It is well known that OH vibrational frequency is an effective identifier for judging an LN crystal being below or above the threshold concentration of photorefractive damage. For an undoped or slightly MgO-doped congruent LN crystal, the OH stretching vibration band usually peaks at about 3480 cm−1. As the MgO concentration in crystal is at or above the photorefractive damage threshold (∼5 mol% for the congruent LN), the OH vibration frequency converts to ∼3535 cm−1.10 Similar spectral features should be also true for the In2O3 doping case. The OH absorption studyReference Zhang, Qi, Hua and Pun16 has shown that the OH vibration frequency of the two lightly In2O3-doped crystals peaks at ∼3490 cm−1 and hence the two crystals are all below the photorefractive threshold. As the In2O3 doping level is increased to 1.5 mol%, the OH vibration frequency peaks at 3510 cm−1, suggesting that the 1.5 mol% In2O3-doped crystal is just above the photorefractive damage threshold concentration. Further study on the resistance to optical damage by observation for the transmitted beam pattern distortion characteristics shows that such a crystal can withstand a 488 nm light intensity of 2.84 × 10⁵ W/cm2 without the optical damage being observed.Reference Zhen, Xu, Li and Xu14 In contrast, the 0.5 and 1.0 mol% In2O3-doped crystals only withstand the light intensity of 0.78 × 10³ and 1.6 × 10³ W/cm2, respectively.Reference Zhen, Xu, Li and Xu14 The In and Er dopant concentrations in the crystals studied were determined by neutron activation analysis.Reference Zhang, Qi, Hua and Pun16 The results show that the Er concentration in crystal is 0.95 ± 0.04, 0.93 ± 0.04, and 0.92 ± 0.04 mol% for the growth melts containing 0.5, 1.0, and 1.5 mol% In2O3, respectively. The In concentration in the crystal is 1.20 ± 0.06, 1.91 ± 0.09, and 2.60 ± 0.10 mol%, respectively.
From the measured fluorescence spectra, the polarized visible, near-infrared, and unploarized mid-infrared Er3+ emission cross section spectra of the three crystals studied were determined at first. Then, the corresponding absorption cross section spectra were calculated on the basis of McCumber relation. It has been justifiedReference Pernas and Cantelar19, Reference Lazaro, Valles and Rebolledo22, Reference Rebolledo, Vallés and Setién25, Reference Miniscalco and Quimby29, Reference Martin and Quimby30 that the analysis based on the McCumber theoryReference McCumber31 predicts more accurate Er3+ cross section values than does the Ladenburg–Fuchtbauer relationship, which was developed from the Einstein relations.Reference Sandoe, Sarkies and Parke32 On the basis of the previous work extended from the McCumber theory,Reference Moulton33, Reference Eggleston, DeShazer and Kangas34 one can establish an adequate equation for the polarized emission cross section as a function of purely π- and σ-polarized emissions recorded in arbitrary units:

where σ ei (λ) (i = π, σ) is the emission cross section at the wavelength λ under the polarization i; c is the light velocity in the free space; the integral in the denominator is carried out over the whole emission band; ni (λ) is the refractive index; and Ii (λ) is the measured i-polarized fluorescence intensity under the polarization i. In Eq. (1), Arad represents the radiative transition rate between the two states involved. Its value, obtained from the J–O analysis,Reference Zhang, Qi, Hua and Pun16 is listed in Table I for convenience. It should be pointed out that for the two thermalized states, 2H11/2 and 4S3/2, A rad represents an effective radiative rate that can be evaluated according to Ref. Reference Lázaro, Vallés and Rebolledo23.
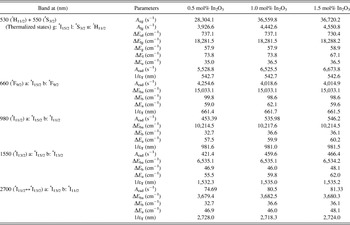
Input parameters for calculations of emission and absorption cross section spectra of Er3+ in Er–In-codoped LiNbO3 (LN) crystals.

The emission cross section σ e(λ) and the corresponding absorption cross section σ a(λ) is correlated by the McCumber relation:

where ν = c/λ, h is the Planck’s constant; ε T is the temperature-dependent excitation energy of the transition involved. It can be evaluated according to Refs. Reference Lazaro, Valles and Rebolledo22 and Reference Lázaro, Vallés and Rebolledo23. It is noted that for the two thermalized states, ε T denotes an effective excitation energy for the two thermalized manifolds. Since both the effective radiative rate A rad for the case of the transitions with regard to the two thermalized states and the ε T for all cases of visible and infrared transitions are related to the Er3+ electronic energy structure of the related manifolds, one needs at first to determine the necessary Er3+ electronic energy structure parameters. This can be done by analyzing the global fluorescence spectrum obtained by simply adding the π-polarized spectrum to twice the corresponding σ-polarized one and doing normalization.Reference Lázaro, Vallés and Rebolledo23 A method of 5% criterion in combination with identifying peaks related to extreme transitions of the involved band was utilized. A detailed analyzing procedure can be found in Refs. Reference Lazaro, Valles and Rebolledo22 and Reference Rebolledo, Vallés and Setién25. In the analysis, an assumption that each manifold involved has the equally spaced Stark splitting has been made. For the transitions concerning with the two thermalized states, five electronic energy parameters need to be determined that include the energy separation between the upper (u) or lower (l) manifold of the two thermalized states and the ground (g) manifold, named ΔE ug or ΔE lg, as well as the Stark splitting ΔEi (i = u, l, and g) of each manifold. For the other transitions, three parameters are necessary that include the energy separation between the related two manifolds, named ΔE ba, and the Stark splittings ΔE a and ΔE b. The results of the analysis are brought together in Table I. Based on the obtained electronic structure parameters, we further calculated the excitation energy, ε T. The results are listed in Table I in the form of ε T−1 (in unit of nm).
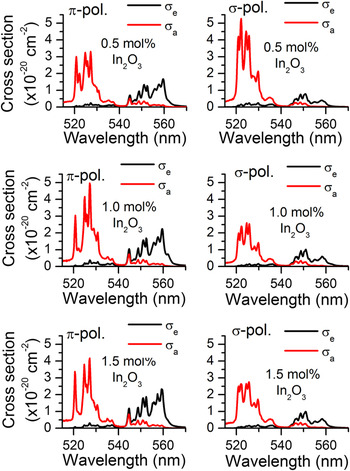
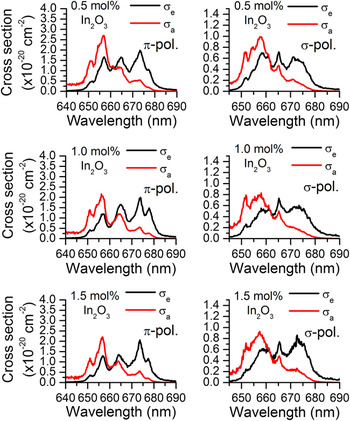
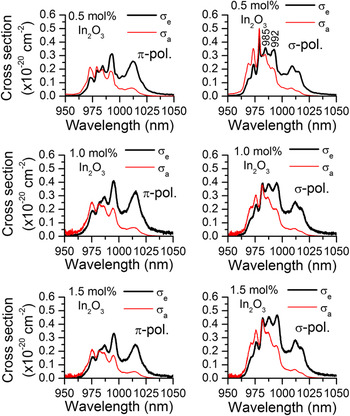
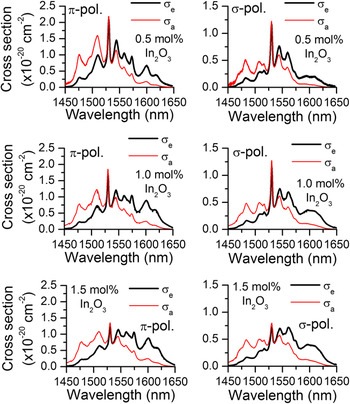
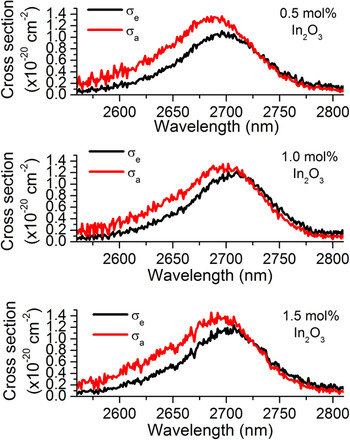
Figures 1–4 show the polarized green, red, and near-infrared emission (black color curve) and deduced absorption (red color curve) cross section spectra of the electronic transitions between the ground state 4I15/2 and the excited state 2H11/2, 4S3/2, 4F9/2, 4I11/2 and 4I13/2 of Er3+ ion in the three crystals studied. Figure 5 shows the unpolarized mid-infrared emission (black color curve) and deduced absorption (red color curve) cross section spectra involving the transition 4I11/2 ↔ 4I13/2.
Polarized green emission (black color curve) and deduced absorption (red color curve) cross section distributions of the electronic transitions 2H11/2 ↔ 4I15/2 and 4S3/2 ↔ 4I15/2 of Er3+ ion in Er–In-codoped LiNbO3 (LN) crystals.

At first, we pay attention to the In-codoping effect on the spectral shape and polarization dependence. A comparison with the polarization-resolved cross section spectra of the only Er-doped LN bulk material and/or the Ti-diffused Er:LN strip waveguide structureReference Huang, McCaughan and Gill17–Reference Rebolledo, Vallés and Setién25, Reference Amin, Dussardier, Schweizer and Hempstead35 reveals that codoping with indium definitely affects the spectral shape or the polarization dependence of some transitions. For example, in Fig. 1 the green absorption around 525 nm still shows the higher extent of σ-polarization for the lower In2O3 doping level of 0.5 mol%. However, as the In2O3 doping level is increased to 1.0 and 1.5 mol%, the absorption becomes highly π-polarized. In Figs. 3 and 4, as the crystal was codoped with more In2O3, the cross section relatively increases at the 985 and 992 nm wavelengths and relatively decreases at 1530 nm, consequently resulting in definite spectral shape change. On the other hand, in Fig. 2, the indium codoping affects neither the spectral shape nor the polarization dependence of the red emission and absorption cross sections.
Polarized red emission (black color curve) and deduced absorption (red color curve) cross section distributions of the electronic transition 4F9/2 ↔ 4I15/2 of Er3+ ion in Er–In-codoped LN crystals.

Polarized near-infrared emission (black color curve) and deduced absorption (red color curve) cross section distributions of the electronic transition 4I11/2 ↔ 4I15/2 of Er3+ ion in Er–In-codoped LN crystals.

Polarized near-infrared emission (black color curve) and deduced absorption (red color curve) cross section distributions of the electronic transition 4I13/2 ↔ 4I15/2 of Er3+ ion in Er–In-codoped LN crystals.

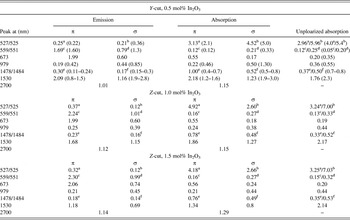
It is necessary to further quantitatively compare the cross section values of the studied crystals with those of only Er-doped LN bulk material and/or the Ti-diffused Er:LN waveguide structure. For the convenience of the reader, we bring together in the left part of Table II the polarization-resolved cross section values of the studied crystals at the typical wavelengths of 527 (π-polarized), 525 (σ-polarized), 559 (π), 551 (σ), 673 (π and σ), 979 (π and σ), 1478 (π), 1484 (σ), 1530 (π and σ), and 2,700 nm (unpolarized). Such choice for the reference wavelengths takes into consideration the polarization dependence of the emission and absorption at these wavelengths. The absorption at 527 and 1478 nm and the emission at 559 nm show higher extent of π-polarization, whereas the absorption at 525 and 1484 nm and the emission at 551 nm show higher extent of σ-polarization. For the comparison purposes, Table II brings together other two sets of cross section data. On the last column, we bring together the values (see the data outside the parentheses) of the polarization-unresolved absorption cross section obtained directly from the optical absorption measurements on the three crystals studied. We also bring together in the parentheses the cross section data reported for only Er-doped LN bulk material and/or the Ti-diffused Er:LN strip waveguide structure.Reference Huang, McCaughan and Gill17–Reference Rebolledo, Vallés and Setién25 Comparison of the three sets of cross section data shows that the polarization-resolved absorption cross section data of the Er-In-codoped crystals deduced from the corresponding emission cross section values are comparable to the unpolarized absorption cross section values directly obtained from the unpolarized absorption spectra. The In-codoping results in definite changes of both the emission and absorption cross section data. Some cross section values become larger while others become smaller. The change arising from the In-codoping can be as large as 2.3-fold. It can be further seen from Table II that both the emission and absorption cross sections with regard to the 4S3/2, 4F9/2, and 4I11/2 manifolds reveal a weak dependence on the In2O3 doping level, and the largest alteration from 0.5 mol% In2O3 doped crystal to the 1.0 or 1.5 mol% In2O3 doped crystal is no more than 25%. The unpolarized emission and absorption cross sections at the 2.7 μm band also show less effect of the In2O3 doping level as shown in Fig. 5. On the other hand, the cross section values concerning the 2H11/2 and 4I13/2 manifolds (see the cross section values at 525, 527, 1478, 1484, and 1530 nm) show considerable In2O3 doping–level effects, which are the further quantification for the above-mentioned In2O3 doping level effects on the spectral shape and polarization dependence. In particular, at the 1.5 μm region, where we are more interested, both the emission and absorption cross sections decreases with the increase of the In2O3 doping level. Under the π-/σ-polarization, the emission cross section decreases from 2.09/1.16 × 10-20 cm2 of the 0.5 mol% In2O3-doped crystal to 1.18/0.69 × 10-20 cm2 of the 1.5 mol% In2O3-doped crystal, and the absorption cross section decreases from 2.18/1.23 × 10-20 cm2 to 1.34/0.80 × 10-20 cm2. Nevertheless, for a given polarization, the difference between the absorption and emission cross section values, which determines the population inversion of the related amplification (laser) system, is not enlarged.
Unpolarized mid-infrared emission (black color curve) and deduced absorption (red color curve) cross section distributions of the intermediate electronic transition 4I11/2 ↔ 4I13/2 of Er3+ ion in Er–In-codoped LN crystals.

Emission and absorption ection values (×10−20 cm2) of the typical Er3+ transitions of the Er–In-codoped LN crystals.

Data given in the parentheses are values reported for congruent (Ti:) Er: LN crystal (strip waveguide).Reference Huang, McCaughan and Gill17–Reference Rebolledo, Vallés and Setién25
a Data at 527 nm.
b Data at 525 nm.
c Data at 559 nm.
d Data at 551 nm.
e Data at 1478 nm.
f Data at 1484 nm.
With regard to the In2O3 doping level effects on the emission and absorption cross sections there is an argument to be clarified. One can see from Table I that the transition from the 4I13/2 (or 2H11/2) manifold to the ground state has similar values of radiative rate A rad for 1.0 and 1.5 mol% In2O3-doped crystals. In principle, the 1.5-μm (or 530 nm) emission cross section spectra should be similar for the two crystals as the emission cross section is linearly proportional to A rad as shown by Eq. (1). However, the results are unexpected as described above. A quantitative check confirms that the emission cross section depends on not just the radiative transition rate. The spectral shape and polarization dependence of the measured emission spectra may also affect the emission cross section value through the normalized emission intensity factor [i.e., the ratio of the emission intensity to the spectral integral in Eq. (1)]. So, the observed In2O3 doping level effects on the cross section at 0.53 and 1.5 μm are, respectively, due to the change of the polarization dependence and spectral shape with the In2O3 doping level.
It is proposed, on the basis of the polarization dependence of the photorefractive-damage-resistant 1.5 mol% In2O3-doped crystal, that the 979 nm σ-polarization and 1484 nm π-polarization appear to be the preferred pumping schemes for the possible lasing and/or optical amplification at 559, 1530, and 2700 nm because the absorption cross section is highly σ-polarized at 979 nm, while highly π-polarized at 1484 nm as shown in Table II. The π-polarization is the preferred lasing scheme for both the 559 and 1530 nm lasing and/or optical amplification because the 559 and 1530 nm emission cross sections all show higher extent of π-polarization.
Next, let us focus our attention on the 2.7 μm emission, for which the commercial high-power 980-nm laser diode is the desired pump source. However, because of its weak emission intensity and the serious optical damage problem at the 980-nm pumping wave length, this emission has not received much attention in the past years. For an optical-damage-resistant Er:LN crystal, such as the 1.5 mol% In2O3-doped crystal studied here, which makes it possible to develop high-power 980-nm-laser-diode-pumped Ti:In:Er:LN mid-infrared waveguide laser operated at 2.7 μm, a study on the 2.7-μm emission characteristics is essential. However, the measurement of the 2.7-μm emission spectrum is not as easily as that of the visible and near-infrared spectra due to its weak emission intensity and the problem of the diffractions of various orders of harmonics of both the pump light and the excited various fluorescence. To solve the problems, two measures have been taken during our measurements. First, a special infrared filter with a cutoff wave length of 1 μm was used to block the visible fluorescence. Second, to obtain the stronger emission intensity, the spectral resolution was sacrificed. The exit slit was set at the permitted maximum width. The large exit slit width leads to a very low spectral resolution of 65 nm. As a result, the fine spectral structure could not be resolved as shown in Fig. 5. Nevertheless, it does not obstruct us in obtaining the peak emission and absorption cross section values, which we are more interested in. One can see from Table II or Fig. 5 that the unpolarized emission/absorption cross section has a peaking value of 1.01/1.15, 1.12/1.15, and 1.14/1.29 × 10−20 cm2 for the 0.5, 1.0, and 1.5 mol% In2O3-doped crystals, respectively, which show less effect of the In2O3 doping level.
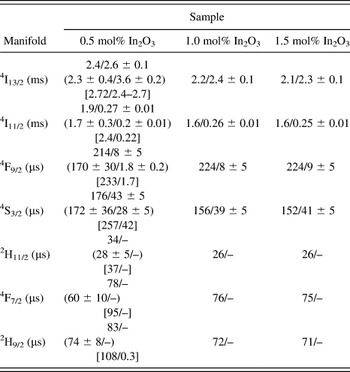
Table III brings together the J–O-predicted radiative (τ rad), taken from Ref. Reference Zhang, Qi, Hua and Pun16, and the measured fluorescent (τ f) lifetimes of Er3+ ion in the In-codoped crystals studied. For comparison, the theoretical/experimental values of the only Er-doped bulk material reported in Ref. Reference Amin, Dussardier, Schweizer and Hempstead35 and in Refs. Reference Núñez, Lifante and Cussó36–Reference Cantelar, Nevado, Martín, Sanz-García, Lifante, Cussó, Hernández and Pernas39 are given in parentheses and in brackets, respectively (see the second column). One can see that the radiative lifetimes of the considered transitions change slightly from the only Er-doped bulk crystal or waveguide structure to the Er–In-codoped crystal and reveal a weak dependence on the In2O3 doping level (comparing the data on the right two columns). The measured lifetimes show similar features except for the measured 673-nm lifetime values, which are given only as a reference because of the relatively short lifetime and the larger experimental error. The radiative quantum efficiency is evaluated as ∼100%, 15%, 4%, and 26% for the 1530, 996, 673, and 559 nm emissions of the Er–In-codoped crystals, respectively, which are the same as or slightly higher than those values of the only Er-doped bulk material or waveguide structure, ∼100%, 11%, 1%, and 16%, respectively. It is worthy to note that the 559-nm emission quantum efficiency increases by 10% compared to the only Er-doping case.
Calculated radiative (τrad)/measured (τf) fluorescent lifetime of Er3+ in Er–In-codoped LN crystals.

Data given in parentheses and in brackets are the theoretical/experimental values of congruent Er: LN reported in Ref. Reference Amin, Dussardier, Schweizer and Hempstead35 and Refs. Reference Núñez, Lifante and Cussó36–Reference Cantelar, Nevado, Martín, Sanz-García, Lifante, Cussó, Hernández and Pernas39, respectively.
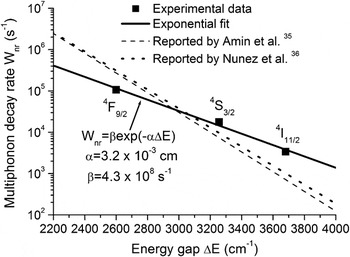
The reduced measured lifetime is presumably associated with the nonradiative multiphonon relaxation phenomenon. For the only Er-doped LN, the phenomenon has been studied by Amin et al.Reference Amin, Dussardier, Schweizer and Hempstead35 and Núñez et al.Reference Núñez, Lifante and Cussó36 According to the exponential energy gap law, the multiphonon relaxation rate W nr (= 1/τ f − 1/τ rad) can be expressed as

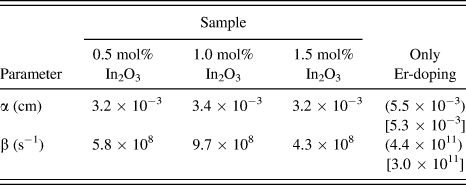
with α and β being the constants characteristic of the host material and ∆E being the energy gap between the excited state and the next lower-lying level. With the known multiphonon relaxation rate from the τ f and τ rad values of the excited states 4I11/2, 4F9/2, and 4S3/2, which have different energy gaps to their respective next lower-lying levels, we are able to plot the W nr against the energy gap ∆E in a semilogarithmic scale. From the plot we can obtain the parameter values of α and β, which may then be used to predict the nonradiative decay rates of other excited states. As an example, in Fig. 6, we show such plot (see full squares) for the 1.5 mol% In2O3-doped crystal. The thick solid line represents the fit to the scattered data using the exponential expression given by Eq. (3). The fitting parameter values of α and β are indicated. Table IV brings together the α and β values of all the three Er–In-codoped LN crystals studied. For comparison, the values of the only Er-doped LN reported in Ref. Reference Amin, Dussardier, Schweizer and Hempstead35 and Ref. Reference Núñez, Lifante and Cussó36 are given in parentheses and in brackets, respectively (see the last column). One can see that the In codoping results in considerable decrease by 64% for the α value and about three orders of magnitude for the β value. For comparison, the results reported by Amin et al.Reference Amin, Dussardier, Schweizer and Hempstead35 (dashed line) and Núñez et al.Reference Núñez, Lifante and Cussó36 (dotted line) for the only Er-doped LN are also illustrated in Fig. 6. One can see that the W nr shows considerable In codoping effect. It appears that the In codoping lowers the W nr for a smaller energy gap whereas increases the W nr for a larger energy gap. On the other hand, a comparison of the fitted exponential plots for the three crystals studied shows that the W nr has a weak dependence on the In doping level.
Nonradiative multiphonon relaxation rate (full squares) of Er3+ in LN-codoped with 1.5 mol% In2O3 as a function of the energy gap to the lower-lying level. The thick solid line represents the exponential fit. The fitting parameters are indicated. For comparison, the results reported by Amin et al.35 (dashed line) and Núñez et al.36 (dotted line) for the only Er-doping case are also shown.

A comparison of constant characteristic of nonradiative multiphonon decay rate of Er3+ in only Er-doped and in Er–In-codoped LN crystals.

Data in parentheses and in brackets given for the only Er-doped crystal are taken from Ref. Reference Amin, Dussardier, Schweizer and Hempstead35 and Reference Núñez, Lifante and Cussó36, respectively.
IV. CONCLUSION
We have performed a complete study on visible, near-infrared, and mid-infrared emission and absorption cross section spectral distributions of Er3+ in congruently melting LiNbO3 crystals codoped with different concentrations of In2O3. The study shows that, for the transitions concerning with the 2H11/2 and 4I13/2 manifolds, the values of emission and absorption cross sections, their polarization dependence, and the spectral shape all change definitely from the only Er-doped bulk crystal or waveguide structure to the In–Er-codoped crystal and show definite In2O3 doping-level effect. In contrast, the cross section reveals a weak dependence on the In2O3-doping level for the other transitions including the mid-infrared one. In particular, for the 1.5 mol% In2O3-doped optical-damage-resistant crystal, the 1530 nm emission and absorption cross sections under the π-/σ-polarization are 1.18/0.69 × 10-20 cm2 and 1.34/0.80 × 10-20 cm2, respectively. The peaking emission and absorption cross sections at 2.7 μm are similar to 1.14 × 10⁻²⁰ cm−2 and 1.29 × 10⁻²⁰ cm−2, respectively. It is proposed on the basis of the observed polarization dependence that 979-nm σ-polarization and 1484 nm π-polarization are the preferred pumping polarization schemes for the possible lasing and/or optical amplification at 559, 1530, and 2700 nm. The π-polarization scheme is preferred for both the 559 and 1530 nm lasing and/or optical amplification.
The calculated radiative and measured lifetimes show the In-codoping effects similar to those of the emission and absorption cross sections. For the optical-damage-resistant crystal, the radiative quantum efficiency is similar to ∼100%, 15%, 4%, and 26% for the 1530, 996, 673, and 559 nm emissions, respectively, which are same as or slightly higher than those values of the only Er-doped bulk material or waveguide structure. The non-radiative multiphonon relaxation rate shows considerable In codoping effect. The In codoping results in the decrease of relaxation rate for a smaller energy gap whereas results in the increase of relaxation rate for a larger energy gap. On the other hand, the relaxation rate has a weak dependence on the In doping level.
This work presents entire and systematic knowledge of emission and absorption cross section spectra and the theoretical and experimental lifetime data of the Er–In-codoped LN crystals. These spectroscopic data may offer guidance to the design and fabrication of the related active waveguide device with optimum performance.
ACKNOWLEDGMENTS
This work was supported by the National Natural Science Foundation of China under Project No. 50872089; by the Key Program for Research on Fundamental to Application and Leading Technology, Tianjin Science and Technology Commission of China under Project No. 11JCZDJC15500; and by the Specialized Research Fund for the Doctoral Program of Higher Education of China under Project No. 20100032110052.