I. INTRODUCTION
Gas or vapor chemical sensors find applications in chemical, agricultural, food processing, beverage, mining, security, and other industries.Reference Albert, Lewis, Schauer, Sotzing, Stitzel, Vaid and Walt1–Reference Grundler4 Reports on chemical sensing in the literature commonly include H2, CO, NH3, NO2, NO, O2, ozone, CH4, HCl, Cl2, SO2, and various volatile organic compounds. Commercially available chemical sensors are based on technologies, such as metal oxide thin film sensors, conductive polymer sensors, quartz crystal microbalance systems, surface acoustic wave sensors, etc.Reference Grundler4 These technologies do not meet some or all of the desirable attributes in industrial chemical sensing: high sensitivity (parts per billion, ppb to parts per million, ppm depending on the application), room temperature operation, small size (mass, volume), low power consumption, rapid response and recovery, long term stability, amenable to mass production, and low cost. As a result, chemical sensor development continues to be an active area of research, currently utilizing advances in microfabrication, microelectromechanical systems, and nanomaterials.
Nanotechnology may offer advantages with respect to some of the expectations above. Nanomaterials such as carbon nanotubes (CNTs) and inorganic nanowiresReference Li and Meyyappan5, Reference Meyyappan and Sunkara6 exhibit a large surface to volume ratio, leading to large adsorption rates for various gases and vapors. This can sensitively change some property of the nanotube or nanowire, such as resistance, capacitance, or dielectric constant. The ability to measure and monitor the change in one of these properties forms the basis for sensing with increased sensitivity and a decrease in power consumption (relative to the corresponding thin film-based sensors), in addition to the opportunity to reduce the size and weight. For example, single-walled carbon nanotubes (SWCNTs) have been characterized to possess a surface area as high as 1580 m2/g.Reference Cinke, Li, Chen, Cassell, Delzeit, Han and Meyyappan7 Taking advantage of this, numerous reports have appeared on the investigation of the suitability of SWCNTs as sensing medium, showing reversible changes in conductivity upon adsorption of various gases and vapors.Reference Li and Meyyappan5, Reference Kong, Franklin, Zhou, Chapline, Peng, Cho and Dai8–Reference Cho, Lee, Kong and Chandrakasan19 Capacitance of SWCNTs can also be measured and monitored to construct chemical sensors.Reference Novak, Snow, Houser, Park, Stepnowski and McGill20 Though multiwalled CNTs can be used for chemical sensing as well,Reference Penza, Cassano, Rossi, Rizzo, Signore, Alvisi, Lisi, Serra and Giorgi21 there is no clear advantage in doing so. Their surface area is smaller than that of SWCNTs and they are metallic tubes. Although often a price comparison between the two varieties is presented as an advantage, such a justification is misleading and incorrect because individual sensors only need picogram to nanogram amounts of SWCNTs. Therefore, the cost of using SWCNTs for making a sensor is negligible compared to the costs for microfabrication, electronics and packaging. Kauffman and StarReference Kauffman and Star22 provide a comprehensive and critical review of CNT-based sensing of gases and vapors along with an extensive list of references and the current status of understanding of sensor mechanisms. Recently, a variety of oxide nanowires have also been studied for chemical sensingReference Meyyappan and Sunkara6 and while it is possible to get acceptable sensitivity for some analytes, oxide-based sensors typically operate at elevated temperatures (∼200–300 °C) in contrast to the room temperature operation of SWCNTs.
Many CNT-based chemical sensors to date have used a field effect transistor (FET) configuration wherein a film of SWCNTs has been used as the conducting channel.Reference Kong, Franklin, Zhou, Chapline, Peng, Cho and Dai8, Reference Qi, Vermesh, Grecu, Javey, Wang, Dai, Peng and Cho9, Reference Bekyarova, Davis, Burch, Itkis, Zhao, Sunshine and Haddon16–Reference Cho, Lee, Kong and Chandrakasan19 Typically, the silicon substrate is used as a backgate in most of these studies. A much simpler interdigitated electrode (IDE) configuration using microfabrication techniques has been shown to provide as high sensitivity as the FET-like devicesReference Li, Lu, Ye, Cinke, Han and Meyyappan11–Reference Li, Lu and Meyyappan15, Reference Novak, Snow, Houser, Park, Stepnowski and McGill20 with simpler back-end electronics for multichannel sensor array measurement. Regardless of the approach, all of the studies to date on CNT chemsensors are about eliciting a change in SWCNT resistance (or some other variable) when a known gas or vapor diluted in nitrogen or air is blown over the sensor.Reference Kauffman and Star22 Practical implementation demands selectivity for the chosen analyte and perhaps use of sensor arrays with the aid of pattern recognition algorithms, as in an electronic nose mode.Reference Albert, Lewis, Schauer, Sotzing, Stitzel, Vaid and Walt1–Reference Rock, Barsan and Weimar3 Such system level demonstrations are not common in the nanochemical sensor literature.
Our interest in this subject arises from practical needs in space missions such as cabin air quality monitoring in space vehicles and International Space Station,Reference Ryan, Zhou, Buehler, Manatt, Mowrey, Jackson, Kisor, Shevade and Homer23 e.g., formaldehyde detection,Reference Lu, Meyyappan and Li24 and monitoring of fuel and oxidant leaks in launch vehicles. Our group has constructed a sensor array with a simple IDE pattern on a silicon substrate and SWCNTs as the primary sensing material. This sensor has been demonstrated to be sensitive for detecting NO2, Cl2, HCl, benzene, toluene, formaldehyde, nitrotoluene, and others.Reference Li, Lu, Ye, Cinke, Han and Meyyappan11–Reference Li, Lu and Meyyappan15 We used a principal component analysis to demonstrate that the sensor can distinguish between NO2, chlorine, and ammonia.Reference Lu, Partridge, Meyyappan and Li14 In the above studies, we used a 1 × 1 cm2 sensor chip consisting of 32 sensor elements along with a heater, a humidity sensor, and a temperature sensor. Typically, the individual sensor elements in the array vary in their physical dimensions and chemical makeup, such as pristine SWCNTs, doped-SWCNTs, and nanotubes with a coating. For example, palladium doping is useful in the detection of methane and hydrogen. Hydroxy cellulose coating is preferred for detection of HCl. The use of coatings and dopings is to elicit a signal for a given analyte from some of the sensors in the array because pristine CNTs do not respond to every analyte of interest. We have also used oxide nanowires in some cases since the idea of multiple sensor array in an electronic nose is to have sufficient orthogonality or variation in response patterns from various sensor elements in the array. Then in the testing or learning mode, each of the sensor elements in the array would provide a different response when exposed to the same analyte at a given concentration and background humidity. Data generated for various concentrations and humidity levels are stored and utilized later during signal processing with the aid of a pattern recognition algorithm. Details of the sensor construction can be found in our previous works.Reference Li, Lu, Ye, Cinke, Han and Meyyappan11–Reference Li, Lu and Meyyappan15 This sensor has been field-tested twice, once aboard a Midstar Satellite and then in the International Space Station. The sensor has also been miniaturized recently to fit into a cell phone for homeland security needs. The results from these endeavors will be presented in future publications. Here we focus on issues encountered during the development process related to interference from other chemicals.
Our previous studiesReference Li, Lu, Ye, Cinke, Han and Meyyappan11–Reference Li, Lu and Meyyappan15 tested the sensing potential for various gases diluted in air as in every CNT sensor work in the literature,Reference Kauffman and Star22 but it is important to include interference effects from other gases to deploy the sensor system in practical scenarios. This study demonstrates this capability by attempting to detect NO2 with a background of varying concentrations of Cl2 in air. Chlorine was chosen since it is an electron withdrawing gas like NO2, and therefore, a reasonable candidate for studying interference effects. Interference by humidity was also examined. The reason to study NO2 here is that N2O4 is used as an oxidant in launch vehicles and when it leaks, it immediately decomposes into NO2. Because of the extremely short lifetime of N2O4, only NO2 can serve as a warning signal for leaks. Of course, NO2 also has significance in many terrestrial applications.
II. EXPERIMENTAL WORK
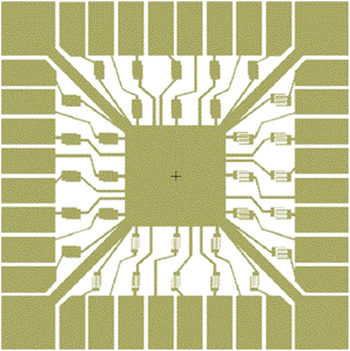
Figure 1 shows our sensor chip containing 32 sensor elements on a 1 × 1 cm2 area divided into four banks of eight sensors. These banks are denoted as A, B, C, and D for convenience, starting from the bottom and moving counter clockwise. An individual sensor element is 500 × 300 μm2 in size. The microfabrication approach described below allows reduction of the chip size and increasing the number of sensor elements. Though our current fabrication is on 4′′ wafers, scale up to larger wafers is straightforward. Each chip is mounted on a ceramic carrier and consists of a heater, a temperature sensor, and a humidity sensor.
An image of a 32 channel sensor array, divided into four banks of eight sensors denoted A, B, C, and D, counter clockwise starting from the bottom.

The sensor fabrication is done on a p-type silicon (100) wafer with a resistivity of 0.006–0.01 Ω cm and an approximate thickness of 500 μm. Patterned platinum (Pt) lines (200-nm thick) are deposited on top of thermally grown 0.5-μm SiO2 for the purposes of electrical heating and resistive temperature detection. Then a 1-μm Si3N4 layer is deposited as an insulating layer, followed by the IDE pattern. This consists of 200-nm Pt on top of 20-nm Ti with varying finger gaps and finger widths. The finger gaps are 50, 25, 12, and 8 μm for sensors in banks A, B, C, and D, respectively. The finger width is 20 μm for sensors in bank A and it is 10 μm in the remaining three banks. These are the only (physical) variations among the sensor elements, and in this work, we have not introduced any chemical variations such as dopings or coatings, instead used only pristine SWCNTs. This is adequate because pristine CNTs are known to be sensitive to NO2.Reference Kong, Franklin, Zhou, Chapline, Peng, Cho and Dai8, Reference Li, Lu, Ye, Cinke, Han and Meyyappan11
We used bulk SWCNTs consisting of semiconducting and metallic varieties and no attempt was made to separate or eliminate the metallic tubes. After thorough purification, the nanotubes were dispersed in a solvent (dimethyl formamide) and inkjetted across the IDE pattern of the sensor platform (typically, 0.05 μL). Following the quick evaporation of the solvent a thin film of nanotubes bridges across the electrodes. Manual inkjetting to each sensor element in a sensor array is the current approach. However, doing this across the whole wafer could be impractical for quality control. In addition, this leads to sensor-to-sensor variation within the same bank of sensors. As of now, an automated delivery system with X–Y movement with appropriate needles for nanoliter drop size is not available. For this reason, we are also developing an in-situ chemical vapor deposition approach to deposit the SWCNTs directly on the sensor platform. In-situ growth of CNTs for chemical sensing is a way to scale up the chemical sensor fabrication on a wafer scale. When optimized, this approach can provide uniform deposition of CNTs either as a sensing material or as a supporting matrix for coating and doping other binding materials for sensing purpose.Reference Li, Lu, Ye, Delzeit and Meyyappan13 The results from this current development will be discussed in the future.
The sensor chips were wire bonded into a carrier through which individual resistances of sensors could be measured; each chip was tested with the multichannel ohmmeter that also comprises the data acquisition system for the gas testing. Current–voltage characteristics were measured (Keithly Instruments 2002/7001, Scottsdale, AZ) for each individual sensor on the chips. Then the chips were tested for their response to NO2 and Cl2 individually, and the results were compared to our previous published results for these two gases and also with each other to ensure internal consistency in the data. This was followed by a set of tests where the concentration of chlorine was set constant and NO2 was pulsed for 10 min at equal concentrations, with recovery periods in between each trial. In practical situations, the background concentration can vary but it does not pose any complications since the actual sensing involves looking for known fingerprints from the data bank for the analytes in question and identification with the aid of a pattern recognition algorithm. Gas exposure at specified concentrations was done using a computerized multicomponent gas blending and diffusion system (Environics 2000; Environics Inc., Tolland, CT). A steady total flow of 400 cc/min was used during exposure to various gas streams. The exposure times are as given in the figures discussed in the next section.
III. RESULTS AND DISCUSSION
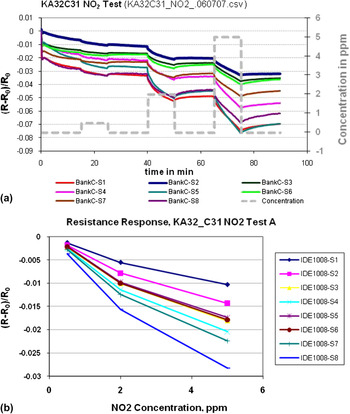
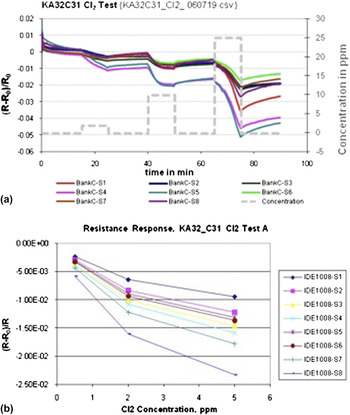
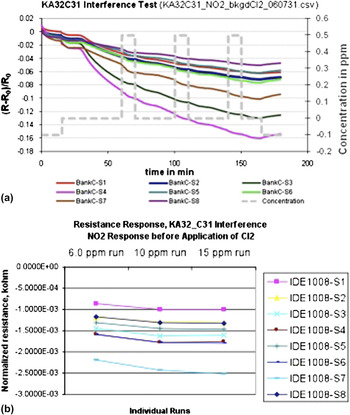
The fabricated sensor chips were subjected to evaluation as described in the previous section. The chip-to-chip variation in results is of the same order as sensor-to-sensor variation within the same chip as in Figs. 2–4. Here representative results from a chip labeled KA32-C31 among the 15 chips are discussed.
(a) Response of one bank (bank C) of 8 single-walled carbon nanotube (SWCNT) sensors for NO2 exposure at 0.5, 2, and 5 ppm in air at room temperature. The concentration (y-axis on the right side) is shown as step functions. (b) Response versus NO2 concentration for the eight sensors. The response is represented as normalized resistance (R−R o)/R o, where R o is the baseline resistance and R is the instantaneous resistance.

(a) Response of one bank (bank C) of 8 SWCNT sensors for Cl2 at 6, 10, and 15 ppm in air at room temperature and (b) Response versus chlorine concentration calibration curves.

Sensing of NO2 in an interfering background of Cl2. (a) Response of one bank (bank C) of 8 SWCNT sensors for 0.5 ppm of NO2 three times on top of 10 ppm Cl2 in air at room temperature. (b) Sensor responses of 8 SWCNT sensors to 0.5 ppm NO2 on top of 6, 10, and 15 ppm of Cl2 in air at room temperature.

The sensor chips were first exposed to NO2 only at 0.5, 2, and 5 ppm in air. The exposure sequence and exposure times are as shown in Fig. 2. Figure 2 shows the response curves for the eight sensors in bank C (finger gap of 12 μm and finger width of 10 μm). The response plotted here is the normalized resistance (R−R o)/R o where R o is the baseline resistance and R is resistance at time t. Also plotted in Fig. 2 is this normalized resistance versus concentration calibration curves for the eight sensors. The first NO2 exposure occurs at t = 15 min with 0.5 ppm. Even during the first 15 min with no gas exposure, the resistance continues to change; during this time known as the “conditioning period” in the sensor literature, the sensor is on with a voltage and the resistance is expected to change. It is well known that the baseline is likely to drift over time in all types of chemiresistor-based sensors for a variety of reasons. Indeed, we have some SWCNT sensors running continuously for over 2 years and the baseline variations in normalized resistance per day have ranged from 0.0008 to 0.003. For this reason, the signal processing program looks for a change in slope when gas exposure occurs. Thus, in each case, we did not wait until a complete recovery to baseline, before initiating the next NO2 injection. Figure 2 shows that the sensor is sensitive down to 0.5 ppm and the behavior is similar to our earlier NO2 workReference Li, Lu, Ye, Cinke, Han and Meyyappan11 wherein an extrapolation of a calibration curve like the one in Fig. 2 showed a detection limit of 4 ppb.
The behavior of four out of the eight sensors in Fig. 2 is very close to each other with others showing some variation. As mentioned earlier, the manual process of inkjetting may result in variations of the amount of dispersion dispensed and thus the resulting nanotube density from sensor-to-sensor. This is not really a flaw since the response curve of each sensor is stored as its unique fingerprint for that analyte for pattern recognition purposes later. What is more important is chip-to-chip variation on the same wafer (which is affected by the same factor as above plus many others) as it would be ideal not to have to train every single chip and instead, load the training data from one chip onto all others. Analysis of all the four banks of the sensors indicates a stronger response for A with the largest finger gap of 50 μm. The variation between sensor elements in each bank does not show any marked dependence on finger gaps. In any case, a systematic study and optimization are needed.
Next, after a thorough purging, the sensor chips were exposed to Cl2 at 6, 10, and 15 ppm in air. The response curves and calibration curves for the same bank C sensor elements are shown in Fig. 3, which show clear responses to chlorine exposure. In general, the response signal for chlorine can be enhanced if the SWCNTs are coated with chlorosulfonated polyethylene as shown in Refs. Reference Lu, Partridge, Meyyappan and Li14 and Reference Li, Lu and Meyyappan15. Next, the sensor chips were tested for their response to NO2 in a high concentration of chlorine background gas. The nitrogen dioxide concentration was fixed at 0.5 ppm, whereas the chlorine level was varied at 6, 10, and 15 ppm sequentially in separate tests. Figure 4 shows distinct sensor responses to 0.5-ppm NO2 with a 10-ppm-Cl2 background in air after each NO2 injection. The response peaks represent the overlay of the nitrogen dioxide over the existing flow of chlorine. In each case, the NO2 application clearly changes the trend of the existing line. The consistent and nearly constant sensor responses of 0.5-ppm NO2 on top of 6, 10, and 15 ppm in Fig. 4b indicate that the chlorine gas does not interfere with NO2 detection. Although the kinetics of any possible reactions are not known and the overall relationships are hard to define, the results here present evidence that the chips can detect the presence of NO2 in a background of Cl2 up to 30× more concentration and, up to this point, with no evidence of sensor saturation or failure to return to baseline.
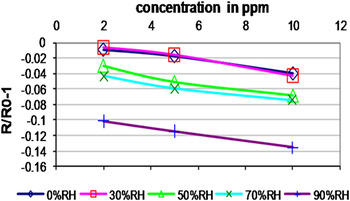
Humidity is a common interfering factor in chemical sensor operation. Several mechanisms have been suggestedReference Kauffman and Star22 to understand the humidity effect including electron donation to CNTs, bonding of hydrogen with the oxygen defect sites in CNTs, and direct H2O adsorption onto CNTs leading to charge trapping sites. The situation of cross sensitivity with the analyte of interest and background can be even more complex. It is important to establish the impact of this effect on sensor performance, and for this reason, the NO2 study was repeated at various relative humidity levels. Figure 5 shows the normalized sensor response (R−R o)/R o as a function of NO2 concentration for four relative humidity levels between 0 and 90%. The dependence on humidity does not appear to be linear, perhaps indicating the need for a few more data points if interpolation was to be used during signal processing to correct for the prevailing humidity.
Effect of humidity on response to NO2 exposure. Relative humidity was varied between 0 and 90%.

IV. CONCLUSIONS
We have fabricated a SWCNT-based sensor array with 32 sensor elements for gas and vapor detection. The sensor array was tested for NO2 detection and the results show that low concentration detection (0.5 ppm) at room temperature is possible with a larger interfering background gas of chlorine. Interference by humidity also was examined and the sensor response was found to vary with humidity. This has implications in the construction of an electronic nose for use with pattern recognition. All exposure tests during the training mode must be repeated at several humidity levels and the entire data set must be used for signal processing during the field use interrogation mode. Practical considerations also demand including similar effects, if any, from temperature and pressure, baseline drifting over time, and sensor ageing and refreshment issues which are currently underway.