I. INTRODUCTION
304 stainless steel is widely used in industry and daily life owing to its excellent corrosion resistance. But its low yield strength forced the increase of parts thickness, which caused materials waste, the burdens of environmental pollution, and high cost. In general, the yield strength of alloys could be greatly enhanced by precipitation, phase transformation, and grain refinement.Reference Badji, Kherrouba, Mehdi, Cheniti, Bouabdallah, Kahloun and Bacroix1–Reference Mohammadzadeh and Akbari6 However, there is considerable loss of ductility and corrosion resistance at the same time,Reference Badji, Kherrouba, Mehdi, Cheniti, Bouabdallah, Kahloun and Bacroix1–Reference Mohammadzadeh and Akbari6 which limited their industrial applications. It is found that the existence of some amount of nanograins embedded in the microcrystalline grains matrix to form a micro-nanocrystalline structure could obtain high tensile strength and good ductility in steel.Reference Yinmin, Mingwei, Fenghua and En7,Reference Tellkamp, Lavernia and Melmed8
The micro-nanocrystalline structure is successfully developed by powder metallurgy method,Reference Yuuji, Tadanobu, Fuxing and Kaneaki9,Reference Witkin, Lee, Rodriguez, Nutt and Lavernia10 but the method is complicated and difficult to scale up for industrialization. Furthermore, it has porous inevitably, which decrease the uniform elongation of the steel. Rolling is a simple method to produce micro-nanocrystalline structure, which is nonporous and has high tensile strength and ductility.Reference Rafizadeh, Mani and Kazeminezhad11
In this paper, we found a new nanostructure design route in which the nanocrocrystalline austenite was well dispersed in a microcrystalline austenite matrix. After being processed, the tensile strength and corrosion resistance of alloys could be enhanced strongly at the same time. Tensile strength and elongation of steel could reach a high level of 950 MPa and 20%, respectively, while the intergranular corrosion rate was 0.46 g/(m2 h).
II. EXPERIMENTS
A. Preparation of cast steel
The steel ingot was fabricated by the aluminothermic reaction method, which was given in details elsewhere.Reference La, Zhang, Ma, Wei, Wang and Lu12–Reference La, Wei, Lu, Shi, Chu, Wang and Wei14 Microstructure and tensile properties of cast steel were reported previously.Reference La, Wei, Lu, Shi, Chu, Wang and Wei14
B. Preparation of rolling samples
Samples were cut into 60 mm × 50 mm × 5 mm from the cast steel using wire-cutting machine, and the surface of the samples was polished with 600# sandpaper. Firstly, the samples were rolled at 1000 °C for a thickness reduction of 40% using a MR350 rolling mill (Shenyang Kejing Auto-instrument Co., Ltd, Shenyang, China), thickness of the samples decreased from 5 mm to 3 mm, length increased from 60 mm to 70 mm. And then the samples were rolled at 600 °C for the second time with a thickness reduction of 30, 50 and 70%, respectively, the thickness decreased from 3 mm to 2.1 mm, 1.5 mm, and 0.9 mm, respectively, length increased from 70 mm to 85 mm, 122 mm, and 190 mm, respectively. The photograph of the 304 steel with different thickness reductions is shown in Fig. 1; all surfaces of the samples were smooth and they only have slightly cracks. After being rolled, all of the samples were cooled in air to room temperature and then annealed at 400 °C with 2 h for the stress relief.
The photograph of the 304 steel with different thickness reductions.

The steel was rolled at 1000 °C with 40% thickness reduction for improving ductility, which could prevent crack initiation while rolling at 600 °C; low temperature rolling for improving the yield strength of the steel. This is why we selected two rolling temperatures.
C. Microstructural characterization
Polished surface of the rolled steels strips was etched with etching solution (10 g FeCl3 + 40 mL HCl + 60 mL H2O) for 35 s, to dissolve the corrosion products (FeCl3) into the etching solution. In the process of corrosion, the sample was gripped with a pair of tweezers and immersed in etching solution, and kept shaking. After being etched, the sample was pulled out from the corrosive liquid, washed with hot water 3 min, and cleaned with an ultrasonic wave cleaner in ethyl alcohol for 5 min for further removal corrosion products. After blow-drying, the samples were examined on JSM-6700F scanning electron microscope (SEM; JEOL Ltd., Tokyo, Japan), operating voltage and electric current were 8 kV and 10 μA, respectively.
The surface of the samples was polished with 600# sandpaper (particles size was 10–14 μm), and cleaned with an ultrasonic wave cleaner in ethyl alcohol for 10 min, and examined on D8 x-ray diffraction (XRD; Bruker Corporation, Karlsruhe, Germany), 2 theta was 30–120°, scanning rate was 7°/min.
Sheet specimens cut from the rolled steels were grounded into thin foils with less than 100 μm in thickness by hands, and then punched into plates with a diameter of 3 mm by a puncher. The plates were thinned electrolytically by a twin-jet electro-polishing device and were examined on a JEM-2010 transmission electron microscope (TEM; JEOL Ltd.) operated at 200 kV. The electrolyte was a solution of 2 vol% perchloric acid in ethanol.
D. Tensile test
Specimens with the length of 32 mm were cut from the rolled steels with a wire-cutting machine for tensile tests. Surface of the specimen were polished with 600# sandpaper. The tensile tests were performed on the Shimadzu AG-10T tester (Shimadzu Corporation, Kyoto, Japan) with a crossing speed of 0.2 mm/min and repeated three times, the final result was an average value of the three times, the standard deviation was less than 5%.
E. Corrosion resistance tests
Samples were cut into 15 mm × 10 mm from the rolled steels using wire-cutting machine, and then were heat treated (annealed under 650 °C for 2 h, and then air cooling). The surfaces of the samples were polished with 600# sandpaper, and were cleaned by ethanol with ultrasonic cleaner for 10 min. Then, the samples were pulled out from the ethanol and blow-dried by hair drier, and weighted by analytical balance. In addition, its length (L), width (w), and thickness (h) were measured by vernier caliper, the unit was millimeter, precision was 0.02 mm, and its superficial area (S) was calculated according to formula (1).15
 $$S = \left( {l \times w + l \times h + w \times h} \right) \times 2$$
After being calculated by the superficial area of the sample (25–30 mL/cm2), the volume of nitrite acid solution (65.0 ± 0.2 wt%) was heated to keep boiling in conical flask. The total experiment time was 240 h, divided into 5 cycles, 48 h per cycle. After finished per cycle, the sample was taken out from nitrite acid solution, and the corrosion products were removed in water softly with a brush. The cleaned samples were dried by drying oven and weighted. Intergranular corrosion rate (V) was calculated according to formula (2).
 $$V = \left( {{M_1} - {{\rm M}_0}} \right) \times {\left( {St} \right)^{ - 1}}$$
M 0: the weight of the sample after one cycle (g); M 1: the weight of the sample before one cycle (g); S: the superficial area of the sample (m2); t: experimental time (h).
The intergranular corrosion rate of the sample was the average value of 5 cycles, and the experiment was repeated three times, the final result was an average value of the three times. The standard deviation was less than 5%.
III. RESULTS
XRD patterns of stainless steels strips with different thickness reductions are shown in Fig. 2. Peaks correspond to ferrite and austenite phases, and the major peaks of the steels are austenite peaks. PDF standard number for austenite and ferrite is 65-9094 and 65-4899, respectively. With the increase of the thickness reduction, the (200) peak of ferrite phase gets high firstly and then almost no change, which can be indicated that the formation of texture after being rolled with 50% and 70% thickness reduction.
XRD patterns of the steels with different thickness reductions.
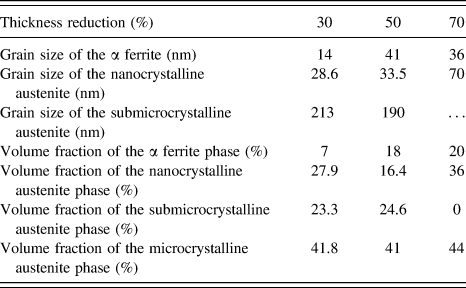
Typical SEM microstructures of the stainless steels strips with different thickness reductions are shown in Fig. 3. Energy dispersive spectrometer (EDS) analysis is shown in Fig. 4, from Fig. 4(b), the O and Al element were rich in black dot area, thus, few dots in SEM images are Al2O3 particles; from Fig. 4(d), the Ni element was rich in bright area, thus, the bright area in SEM images is austenite and the gray area is α ferrite. From Fig. 3, it can be seen that the ferrite phase is elongated with the increase of the thickness reduction, when the thickness reduction reaches to 70%, the shape of the ferrite phase is stretched and parallel with the rolling direction. From Figs. 3(b), 3(d), and 3(f), it can been seen that α ferrite phase of the steel strips consists of nanocrystalline grains; when the thickness reduction of the steel strips is 30, 50, and 70%, after calculating, the grain size of α ferrite is about 14 nm, 41 nm, and 36 nm, and the volume fraction of α ferrite phase is about 7, 18, and 20%, the result indicates that the volume fraction of α ferrite phase increases with the thickness reduction. The volume fraction of α ferrite phase is calculated from ten different low magnification SEM images. First, the total area of the gray area (A 1) and entire area (A 2) of the SEM microstructure was calculated using IPWIN6 software, the volume fraction of ferrite in this image is (A 1/A 2) × 100%; second, statistics of ten different SEM images in same method was taken, and final value of the volume fraction of ferrite was an average of these ten different dates. The grain size of the ferrite is calculated from ten different high magnification SEM images using IPWIN6 software. The principle of the calculated size of a ferrite grain is that when the angle rotated 2°, the diameter of the grain was measured at one time, thus, measure the diameter 180 times after rotating 360°, the average value is the size of a ferrite grain. First, all grains in a SEM figure were measured and the average value is the grain size of α ferrite grain in this image; second, statistics of ten different high magnification SEM images in same method was taken, and the final value of the ferrite grain size was an average of these dates. The grain size and volume fraction of the ferrite are shown in Table I.
SEM images of the steels with 30% (a and b), 50% (c and d), and 70% (e and f) thickness reduction, (b), (d) and (f) is high magnification of α ferrite in (a), (c) and (e), respectively.
SEM image (a) of the steel with 50% thickness reduction, (b), (c), and (d) is the EDS analysis of chemical composition in A, B, and C regions of (a), respectively.
The microstructure parameters of the steels with different thickness reductions.
Typical bright TEM images, selected area electron diffraction (SAED) pattern, dark field TEM images (obtained from the first bright diffraction ring, indicated by circle), the grain size distribution of the nanocrystalline and submicrocrystalline austenite of the steel strips with different thickness reductions are given in Fig. 5–7. The brightest areas in the bright field TEM images are microcrystalline austenite, the big darkest grains are submicrocrystalline austenite and the small darkest grains are nanocrystalline austenite; the brightest areas in the dark field TEM images are nanocrystalline austenite. The SAED patterns are composed of diffraction rings, which are indexed to the nanocrystalline austenite. The nanocrystalline α ferrite phase is not observed in the TEM examinations, because of the phase is firstly eroded in the process of double jet electrolytic polishing owing to worse corrosion resistance. As the TEM microstructure only includes austenite while exclude ferrites, the result is different from Table I, the Table I includes austenite and ferrite. The grain size of nanocrystalline austenite is calculated from ten different bright TEM images using IPWIN6 software; statistical approach is same with the method that calculated the grain size of ferrite. To calculate the volume fraction of the nanocrystalline austenite, first, calculate the total area of the small black nanocrystalline austenite grain (B 1) and entire area (B 2) of the bright TEM microstructure using IPWIN6 software, the volume fraction of the nanocrystalline austenite in this image is (B 1/B 2) × 100%; second, the final value of volume fraction of the nanocrystalline austenite is an average of these different dates. Statistical approach of grain size and volume fraction of the submicrocrystalline austenite is same with the method that calculated the grain size and volume fraction of nanocrystalline austenite, respectively. Grain size, volume fractions of submicrocrystalline and nanocrystalline austenite in austenite microstructure with different thickness reductions are shown in Fig. 8. With the increasing thickness reduction, the grain size of the nanocrystalline austenite increases from 28.6 nm to 70 nm; after rolling with 50% thickness reduction, the grain size of submicrocrystalline austenite decreases from 213 nm to 190 nm and disperse better; after rolling with 70% thickness reduction, the submicrocrystalline austenite vanished. After rolling with 30% thickness reduction, the volume fraction of the nanocrystalline and submicrocrystalline austenite is 30% and 25%, respectively; after rolling with 50% thickness reduction, the nanocrystalline austenite grains grow up and combine with the neighbor submicrocrystalline grains leading to its volume fraction decrease to 20%, the volume fraction of the submicrocrystalline austenite increases to 30%; after rolling with 70% thickness reduction, the submicrocrystalline broke down to nanocrystalline leading to the volume fraction increases to 45%.
Bright field TEM image (a), SAED image (b), dark field TEM image (c), grain size distribution of the nanocrystalline (d) and the submicroncrystalline (e) of the steel strip with 30% thickness reduction.
Bright field TEM image (a), SAED image (b), dark field TEM image (c), grain size distribution of the nanocrystalline (d) and the submicroncrystalline (e) of the steel strip with 50% thickness reduction.
Bright field TEM image (a), SAED image (b), dark field TEM image (c) and grain size distribution of the nanocrystalline (d) of the steel strip with 70% thickness reduction.
The grain size, volume fraction of the nanocrystalline austenite (a) and the submicrocrystalline austenite (b) with different thickness reductions.
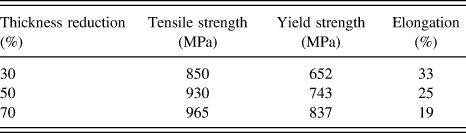
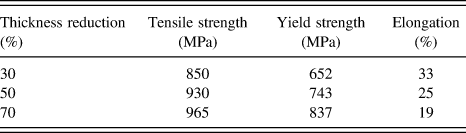
Tensile stress–strain curves of the 304 stainless steels with different thickness reductions are shown in Fig. 9 and summarized in Table II. After the yielding, there is no strain hardening at the initial time and then a little strain hardening can be observed. The yield strength increases with the thickness reduction, which is about 652, 743, and 837 MPa. The variation trend of tensile strength that consists with the yield strength are about 850, 930 and 965 MPa, respectively. The elongation decreases with the thickness reduction, which is about 33, 25 and 19%, respectively. When the thickness reduction is 70%, the value of the tensile strength, yield strength, and elongation is the best combination for the steel.Reference Huang, Hu, Wang, Wang, Yang and Zhu16
Engineering tensile stress–strain curves of the 304 steel strips with different thickness reductions (a); the tensile strength, yield strength and elongation of the steels (b).
Tensile properties of steels with different thickness reductions.
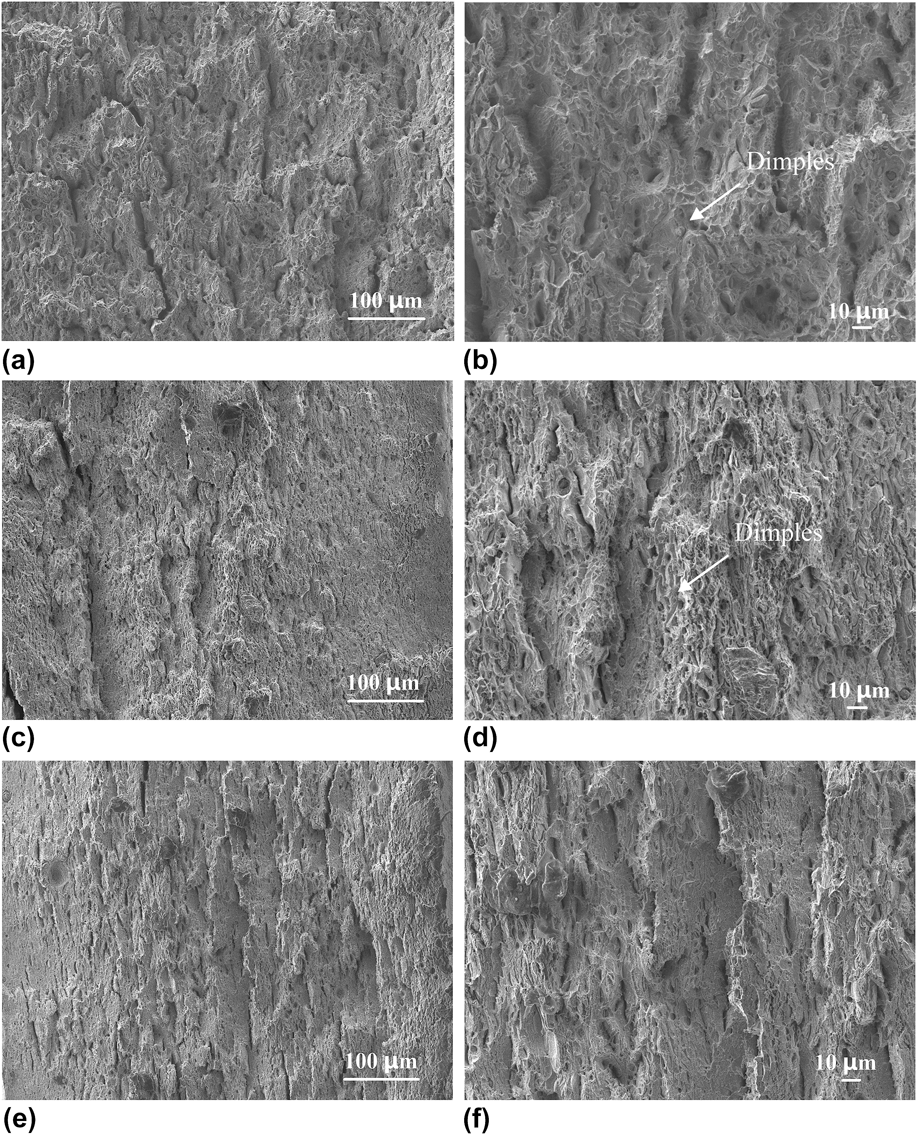
Tensile fracture morphologies of the 304 steel strips with different thickness reductions are presented in Fig. 10. A large number of dimples distribute uniformly on the steel with 30% thickness reduction, which means it has the ductile fracture. After the steel is rolled with 50% thickness reduction, the tensile fracture morphology of the steel has some rivers pattern and a number of dimples, which also belong to ductile fracture. After the steel is rolled with 70% thickness reduction, the tensile fracture morphology of the steel has lots of rivers pattern and a certain amount of dimples, which belong to mixed mode of ductile and brittle fracture. And the elongation of this sample is lower than other samples.
Tensile fracture morphology of 304 steel strips with 30% (a and b), 50% (c and d) and 70% (e and f) thickness reduction [(b), (d) and (f) is the high magnification of (a), (c) and (e), respectively].
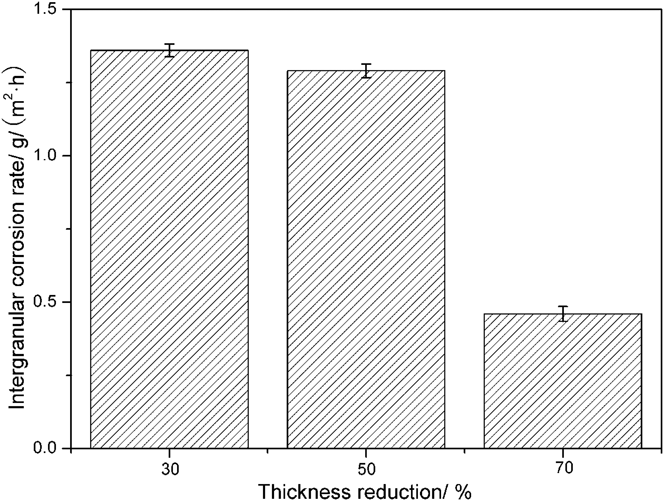
The intergranular corrosion properties of the steel with different thickness reductions are shown in Fig. 11. Intergranular corrosion rate of the steel with 30, 50, and 70% thickness reduction are about 1.36, 1.29 and 0.46 g/(m2 h), respectively. Intergranular corrosion resistance of the steels increases with the thickness reduction.
Intergranular corrosion properties of the steel with different thickness reductions.
IV. DISCUSSION
The grain boundary of nanocrystalline materials belong to high-energy grain boundary, chemical bonds configuration, defects distribution, and atoms arrangement were disordered than transgranular. But it was not said the higher the grain boundary energy, the more beneficial for grain boundary migration. Initially, structural relaxation happened in the process of heating, which caused the disordered atom rearranged and transformed to order for reducing grain boundary free energy. In addition, solute atom or impurity atom segregated on grain boundary also caused the grain boundary free energy to decrease. The segregation played an important role of pinning the movement of the grain boundary migration, and therefore, the growth of the grain can be controlled, which is beneficial for improvement the thermostability of the nanocrystalline materials.Reference Shi17 Therefore, the thermostability of the nano-microcrystalline structure stainless steel in this research was very good, and the nano-microcrystalline structure also existed after being rolled.
There were four major reasons for improvement of the tensile strength: first was that the submicrocrystalline austenite grain size decreased with the thickness reduction, and dispersed more uniformly in microcrystalline austenite, caused deformation occurred in more grains, which is beneficial for the improvement of high yield strength due to their large resistance to dislocation movement.Reference Wang, Zhu and Starink18–Reference Keonwook, Bulatov and Wei20 Second, the nanocrystalline austenite grain increased with the thickness reduction owing to high temperature, dislocation glide mechanism began to work in the process of stretcher strain, and competed with grain boundary sliding mechanism, thereby led to high tensile strength, but decreased tensile ductility. Third, after rolling with 70% thickness reduction, the volume fraction of the nanocrystalline increased, which also led to high strength. Fourth, the volume fraction of the ferrite increased with the thickness reduction, but decreased tensile ductility.
Although, the nanocrystalline austenite enhanced the resistance of the enablement and movement of dislocation, however, which could finally get through nanocrystalline austenite at high stress, thus resulted in high strength and good tensile ductility.Reference Yinmin, Mingwei, Fenghua and En7,Reference Yinmin, Ju, Hamza and Barbee21–Reference Wu, Jiang, Chen, Yuan and Zhu23 This nanostructure design method can be used for other metals and alloys.Reference Wang, Zhu and Starink18
After increasing the tensile strength and elongation of the steel, the corrosion resistance became the major factor for applying the steel in various fields. Compactness and stability of the surface passivated membrane of the steel was the key factor in effect on the corrosion resistance. According to traditional corrosion theory, grain refinement would lead to the property of intergranular corrosion resistance decrease,Reference Bao, Zhu and Qiu24 the reason was that the atomic activity was very high on grain boundary, and grain refinement would lead to the number of grain boundary increase, thus, the number of atomic that take part in reaction in the process of corrosion increased. However, in this paper, the property of intergranular corrosion resistance increased as the grain size decreased.
As we all know, the Cr element play an important role in the process of intergranular corrosion in stainless steel, which can combine with O element and form compactness Cr2O3 passivation membrane on the surface of the stainless steel, let the stainless steel be isolated with air, thereby achieved the purpose to not rust.Reference Chen, Yun, Zou and Yan25 The number of grain boundary increased as the grain size decreased, and became the “passageway” for Cr element diffused from the interior to surface.Reference Hu, Xia, Li, Liu, Zhou, Chen and Wang26 When the Cr2O3 passivation membrane was destroyed, the Cr element was supplied from the interior to surface of the stainless steel quickly, and prevented the steel from being further etched.Reference Hu, Xia, Li, Liu, Zhou, Chen and Wang26 Therefore, the property of intergranular corrosion resistance increased as the grain size decreased in 304 stainless steel.
V. CONCLUSIONS
Submicrocrystalline austenite broken down with the thickness reduction, when the thickness reduction was 70%, all submicrocrystalline were broken down to nanocrocrystalline, and dispersed more uniformly in the microcrystalline austenite phase in the steel; the grain size of nanocrystalline austenite increased from 28.6 nm to 70 nm, and volume fraction increased from 27.9% to 36%; the volume fraction of the ferrite increased. Strength and intergranular corrosion resistance increased much. When the thickness reduction was 70%, the tensile strength, yield strength, elongation, and intergranular corrosion rate was about 965 MPa, 837 MPa, 19% and 0.46 g/(m2 h), respectively, the combination of strength, elongation, and intergranular corrosion property was the optimum value of patent-reported on the steel. This new nanostructure design route can be used to all alloys to get high tensile strength, ductility, and intergranular corrosion property.
ACKNOWLEDGMENTS
This work is supported by the National Natural Science Foundation of China (50674051) and Program for New Century Excellent Talents in University of China Education Ministry.