Introduction
Deeper understanding of the evolution of life on planet Earth is of interest not only in its own right but also for the light it can throw on what can be expected in the extrasolar planetary systems that are being discovered at an increasing rate. Reciprocally, consideration of what may happen elsewhere can help provide a deeper understanding of what has already happened – and what is likely to happen – in our own terrestrial case. This applies particularly to anthropic selection effects, as exemplified by the significance, with respect to the question of the hard steps (Carter Reference Carter1983, Reference Carter2008; Watson Reference Watson2008; McCabe & Lucas Reference McCabe and Lucas2010) in our evolution, of the empirically observed coincidence that the age of the Earth is comparable with the expected total (past and future) life of the Sun.
The present article is concerned with two other – independent but clearly related – empirically observed coincidences that seem likely to be relevant to the question of what was the last of these hard steps. An obviously plausible candidate for the status of the last hard step is the process that occurred when our ancestral line branched off from that of the chimpanzees round about 6 million years ago. This step is the latest of the 39 bifurcations listed by Dawkins (Reference Dawkins2004) (whose introductory presentation of the anthropic principle did not address the terrestrial hard-step question, but got sidetracked into far-fetched cosmological speculations). However, it is also conceivable that this evolutionary step – the onset of the first main phase of hominid evolution – was not extremely hard (in the sense of being highly improbable within the limited time available), but that the last hard step occurred at a more recent occasion, for which the most obvious candidate is the onset of the second main phase of hominid evolution, as marked by the emergence of our own species only a few hundred thousand years ago.
On the basis of the meagre palaeontological evidence available, the salient feature of the first phase was systematic growth of cranial (and presumably corresponding intellectual) capacity, which proceeded at a modest rate in the genera Australopithecus and Paranthropus, and then became remarkably rapid (Falk Reference Falk1998; Holloway Reference Holloway2001) after our own genus ‘homo’ had branched off – at what is a plausible alternative candidate for hard-step status – a couple of million years ago.
The second phase started relatively recently, when our own particular species, ‘homo sapiens’ finally emerged, just a few hundred thousand years ago. Instead of the genetic evolution that characterized the previous phase, this second phase – which has lasted until about now – has been characterized by technological evolution and concomitant population expansion to fill the increasing range of newly created ecological niches. Such evolution is describable as memetic, because the technological know-how on which it depends is analysable in terms of memes, meaning replicable cultural information units, a fruitful concept originally introduced by Dawkins (Reference Dawkins1976) who drew attention to the analogy between memetic evolution and ordinary genetic evolution as described by neo-Darwinian theory.
This second phase of hominid evolution has recently culminated in a global ‘high tech’ civilization characterized by the first of the apparently coincidences referred to above, which is that the human population N has reached a value of the same order of magnitude as the number I of bits of information in the genome, which for ordinary terrestrial (DNA programmed) animals is of the order of a several giga (using the unambiguous Greek term ‘giga’ for what the French call a ‘milliard’ and what the Americans call a ‘billion’, namely a thousand million, as distinct from the original meaning of the word ‘billion’, which was a million million).
The consideration that this large number coincidence,

is not something that held at other times in the past, but something valid only at a particular period, namely our own, suggests that it should be accounted for as an anthropic selection effect.
The status of the related coincidence referred to above is rather different, as it relates the same number I, not to the present value of a variable, but to a constant, namely the coefficient T * in the hyperbolic growth formula,

which provides a remarkably good order of magnitude estimate for the rate of growth Ṅ of the human species ever since our emergence a few hundred thousand years ago, when Ṅ would have been only a few people per year right up to the present time when Ṅ is not far from a hundred million people per year. The applicability of this extremely simple formula (2) for a roughly constant value T ⋆≈2×10¹¹ years was recognized about half a century ago by von Foerster et al. (Reference von Foerster, Mora and Amiot1960), and its conceivable extraterrestrial relevance was pointed out soon afterwards by von Hoerner (Reference von Hoerner1975). The fact that Ṅ is proportional to N 2 (rather than linearly proportional to N as in the ordinary exponential case) has more recently been shown to be loosely accountable for in terms of the essentially memetic nature of the process whereby technical progress provided an accelerating increase in the population carrying capacity of the planet (Kremer Reference Kremer1993; Koratayev Reference Koratayev2005). However, the reason why the Foerster coefficient T ⋆ has its particular value has remained mysterious. The motive of the present work is to show that a clue to this enigma may be obtainable from the second of the empirically observed coincidences referred to above, which is that the Foerster coefficient is given in terms of the human generation timescale τg by the order of magnitude relation

This second coincidence – which seems to be a permanent feature of the human population – provides an immediate clue to the explanation of the first coincidence (1), since it is interpretable as meaning that the decreasing population growth timescale τ=N/Ṅ has now got down to the order of magnitude its Malthusian minimum, τ≈τg, which evidently means that the Foerster phase characterized by (2) can continue no longer. The concluding section of this article will discuss the implication of our presence at this critical moment, which will be anthropically explicable if the population peaks and then declines in the not so distant future.
The main part of this article will investigate the way the second coincidence (3) may itself be accounted for by taking the analogy between genetics and memetics seriously, on the basis of the presumption that the relevant selection pressure – favouring increasing mental capability during the first phase, and increasing technological capability during the second phase – would have been sufficiently high to bring about progress at a rate that would on both cases have been proportional to the size N of the relevant interbreeding population, as explained on the basis of the simplified model of neo-Darwinian evolution that is outlined in the section ‘Simple neo-Darwinian modellization’.
Extrapolation by the seductive Verhulst model
It is to be recalled that the theory of demographic growth has a history dating back to the work of Malthus, who introduced the simplest and still the most widely used model for this purpose, namely that of the exponential type, as obtained from an evolution equation of the form

with a fixed e-folding timescale τ so that the solution will take the form

where N 0 is the population at some chosen time origin when t=0. Having pointed out that it is biologically possible in principle for the population to grow exponentially with a timescale τ that could be as short as the reproductive generation timescale τg – about 20 years in the human case – Malthus drew the conclusion that the relatively slow growth observed in practice was attributable to (typically unpleasant) causes like war, disease and particularly famine, as an ineluctable consequence of the limited availability of food and other necessities. The corollary that, as well as luck, the survivors were likely to be characterized by superior aptitudes that would often be hereditary was the basis of Darwin's theory of evolution by natural selection.
The recipe for perpetual exponential growth is still commonly sought as an ideal ‘holy grail’ by economists, despite the recognition of its unsustainability in the long run, by Malthus. The first and simplest ‘sigmoid’ model allowing for the limited availability of renewable resources was introduced by his follower, Verhulst, in the middle of the 19th century, but it took another century before attention began to be given to the need to take analogous account of the limited availability of non-renewable resources, for which a corresponding ‘peaked’ model was introduced by Hubbert.
The simple ecological model of Verhulst is based on an evolution equation of what is known as the logistic form,

for some fixed saturation value N ∞, interpretable as the maximum environmentally sustainable value of N. (For example, if one allows about an acre for a family of four, the entire land surface of the world gives N ∞≈1011.) The solution of Verhulst equation (6) will be symmetric with respect to a time t g in terms of which it takes the well-known logistic form

which shows how the upper bound N ∞ will be asymptotically approached from below. The smoothly controlled Verhulst model was originally intended for application, not to the world as a whole, but just to the newly established Kingdom of Belgium, for which it was remarkably successful. However, as an example of the more unpleasant alternatives about which Malthus had warned, in Ireland about the same time, exponential growth was terminated, not by smooth convergence to a plateau level, but catastrophically (Catton Reference Catton1980) by a famine.
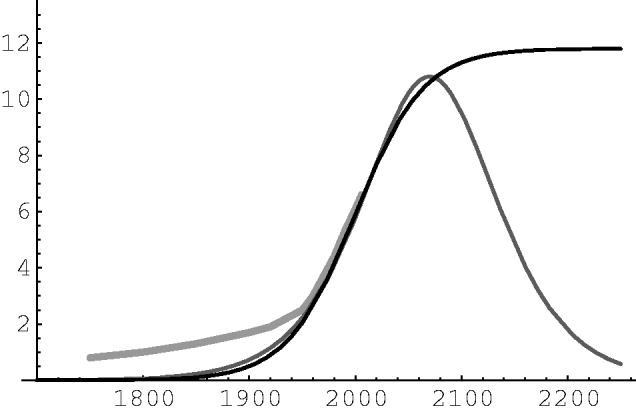
The Verhulst model is still popular for extrapolation of present data to construct demographic predictions of the kind commonly provided by U.N. and other international organizations as shown in Fig. 1. However, as the 20th century advanced, people became increasingly aware that as well as the saturation of renewable resources, another important limitation was the exhaustion of non-renewable resources.
Global population N, in units of 109, plotted against date. Thick pale curve shows known U.N. data from 1750 A.D. to 2000 A.D. Thin dark curve shows a commonly considered future extrapolation by Verhulst-type logistic model (7), for τ≃32 years, fitted to the latest observations, with inflection about 2000 A.D. Medium pale curve shows an alternative extrapolation by Hubbert-type logistic derivative model (11), for τ≃42 years, with peak time t p about 2070 A.D., as conjectured by Bourgeois-Pichat. Neither model fits the data for the past.

Population time, anthropic measure and the Hubbert model
To take account of the finiteness of non-renewable resources, it is useful to think, not so much in terms of ordinary time t, but rather in terms of population time  , meaning the total of the times lived by all the members of the population, as given by the condition that its increment d during a small time interval dt is given in terms of the relevant population size N by d=Ndt, so that its rate of increase is

This concept of the population time, as defined by (8), was introduced by Wells (Reference Wells2009) in a discussion of the implications for future demographic prospects of the anthropic principle.
The idea underlying the anthropic principle (Carter Reference Carter1983; Leslie Reference Leslie1996; Bostrom Reference Bostrom2002) is that to interpret what one observes when one emerges in the universe, one needs some idea of what might or might not be expected as far as one's personal identity and situation in space and time are concerned. For example one ought to be more surprised to find oneself to be a prince than to find oneself in the (less exclusive) category of peasants. As originally formulated for application in a cosmological context, with respect to conceivable extraterrestrial observers, the (weak) anthropic principle merely postulated vaguely that a priori probability should be democratically distributed among comparable observers. For many applications that was enough, but for other purposes one needs to clarify the question of what counts as an ‘observer’, and of how one should distribute a priori probability among observers that are not ‘comparable’. It might be consensually accepted that a prince should be considered to be comparable with a peasant, but it is clear that neither is comparable with a cat, and indeed it is not entirely clear whether a cat should be counted as an ‘observer’ at all.
To cope with such unresolved issues, it is convenient to introduce an appropriately adjustable parameter that I shall refer to as the anthropic quotient. Thus, the general purpose version that I would now advocate for the anthropic principle postulates that the a priori probability per unit time of finding oneself to be a member of a particular population is proportional to the number of individuals in that population, multiplied by an anthropic quotient  say that will depend on the kind of population involved. The relevant probability will thereby be proportional to the corresponding anthropic measure,
 , for which the differential increment will be given by
 so that its rate of increase will be

There is no loss of generality in fixing the normalization of the anthropic measure by the obviously suitable convention that be set to unity,  in the ordinary human case, with which Wells was concerned. The appropriate value of the anthropic quotient might exceed unity for conceivable superhuman extraterrestrials, but it should presumably be smaller,
 for our hominid ancestors such as homo erectus, and even more so,
 for our subsisting terrestrial anthropoid relations, such as chimpanzees (not to mention cats).
As well as being proportional to anthropic probability, in the case under consideration in the present section, that of the modern humans with  , the elapsed population time is also proportional to the amount of non-renewable resources that have been consumed, with a proportionality coefficient that depends on the nature of the resource and on the level of development of the population. In the particular context of oil extraction, it was recognized by Hubbert (of the Shell company) and other engineers involved that models of the logistic kind described above could be applicable to accumulated consumption. This implies that during a period characterized by a fixed per capita consumption rate such models would be applicable not to N as in the Verhulst case but to , which would be subject, in such circumstances, to an evolution equation of the form:

for some constant T ∞ proportional to the total amount of population time that can be lived before exhaustion of the resources in question.
As the analogue of (7), the solution of this equation (9) will have the logistic form

in which t p is a constant of integration that is interpretable as the time at which the corresponding total population

reaches its peak value, namely N p=T ∞/4τ, after which it undergoes a smooth transition towards an asymptotic state of exponential decay.
A scenario characterized by a demographic transition towards exponential decay in a manner similar to that of the Hubbert model has also been predicted on the basis of a rather different mechanism by Bourgeois-Pichat (Reference Bourgeois-Pichat1988). In scenarios of the traditional kind, private investment in child raising is motivated as an insurance against destitution in old age, and is affordable by the majority because education is either neglected or – in more civilized societies – provided at public expense. On the contrary, in a Bourgeois-Pichat-type scenario, the need for such (private) insurance is reduced by public support for the elderly (who will be relatively numerous and politically preponderant in a numerically declining population) while on the other hand the maintenance of a high standard of living requires a level of education that makes child raising unaffordable – even with public assistance – for many people. A population implosion of the kind that ensues in such circumstances has already been observed on a local scale in some of the most ‘developed’ countries, starting with (West) Germany, but the supposition by Bourgeois-Pichat that this will also happen in the rest of the world has not yet been confirmed.
Although – for such diverse reasons – a Hubbert-type model may conceivably provide an adequate description of the future, it can be seen from Fig. 1 that it fails completely for describing the global population in the past. As – like a Verhulst model – its initial comportment is that of exponential growth, a Hubbert-type model vastly underestimates the population that was actually present in the distant past. One of the reasons for this failure is, of course, that the assumption of a constant per capita consumption rate did not apply: on the contrary, before the industrial revolution the global consumption of non-renewable resources was negligible.
As well as being incompatible (albeit for other reasons) with what is known about the past, the Verhulst-type extrapolation is much less credible, on anthropic grounds, than its Hubbert analogue as a description of the long-term future. In order for a model to be plausible, our situation within it should not be too unlikely a priori. According to the anthropic principle a general (necessary, but not necessarily sufficient) requirement for plausibility of a demographic model will be a finitude requirement to the effect that the total human population time of the future should not greatly exceed that of the past and vice versa. This condition is evidently satisfied by a scenario of the kind foreseen by Bourgeois-Pichat (Reference Bourgeois-Pichat1988) as represented by the Hubbert-type model in Fig. 1, for which it can be seen that the population time (representing the area under the curve), and hence the corresponding anthropic measure, converge to the finite limit T ∞, which is only about twice the value attained already. However, for the Verhulst-type model, the population time will diverge linearly according to a formula of the asymptotic form ∼N ∞t. Thus, according to what is known as the ‘doomsday argument’ (Leslie Reference Leslie1996; Bostrom Reference Bostrom2002; Wells 2009) such a Verhulst-type extrapolation can be credible only locally, subject to the proviso of being truncated by a ‘doomsday’ cut-off in the not too distant future.
For the purposes of demographic prognostication, the basic anthropic finitude condition to be satisfied is that the total human population time of the future should not greatly exceed that of the past. In order to apply this principle we therefore need a reliable estimate of how much human population time has elapsed so far. Such an estimate cannot be provided by foregoing logistic models, but is obtainable from the Foerster model as recapitulated in the next section.
The Foerster model: a good fit for the past
It was reasonable for economists and social scientists such as Verhulst and other early followers of Malthus, to seek timescales of the order of a human lifetime, or at most of the duration of human history, for the formulation of their demographic models. When simple models involving such a single such timescale τ were found to be inadequate, they resorted (Cook Reference Cook1962) to elaborate multi-timescale models with too many adjustable parameters to be of much help for prediction. It was hard to see that the available demographic data were after all describable very well in terms of just a single timescale, T ⋆, because the required value is literally astronomical. It is therefore unsurprising that the first to have recognized it should have been not an economist, or even an ecologist, but a physicist, Heinz von Foerster (1911–2002) from Vienna, who noticed (Foerster et al. Reference von Foerster, Mora and Amiot1960) that the available demographic data could be fitted rather well by a formula of the simple hyperbolic form

which is exactly what is obtained from the evolution law (2) derived above, subject to the specification of a divergence time t d that arises as a constant of integration.
The validity of this formula – as a fairly good approximation with a roughly constant value of T ⋆ all the way from palaeolithic to modern times – did not become widely known until relatively recently, and is something I observed independently, before finding out that it had already been pointed out by von Hoerner (Reference von Hoerner1975), and before that by von Foerster et al. (Reference von Foerster, Mora and Amiot1960), who estimated that the remaining time before the singularity was then barely 70 years. More than half that time has since been used up, but the remarkable – and rather alarming – fact is that significant deviation from the Foerster formula has not yet become clearly observable.
Theoretical explanations of the acceleration from an initially slow start (what has been referred to by Renfrew (Reference Renfrew2008) as the ‘sapient paradox’) and more particularly of the quadratic form, Ṅ∝N 2 of the relevant growth law (2), have been proposed by Kremer (Reference Kremer1993) and Koratayev (Reference Koratayev2005) in terms of theories of technological development along the lines of the kind described in the section 7 ‘on The Memetic break through’, but with the coefficient T ⋆ introduced as an adjustable parameter to be fixed empirically by matching to what is observed. Substitution of the value I≈1010 with τg≃20 years in formula (3) gives a result that is in good agreement with the more precise value

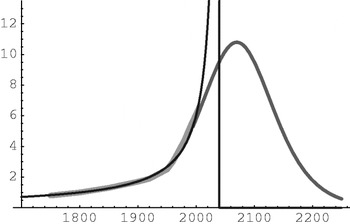
that I obtained, as shown in Fig. 2, by matching (12) to the official statistics up to 2000 A.D. (U.N. Population Division 1999) with the correspondingly adjusted value of the constant of integration – namely the divergence date – given by

Population N, in units of 109, plotted against date. Thick pale curve shows U.N. data for period before 2000 A.D. Medium pale curve, after that date, shows Bougeois-Pichat-type extrapolation given by a Hubbert model, as in Fig. 1. Black curve shows Foerster model (12) for T ⋆≃24×1010 years, with divergence date t d≃2040, which agrees well with data before 2000 A.D.

It is to be remarked that on the basis of fine tuning to the demographic statistics of their own time in the short run, von Foerster et al. (Reference von Foerster, Mora and Amiot1960) and von Hoerner (1974) originally suggested a ‘doomsday’ time that was even nearer, t d≃2025 A.D., in conjunction with a fixed timescale that was correspondingly reduced, T *≃200 Gyr. However, the rather longer fixed timescale (13) and the rather later divergence time (14) seem to give a better match in the long run, not just for more recent years, but also for the more distant past, through medieval times. For even earlier (classical, bronze age, neolithic and palaeolithic) times (Cook Reference Cook1962; Biraben Reference Carter1983) the uncertainties are anyway so large that the differences between such alternative adjustments are not statistically significant.
The measure of the Foerster phase
According to (12) and (13), the size of the global population at the time, t 1 say, when our own species first emerged, a few hundred thousand years ago, would have been given roughly by N 1≈106 an order of magnitude that is consistent (Kremer Reference Kremer1993) with the little that is known (Biraben Reference Biraben2003) about that epoque. Much of that total would not have been directly ancestral to ourselves, but would have included various ‘erectus’ and Neanderthal populations, as well as many fragmented ‘sapiens’ groups that subsequently died without leaving any descendants (which is why the ‘effective’ ancestral population size obtained (Wade Reference Wade2007) from the analysis of the modern human genome is very much smaller, only a few tens of thousands). In terms of this initial value N 1 the subsequent measure, attributable almost entirely to our own species, will be expressible as

which means that N/N 1 grows as an exponential function, not of ordinary time but of the population time ratio /T ⋆.
Up to the present time the expansion factor N/N 1 is about 104≃e10, so the ordinary (decimal) logarithm of the ratio is log{N/N 1}≃4, and the corresponding natural logarithm is

so it follows from (13) and (15) that the population time measure of the whole of our ‘sapiens’ species until now – as required for the application (Wells 2007) of the ‘doomsday argument' – is given roughly by ≈2.4×10¹² human years.
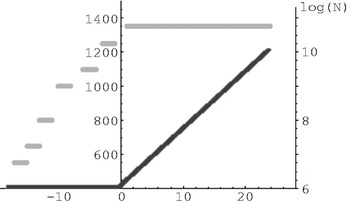
The linear growth of log{N} from about 6–10 is plotted in Fig. 3 against the hominid population time , as roughly measured from an origin at the (calender) time t 1 when our ‘homo sapiens’ species first emerged a few hundred thousand years ago.
Evolution of the genus ‘homo’ in terms of population time , as measured in Giga centuries, from an origin at the emergence of our ‘sapiens’ species, when the Foerster phase began. Schematic (order of magnitude) plot of logarithmic population size, log{N}, is shown by thick firm line. Brain size in cm3 is indicated, by thick pale horizontal segments, for successive representatives of the genus homo, namely the species robustus, habilis, ergaster, Java (archaic erectus), erectus, Heidelberg, and finally sapiens.

Ever since the emergence of the ‘homo’ genus, about a couple of million years earlier, it is thought (Biraben Reference Biraben2003) that the total population would have fluctuated about a roughly fixed value of the order of a million, so the population time would have been roughly proportional to ordinary time t: a hundred thousand years of t would have represented about a giga century of . It is instructive to measure human population time in centuries as that gives a rough indication of the number of people who lived complete lives. (The number of people who lived at all would of course be considerably higher, as life expectation was low, more comparable with a human generation timescale of only about 20 years, so a single human century would have typically represented as many as five distinct ‘souls’. However, most of those five would have died before emerging from childhood, while only about one of them would have survived long enough to lead a full adult life.).
Although the total population size for the genus ‘homo’ did not change much during the period ≲0 (before the emergence of our ‘sapiens’ species) the nature of the population underwent rapid evolution (driven, presumably, by intraspecific competition) of which the salient feature was the remarkably rapid increase in brain size, as indicated by cranial capacity.
The growth (Falk Reference Falk1998; Holloway Reference Holloway2001) of brain size, as measured in cm3 is plotted in Fig. 3 for successive species, starting with homo robustus (which coexisted with survivors of the previously dominant hominid genus, namely, Australopithecus). The figure shows that after continuing at a rather high and steady rate, so long as was negative, this brain growth came to a rather abrupt halt, having reached a value of about 1400 cm3, not long after the time when systematic population growth got under way. During the period ∼0, namely that of the Foerster phase, brain growth was superseded by the population growth that took off – at a comparable rate – after the emergence of the two latest species of homo, namely our own ‘sapiens’ species and the less long-lived Neanderthal species (which is not indicated separately in Fig. 3, because it was effectively overlapped, both in brain size and duration, by ‘homo sapiens’).
As well as the remarkable, albeit approximate synchronization of the end of brain growth with the acceleration (if not quite the beginning) of population growth, Fig. 3 also features a rather striking numerical coincidence, which is that with respect to population time (not ordinary time) the brain growth is characterized by a timescale, T that is of the same order of magnitude as the timescale T * characterizing population growth according to (2).
It is shown in the following sections how these features provide a clue for understanding the previously remarked coincidence (3) relating T * to the genome information content I. The essential link is that the latter is obviously involved in the genetic evolution process responsible for the brain growth characterized by T.
Simple neo-Darwinian modellization
Although satisfactory for the description of large bodies, classical physics as developed before the 20th century was inadequate for the description of smaller systems, which need allowance for atomic substructure and the use of quantum mechanics. In an analogous way, classical Darwinian theory – treating evolution as a continuous process – is adequate only for very large populations. A less naively simple description is needed for small- and medium-sized populations, meaning those in which

where N u is the replication reliability number, defined as the number of successive generations over which one would expect the genetic information at a particular locus to be reliably copiable, as given in terms of the corresponding mutation rate u by

The discrete nature of genetic information was first pointed out by Mendel in Darwin's time, but it was not until after Morgan's observational discovery of the mutation process that the neo-Darwinian theory needed to allow for the finiteness of the mutation rate (Maynard Smith Reference Maynard Smith1989) was developed by pioneers such as Fisher and Wright, in terms of general principles that would presumably be valid for other life systems, which might conceivably record the relevant hereditary information in some alternative form instead of DNA, whose use in the terrestrial case was subsequently discovered by Watson and Crick. The terrestrial system uses a four-letter code so that the information content at each base position on the chain is only 2 or 3 bits depending on whether the DNA chain is duplicated, in the manner that is normal for the eukaryotic cells of multicellular plants and animals. This means that the total number,  say, of base positions is of the same order of magnitude as the total genome information content, I≈, a relation that might be expected to hold also for conceivable extraterrestrial systems using some alternative to DNA.
In any such system, if the rate u of mutation per replication at a base position of interest is typical, then knowledge of the total mutation rate for the whole genome, namely μ=u, will provide the estimate

Since, in an initially well-adapted species, random mutations will be seldom favourable and often fatal, the mechanism of replication must be reliable enough to ensure that μ is not too large compared with unity, while on the other hand there is no advantage in getting a much lower value. It is therefore to be guessed, and seems to be observed (Maynard Smith Reference Maynard Smith1989) that under natural (as distinct from laboratory) conditions μ will typically have a value that is large, but not extremely large, compared with unity.
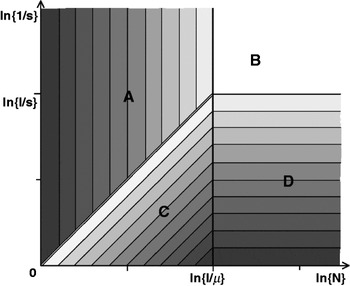
In addition to this relatively circumscribed mutation rate u the rate of evolution at a particular base position will be predominantly governed by two other much more widely ranging parameters that are the size N of the pertinent interbreeding population and the value of the relevant Darwinian selection coefficient s, whose possible values are plotted logarithmically (with respect to the scale determined by the approximately fixed value of u) in Fig. 4 (which corrects the corresponding figure in my earlier work (Carter, Reference Carter1983) where the – then less well known – effect of fluctuations in small populations was underestimated).
Contours for timescales of random fluctuations (in domain A) and of steady evolution (in domains B, C, D) in a rough logarithmic plot of the inverse of the Darwinian selection coefficient s against population number N, with the scale fixed by the inverse of the relevant mutation rate, u=μ/I, using lighter shading for longer timescales. The domains for which the selection pressure is too weak to be effective are A, the regime of genetic drift in a small population, and B, the regime of genetic equilibrium in a large population. The domains of strong selection pressure are C, the neo-Darwinian regime, with evolution rate limited by rarity of mutations in a small population, and D, the classical Darwinian regime, in which the population is so large that the required mutations are always available.

The relative values of the three independent parameters or the three corresponding numbers, namely the replication reliability number N u=1/u (representing the number of generations over which the base can be copied without substantial risk of error), the Darwinian selection number defined as N s=1/s (indicating how many generations will be needed for selection to have a substantial effect), together with the relevant (interbreeding) population size N, will determine four qualitatively different regimes, labelled A, B, C and D in Fig. 4.
The simplest is the classical Darwinian regime, labelled D, for which evolution from an ‘old’ state to the favoured ‘new’ state at the base position in question will proceed with a timescale given roughly in terms of the relevant generation timescale τg simply by

This applies not only to evolution of the state (what geneticians call an allele) at a single base position but also to parallel evolution at many base positions, provided there is a sufficiently effective mechanism for the interchange of genetic information, which is of course what is achieved by sexual reproduction (instead of simple cloning). In order for (20) to hold, it is however necessary, not only that the mutation rate should be high enough to avoid delay in the provision of the raw material for selection that requires

but also that the population should be large enough for the effect of random fluctuations to be negligible that which requires

an inequality that is seldom satisfied by large animal populations. Assuming that μ is large but not extremely large compared with unity, the coincidence (1) can be interpreted as telling us that the human population actually is marginally large enough to satisfy this condition now, but it was far too small to do so at the time with which we shall be concerned, when our ‘homo sapiens’ species first emerged.
The next simplest possibility is that of the mutation controlled regime, labelled B, for which the large population condition (22) is satisfied in conjunction with the selective neutrality condition

which means that Darwinian selection is too weak to be relevant. In this case, replacement of the ‘old’ state by the ‘new’ one will proceed with timescale given directly by the mutation rate as

until the attainment of a mixed equilibrium for which the rate of reverse mutations balances that of forward mutations.
The situation is more complicated in the fluctuation-dominated neutral regime labelled A, of which the importance was pointed out by Kimura. This regime is characterized by the weak selection condition

in conjunction with small population condition (17). In such circumstances, for the usual Fisher–Wright kind of random breeding model, the number n of individuals characterized by the ‘new’ state will follow a random walk with step size equal to  . Starting from a single ‘new’ type individual created by a mutation, the probability that such a walk will lead to a complete take over, n≃N, of the ‘new’ type (instead of leading to its extinction) is only ≈1/N, and if that occurs this ‘fixing’ process will take place with a fluctuation timescale

Since the total rate per generation of occurrence of new mutations in the population will be N u, and the chances of ‘fixing’ are of the order 1/N – a factor overlooked in my earlier discussion (Carter Reference Carter1983) – it follows that the rate per generation of establishment of new mutations will simply be u. This means that a timescale τu of the relatively long value (24) will separate random events whereby a fluctuation on the shorter timescale τf will take the entire population from the ‘old’ to the ‘new’ state or back again.
The remaining possibility is the regime labelled C, which is that of what Gillespie (Reference Gillespie2004) refers to as ‘positive selection’ in a small population. This regime (the one most relevant for our present purpose) is characterized by the strong selection condition

in conjunction with small population condition (17) (which characterized the human population until very recently). In such circumstances, starting from a single ‘new’ type individual, the number n of such individuals will undergo a random walk as in the regime A, but in order for the new type to be ‘fixed’ it is not necessary for such a walk to reach a value n≃N, but just to survive longer than the timescale τs needed for the selection effect to become substantial. This means reaching a value n≃N s, which will occur with proportionally higher probability, of the order s. As the total rate per generation of occurrence of new mutations in the population will be N u the rate per generation of establishment of new mutations will be N us. This means that the evolution from the ‘old’ state to the favoured ‘new’ state at the base position in question will proceed with a timescale given roughly by

As remarked above, the total mutation rate μ in (19) μ can be expected to be large but only moderately large compared with unity, while s can be expected to be at most moderately small compared with unity, so the condition

can be expected to hold as a rough upper limit on the rate of genetic evolution under natural conditions. It therefore follows from (28) that the evolution at the maximum allowable rate will therefore be characterized by a timescale τ given by the formula

The way the foregoing formulae depend on the population size N suggests that instead of using ordinary time t it will be informative to reformulate them in terms of population time as defined by (8). This means that the ordinary timescale τ in (28) will correspond to a population timescale T that is defined as

This population timescale for neo-Darwinian evolution will be given, as a rough estimate, by

and it will have a naturally attainable minimum given according to (30) by

According to the palaeological evidence (Falk Reference Falk1998; Holloway Reference Holloway2001) as presented in Fig. 3, hominid cranial expansion was characterized, before the emergence of our own species, by a timescale τ – of the order of a few hundred thousand years – that actually does, roughly satisfy the rapid evolution condition (30), so that (33) does indeed hold in this case. It still, however, remains unclear just how or why this natural limit was attained.
The memetic breakthrough
The Foerster formula (2) can be interpreted as telling us that, as an empirically observed fact, the timescale

characterizing human population growth has been given in the order of magnitude simply by

It is evident that the mechanism for this growth has been the occupation of a progressively wider range of ecological niches that have been opened up the introduction of new memes of a technical nature, such as those involved in the use of fire, and subsequently of cloths, followed more recently by those involved in crop cultivation; from the invention of the plough to the latest developments of genetically modified seeds.
It is understandable (Koratayev Reference Koratayev2005) that the timescale for this progress should have evolved roughly in inverse proportion to the number of people involved, because the rate of innovation will presumably be proportional to the number of inventive people, who will constitute what can be expected to be a roughly fixed proportion of the total population so long as the intrinsic genetic nature of the population remains the same. What has not been previously explained is why the proportionality coefficient T * in (35) has the particular value is characterized by the coincidence (3).
A formula of (35) would presumably have been applicable to memetic progress (such as the archaeologically observed improvements in stonechipping techniques), even before such progress was sufficient to enable substantial population increase according to (34) (not just the fitness needed for survival in intraspecific competition), and thus long before the emergence of our own ‘homo sapiens’ species, but with a coefficient T * that would not have been constant but variable, as a function of the changing capabilities of the earlier hominids involved, of which the most important example is that of ‘homo erectus’, the predominant species about a million years ago. During this first phase of hominid evolution the palaeologically measurable increase in hominid brain size (Falk Reference Falk1998; Holloway Reference Holloway2001) at the rate ultimately characterized by (33), as shown in Fig. 3, would presumable have been accompanied by a corresponding increase in mental capabilities. This genetic progress would in turn have brought about a corresponding decrease in the timescale T * in the formula (35) for the rate of memetic progress.
Effacement of genetic progress by memetic cross-linkage
It can now be seen that the coincidence (3) simply tells us that the decrease in T * came to a halt when this timescale reached the magnitude T given by (33), in other words when the rate of memetic progress overtook the rate of genetic progress. It thus transpires that this memetic break-through is the event that marked the origin of our own species, ever since – according to the palaeological record as shown by Fig. 3 – there has been a halt not only in the decrease in T * but also in the development of other, more directly observable, genetic features of which the most directly observable is brain size.
In the case of humans, as in the breeding of domestic animals, starting with that of dogs from wolves, changing proportions of pre-existing genes have brought about many minor variations giving rise to what might be described as subspecies. Nevertheless, subsequent to the emergence just a few hundred thousand years ago of the particular hominid clad to which we belong, there does not seem to have been any qualitative development of a nature so fundamental as to have required many new mutations. That is what justifies the consensus that all the members of this clad should be classified as belonging to one and the same species, namely ‘homo sapiens’.
This remarkable conspecificity calls for comment. Although this clad of ours is relatively young in terms of ordinary time t, it can be seen from Fig. 3 that it is already relatively old in terms of population time , as a consequence of the tremendous population expansion that has taken place in rough accordance with the Foerster formula (2), initially at the expense of other clads (notably the Neanderthals) and later just by occupation of the increasing range of ecological niches made available by memetic technical progress. According to (15) and (16), the population time that has elapsed since the emergence of ‘homo sapiens’ is about 10 times larger than the population timescale of order T * that suffices for significant brain growth in the immediately preceding period. The absence of substantial genetic progress since then is therefore something that requires explanation.
To understand the genetically stagnant nature of the memetically dynamic Foerster phase over such a long population time,

it is instructive to reflect on the purpose of sex, which functions by breaking the linkage between different sites on the genome. Non-sexual reproduction is common in microbes and possible, not just by laboratory cloning, but even under natural conditions, for large animals such as birds, which can occasionally pass on their genes by virgin birth from unfertilized eggs. However that has the disadvantage of slowing evolution by requiring that selection of independent mutations at different sites should be carried out successively, not simultaneously as in the usual sexual case.
The question of whether selection is successive or simultaneous arises also for memes. Some kinds of memes are transmissible independently so as to be simultaneously selectable, like genes in the sexual case. However, many other kinds tend to be linked together in packages within which weakly favoured innovations will be held up pending imposition of those that are more strongly favoured. Furthermore, as well as the possibility of memes being linked to other memes, it is also common for memes to be cross-linked with genes. For example, one's preference, as a sporting participant or spectator, for the tennis meme rather than the golf meme, is likely to be independent of one's preference, at table, for the fork meme rather than the chopstick meme. However, the latter is likely to be strongly linked with one's genetic inheritance, because (unlike sports that are taken up later in life) eating techniques are usually learned in infancy from one's own parents.
Although memes (such as the use of stones for breaking nuts or mollusc shells) are commonly utilized by other mammals and birds, ours is the first – and so far the only – species for which memes have become much more important than genes in the competition for survival. Since the breakthrough when this stage of memetic dominance was reached, there will have been a strong tendency for selectively favoured memes, to have carried with them, as involuntary ‘hitchhikers’, whatever genes happened to be present in the subpopulation in which the favoured memes were first invented. Such accidentally favoured genes will thus have an unfair advantage over other genes (such as those for increased brain size) that might otherwise have been favoured by systematic selection. Thus, the signals indicating the intrinsically preferred direction of genetic progress (notably that of greater braininess) will have been effaced by memetic noise that which brings about random genetic fluctuations similar to those that would occur anyway for the very small populations of the regime labelled A in Fig. 1.
It seems reasonable to conclude that such effacement of genetic evolution by memetic ‘hitchhiking’ noise is what is responsible for the evident lack of substantial genetic progress during the long population time T that has elapsed since the memetic breakthrough at the vaguely defined ordinary time, t 1, when our species first emerged. It is for this reason that evolutionary divergences since the original emergence of ‘homo sapiens’ may occasionally have been sufficient for qualification of temporarily isolated descendant populations (such as that of the Australian continent) for classification as subspecies, but never sufficient for their qualification as fully distinct species.
The straightforward logical explicability of this well-known characteristic of our own terrestrial case, and of the concomitant constancy of the Foerster coefficient (without recourse to ad hoc hypotheses or reference to special circumstances such as climate variations) suggests that these features are not peculiar to our particular example, but also relevant in an analogous manner, mutatis mutandis, to other conceivable extrasolar life systems.
Conclusions and implications
To account for the extraordinary sequence of events whereby civilizable mankind emerged from the mammalian primate family, it is common to seek explanations in terms of particular circumstances such as climate change in the neighbourhood of the African rift valley. However as such incidental environmental fluctuations had long been going on at various locations on the drifting continents without producing comparable consequences, it is reasonable to look for the essential reasons elsewhere. The intention of present study has been to concentrate rather on long-term tendencies (averaged over such incidental fluctuations) that may be explicable as generic processes that could be responsible for the rise of analogous civilizations in extrasolar planetary systems.
This work has made some headway in the elucidation of the way genetic evolution – particularly brain expansion – was superseded by memetic technical progress – shortly after attainment of the level needed for significant expansion of the hominid population – when our own ‘sapiens’ species emerged a few hundred thousand years ago. It transpires that this ‘memetic breakthrough’ was of a causally predetermined nature, largely independent of special circumstances (such as climate variations) with the implication that this was not one of the hard steps referred to in the introduction, and that other civilizations in extrasolar planetary systems might have originated in a similar manner.
What remains as a mystery is the process whereby the preceding phase of very (maximally) rapid brain evolution was initiated, a few million years ago. That transition – marking the origin of the ‘homo’ genus – stands out as a plausible candidate for hard-step status, meaning that the a priori odds may have been against its occurrence in the available time window. Whatever its cause, the maximally rapid nature of this evolutionary brain expansion process accounts for the observed coincidence (3) whereby the relevant Foerster timescale T * can be roughly accounted for as the product of the generation timescale τg with the genome information content I.
The other coincidence (1), namely that the population size N has reached that order of magnitude now, therefore, simply means that we are now in the transition stage, characterized by Nτg≃T *. This is when the Foerster phase of hyperbolic population expansion must end, because the expansion timescale N/Ṅ has fallen below its Malthusian minimum, namely the generation timescale τg. Since modern life expectation has risen to about three times the generation timescale τg the total population time lived by the witnesses of this transition can therefore be estimated as about 3T *. This is nearly a third of all the population time lived by humans during the Foerster phase that has just come to an end, since our estimate (36) for the latter is only about 10T *, which accords with the supposition that our status as members of this class of witnesses is not particularly exceptional. However, according to the anthropic principle that supposition also requires that the future population time to be lived by humans should be subject to a bound of the same order of magnitude, about 10T *.
This anthropic bound – a few tens of giga centuries – on the future population time is automatically satisfied by the exponentially decaying Hubbert-type extrapolation shown in Fig. 2, but it is consistent with a short-run extrapolation of the more commonly considered Verhulst-type shown in Fig. 1 only if its monotonic rise is subsequently terminated by a ‘doomsday’ cut-off of the kind envisaged by Leslie (Reference Leslie1996) within a century or so at most. The danger of mutual extermination by thermonuclear weapons seems lower today than it did during the cold war (Shute Reference Shute1957), but the likelihood of a man-made ecological catastrophe (Carter Reference Carter1983) seems as high as ever. It is, however, to be emphasized that the anthropic bound applies neither to the number of individual lives or ‘souls’, which could be relatively large if the average life expectation again becomes as short as it was in the past, nor – as emphasized by Wells (Reference Wells2009) in his revision of earlier reasoning by Gott (Reference Gott1993) – to the ordinary time t of survival of our species, which could be very long if the population size becomes sufficiently low.
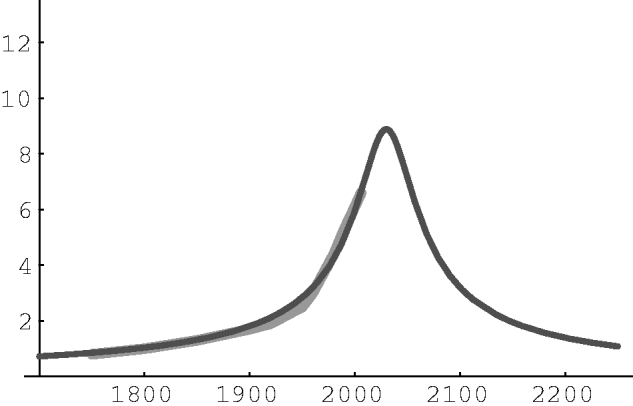
The admissible time duration of our species could extend as far in the future as it did in the past (hundreds of thousands of years) if, after passing through a peak in the near future, the population undergoes a decline in a manner that mirrors its previous rise. The simplest plausible example of such a prolongation is provided, as shown in Fig. 5, by a prescription of the canonical form

in which the time is calibrated, not with respect to a Foerster-type divergence date t d, but with respect to a moment of time symmetry at a new critical date t c when the population passes through a smooth peak with width characterised by the generation timescale τg.
Global population N, in units of 109, plotted against date. Thick pale curve shows U.N. data up to 2000 A.D. Medium curve shows how data is well matched by canonical model (37), with T *≃24×1010 years, as for the Foerster model in Fig. 2, but with peak about 2035 A.D., and with smoothing timescale τg=27 years. The population time T (area under the curve) will ultimately grow only very slowly (as logarithm of ordinary time t) so cut-off can be postponed until distant future.

The population decline in a scenario of this canonical type would have to be rather rapid to begin with, but it would soon level out so as to become comfortably imperceptible. Such a model might reasonably be chosen as a target of long-term public policy aimed at coping smoothly with problems of consumption of non-renewable resources. However, to fulfill the anthropic prediction, if history is a reliable guide, it is more likely that monatonic growth of the global population will go on until it is terminated discontinuously by an overshoot catastrophe (Catton Reference Catton1980) of the kind exemplified in the 19th century by the Irish potato famine.