INTRODUCTION
Carbon dioxide (CO2) is a major greenhouse gas in the atmosphere, with its mixing ratio having increased to 416.5 ± 1.8 ppm in 2021 (GMD-ESRL 2021). To mitigate global warming, the 2015 United Nations Climate Change Conference in Paris (COP 21) reached an agreement among nations stating that: Global temperatures should not increase by more than 2ºC, and we should try to limit it to 1.5ºC, with atmospheric CO2 concentration limited to 450 ppm. Therefore, the room left to accommodate the agreed-upon limits for the atmospheric CO2 concentrations and global temperatures are approximately 33 ppm and 0.9ºC, respectively.
The global annual increase in atmospheric CO2 primarily results from fossil fuel emissions (Keeling Reference Keeling1993; IPCC Reference Solomon, Qin, Manning, Chen, Marquis, Averyt, Tignor and Miller2007). Therefore, it is crucial to quantify the increased atmospheric CO2 that derives from fossil fuel emissions. Traditionally, the magnitude of CO2 emissions in China is estimated by the quantities of fossil fuel consumption together with the emission factors, and its uncertainties range from 3% to 50% (Marland et al. Reference Marland, Boden, Andres, Brenkert and Johnston2003; Gregg et al. Reference Gregg, Andres and Marland2008; Ciais et al. Reference Ciais, Paris, Marland, Peylin, Piao, Levin, Pregger, Scholz, Friedrich, Rivier, Houwelling and Schulze2010). Radiocarbon (14C) is a unique tracer for the identification of atmospheric CO2 emitted from fossil fuels (Levin et al. Reference Levin, Kromer, Schmidt and Sartorius2003), because 14C is totally depleted in fossil fuel, compared to the contemporary atmosphere. It was estimated that 1 ppm CO2ff (fossil fuel CO2) emitted to the atmospheric CO2 level of 380 ppm (in 2005) will result in a decrease of ∼2.8‰ for Δ14C (Turnbull et al. Reference Turnbull, Miller, Lehman, Tans, Sparks and Southon2006).
The history of CO2ff tracing by 14C began with Hans Suess who documented a progressive lowering of atmospheric 14C in tree rings in 1955, due to the widespread burning of fossil fuels (Suess Reference Suess1955), and later it was termed as the Suess effect. In 1957, Thomas Rafter noted a sudden increase in atmospheric 14CO2 associated with nuclear weapons testing (Rafter and Fergusson Reference Rafter and Fergusson1957). In 1980, Ingeborg Levin separated the atmospheric CO2 into background CO2 and CO2ff , and quantified the atmospheric CO2ff concentrations with 14C in Mannheim, Germany (Levin et al. Reference Levin, Munnich and Weiss1980). Monthly CO2ff variations were traced in 1989 at Schauinsland and in Heidelberg, Germany (Levin et al. Reference Levin, Schuchard, Kromer and Munnich1989). Later, additional CO2 sources (mainly biological sources) were included (Zondervan and Meijer Reference Zondervan and Meijer1996; Levin et al. Reference Levin, Kromer, Schmidt and Sartorius2003; Turnbull et al. Reference Turnbull, Rayner, Miller, Naegler, Ciais and Cozic2009). This tracer has been used to study the spatio-temporal variations in CO2ff (Kuc et al. Reference Kuc, Rozanski, Zimnoch, Necki, Chmura and Jelen2007; Riley et al. Reference Riley, Hsueh, Randerson, Fischer, Hatch, Pataki, Wang and Goulden2008), to compare the trends between top-down Δ14CO2 observation-derived emissions and bottom-up inventory-derived emissions (Newman et al. Reference Newman, Xu, Gurney, Hsu, Li, Jiang, Keeling, Feng, O’Keefe and Patarasuk2016), and to compare CO2 national emissions based on atmospheric CO2 and Δ14CO2 measurements and inverse modeling with global CO2 inventories (Basu et al. Reference Basu, Lehman, Miller, Andrews, Sweeney, Gurney, Xu, Southon and Tans2020).
As the largest CO2 emitter globally, China accounted for approximately 27% (2.67 Pg C yr-1) of global fossil fuel carbon emissions in 2017 (Le Quéré et al. Reference Le Quéré, Andrew, Friedlingstein, Sitch, Hauck, Pongratz, Pickers, Korsbakken, Peters and Canadell2018). Due to the economic development of China, fossil fuel carbon emissions began to increase from 55.2 million tons of standard coal in 1978 to 412.5 million tons of standard coal in 2019, with a rapid increase since 2000 (NBSC, 2020). Now, China faces the dual problems of carbon emission reductions and air pollution mitigation. There are more than 600 cities in China. To determine comprehensive characteristic variations of urban CO2ff in China, we carried out CO2ff tracing studies during 2011–2016 in 15 representative Chinese cities (Zhou et al. Reference Zhou, Wu, Huo, Xiong, Cheng, Lu and Niu2014, Reference Zhou, Niu, Wu, Xiong, Hou, Wang, Feng, Cheng, Du and Lu2020; Niu et al. Reference Niu, Zhou, Wu, Cheng, Lu, Xiong, Du, Fu and Wang2016b; Hou et al. Reference Hou, Zhou, Cheng, Xiong, Du, Niu, Yu Xia and Lu2020). Additionally, short-term CO2ff studies were carried out in Beijing and Guangzhou by Xi et al. (Reference Xi, Ding, Fu, Zhou and Liu2011) and Ding et al. (Reference Ding, Shen, Yi, Wang, Ding, Fu and Liu2013), respectively. The purposes of this paper are to review the progress in CO2ff traced by 14C in Chinese cities, including the spatio-temporal variations, source attribution and transport, and correlations with PM2.5. Additionally, this paper makes a preliminary comparison of top-down measured CO2ff with bottom-up inventory-derived CO2ff .
METHODS
We present a brief presentation of the method of CO2ff tracing by 14C. Details of 14C and 13C measurement are given in the Supplementary Material. Atmospheric CO2 (CO2a ) is considered to be a mixture of background CO2 (CO2bg ), biological CO2 (CO2bio ), and CO2ff , which have the Δ14C values of Δ a , Δ bg , Δ bio and Δ ff (–1000‰), respectively. The mass balance of CO2 and 14C can be represented by the following two equations (Levin et al. Reference Levin, Kromer, Schmidt and Sartorius2003; Turnbull et al. Reference Turnbull, Miller, Lehman, Tans, Sparks and Southon2006):
 $\rm{CO}_{2 \it{a}} = CO_{2\it{bg}} + CO_{2\it{bio}} + CO_{2\it{ff}} $
 $${\rm{C}}{{\rm{O}}_{{\rm{2}}a}}{\Delta _a}{\rm{ = C}}{{\rm{O}}_{{\rm{2}}bg}}{\Delta _{bg}}{\rm{ + C}}{{\rm{O}}_{2bio}}{\Delta _{bio}}{\rm{ + C}}{{\rm{O}}_{{\rm{2}}ff}}{\Delta _{ff}}$$
From Eq. (1) and Eq. (2), CO2ff can be calculated using the following equation:
 $$C{O_{2ff}} = {{C{O_{2a}}\left( {{\Delta _{bg}} - {\Delta _a}} \right)} \over {{\Delta _{bg}} - {\Delta _{ff}}}} + {{C{O_{2bio}}\left( {{\Delta _{bio}} - {\Delta _{bg}}} \right)} \over {{\Delta _{bg}} - {\Delta _{ff}}}}$$
The second term on the right-hand-side of Eq. (3) is a small bias (β) from other small sources of 14C mainly from the heterotrophic respiration and the nuclear energy industry. CO2ff bias from heterotrophic respiration will be underestimated by 0.2∼0.3 ppm during the winter and 0.4∼0.8 ppm during the summer (Turnbull et al. Reference Turnbull, Miller, Lehman, Tans, Sparks and Southon2006; Miller et al. Reference Miller, Lehman, Montzka, Sweeney, Miller, Wolak, Dlugokencky, Southon, Turnbull and Tans2012). CO2ff bias that resulted from nuclear power plants (NPP) is more than –0.25 ppm over large regions, and up to several ppm near nuclear sites (Graven et al. Reference Graven and Gruber2011; Vogel et al. Reference Vogel, Levin and Worthy2013).
To trace CO2ff concentrations using Δ14C in plant leaves and tree rings, we used the following Eq. (4). Eq. (4) is simplified from Eq. (3), with an assumption of neglecting CO2bio , due to no CO2bio data available during the plant growth. The simplification had a little (0.2∼0.5 ppm) influence on the CO2ff calculation (Turnbull et al. Reference Turnbull, Rayner, Miller, Naegler, Ciais and Cozic2009). Δ a in Eq. (4) is the Δ14C value in the plant leaves and tree rings. Details are shown in Turnbull et al. (Reference Turnbull, Rayner, Miller, Naegler, Ciais and Cozic2009), Zhou et al. (Reference Zhou, Wu, Huo, Xiong, Cheng, Lu and Niu2014), and Niu et al. (Reference Niu, Feng, Zhou, Wang, Liu, Lu, Du, Fu, Li and Mei2021).
 $$C{O_{2ff}} = {{C{O_{2bg}}\left( {{\Delta _a} - {\Delta _{bg}}} \right)} \over {{\Delta _{ff}} - {\Delta _a}}}$$
From the above equations, it can see that background Δ14C (Δ bg ) is an important parameter to calculate CO2ff . Thus, we carried out Δ14CO2 measurements for air collected at Waliguan (WLG) background station (36.28°N, 100.9°E) in Qinghai Province, Qixianling Mountain (18.70°N, 109.81°E) in Hainan Province, and Taibai Mountain (33.94°N, 107.74°E) in Shaanxi Province to determine the background level. Our atmospheric background Δ14CO2 values (Zhou et al. Reference Zhou, Wu, Huo, Xiong, Cheng, Lu and Niu2014, Reference Zhou, Niu, Wu, Xiong, Hou, Wang, Feng, Cheng, Du and Lu2020; Niu et al. Reference Niu, Zhou, Cheng, Wu, Lu, Xiong, Du and Fu2016a, Reference Niu, Feng, Zhou, Wang, Liu, Lu, Du, Fu, Li and Mei2021; Xie Reference Xie2016) were generally comparable to those from the Jungfraujoch global station (Hammer and Levin Reference Hammer and Levin2017), and were used in our CO2ff tracing study.
We used the Δ14C in different samples to trace the CO2ff concentrations in different spatio-temporal resolution studies. Generally, air bags were used in short-term (minutes to hours) sampling, molecular sieves were used in minutes to days sampling, H3PO4 solution displacements (Zhou et al. Reference Zhou, Wu, Huo, Xiong, Cheng, Lu and Niu2014) were used in long-term (days to weeks) sampling, and foxtail leaves were used to study CO2ff spatial distribution. Detailed descriptions of these various methods are shown in the Supplementary Material. As shown in Figure S1, our results show that the Δ14C data from the air bags are consistent with those of the molecular sieve, so the Δ14C data from H3PO4 solution displacements and molecular sieve, and the Δ14C data from foxtail leaves and flasks are consistent, respectively. These consistencies indicate that these methods are consistent in tracing CO2ff .
CASE STUDIES IN TYPICAL CHINESE CITIES
Cities are the hotspots of fossil fuel emissions, and about 80% of CO2ff emissions in China are concentrated there (Dhakal Reference Dhakal2009). It is difficult to carry out Δ14CO2 observations at each city due to the large number of cities in China. As mentioned in the introduction, in phase one of this study, we selected two representative cities to study the urban spatio-temporal variations of CO2ff and its sources and transport. Xi’an, an ancient capital of thirteen dynasties, has a population of ca. 10 million. It is located in the Guanzhong basin in Shaanxi Province, with the Loess Plateau to the city’s north and the Qinling Mountains to its south. Beijing, the modern capital of China, has a population of more than 20 million. This city is located in the Huabei Plain, surrounded by mountains to the west and north. The temporal CO2ff variations are presented in decreasing timescales below from yearly to diurnal.
Temporal CO2ff Variations
Yearly CO2ff Variations
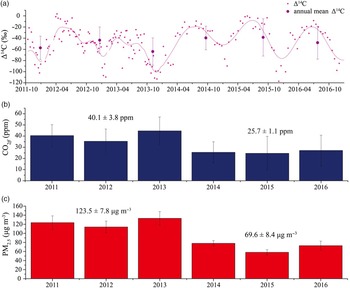
In order to study the long-term variations of fossil fuel emissions in cities, we carried out a multi-year Δ14CO2 monitoring program in Xi’an from 2011 to 2016 and found the annual CO2ff concentrations varied from 24.5 ± 15.2 ppm to 44.6 ± 12.5 ppm, with an average of 32.9 ± 7.7 ppm. The annual averages of CO2ff concentrations decreased from 40.1 ± 3.8 ppm during 2011–2013 to 25.7 ± 1.1 ppm during 2014–2016 (a decrease of 35.9 ± 6.6%) (Figure 1), due to the implementation of the Action Plan on Prevention and Control of Air Pollution in 2013 (Zhou et al. Reference Zhou, Niu, Wu, Xiong, Hou, Wang, Feng, Cheng, Du and Lu2020). The study of Zhou et al. (Reference Zhou, Niu, Wu, Xiong, Hou, Wang, Feng, Cheng, Du and Lu2020) shows the role of energy saving and emission reduction policy on atmospheric CO2ff variations in Chinese cities.
The Δ14CO2 (a), annual CO2ff (b) and PM2.5 (c) during 2011–2016 for Xi’an. The bars indicate the standard deviations. The numbers in the parts (b) and (c) were the averages of three years during 2011–2013 and 2014–2016 (data from Zhou et al. Reference Zhou, Niu, Wu, Xiong, Hou, Wang, Feng, Cheng, Du and Lu2020).

Seasonal and Daily CO2ff Variations
We found distinct seasonal CO2ff variations in Beijing and Xi’an, with winter CO2ff peaks, and summer CO2ff lows, mainly due to the low atmospheric boundary layer and high fossil fuel consumption for heating in winter (Zhou et al. Reference Zhou, Wu, Huo, Xiong, Cheng, Lu and Niu2014, Reference Zhou, Niu, Wu, Xiong, Hou, Wang, Feng, Cheng, Du and Lu2020; Niu et al. Reference Niu, Zhou, Wu, Cheng, Lu, Xiong, Du, Fu and Wang2016b). Interestingly, Zhou et al. (Reference Zhou, Wu, Huo, Xiong, Cheng, Lu and Niu2014) and Niu et al. (Reference Niu, Zhou, Wu, Cheng, Lu, Xiong, Du, Fu and Wang2016b) did not observe significant CO2ff differences between workdays and non-workday in the cities, an observation which is different from cities in developed countries (Gurney et al. Reference Gurney, Razlivanov, Song, Zhou, Benes and Abdul-Massih2012). Thus, our group’s results indicate that the weekend effect is less evident in Chinese cities.
Diurnal CO2ff Variations
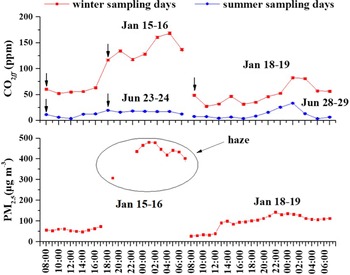
As the environment type most strongly influenced by human activities, urban regions exhibit very large CO2ff variations, especially on hourly time scales. In order to understand these variations in the diurnal patterns of CO2ff , we carried out high-temporal resolution atmospheric Δ14CO2 observations for Beijing in 2014. We observed that the CO2ff concentrations were generally higher at night than those during the daytime (Figure 2). The relatively low concentrations from the late morning through midday to 16:00 likely resulted from the attenuation of anthropogenic CO2ff emissions and enhancement of atmospheric dispersion in midday due to diurnal changes in planetary layer and wind patterns, as discussed below. The main CO2ff peak was observed from midnight to 4:00, mainly due to the low atmospheric boundary layer height at night. The small peak CO2ff concentrations during the morning and afternoon rush hours likely resulted from transportation emissions (Niu et al. Reference Niu, Zhou, Wu, Cheng, Lu, Xiong, Du, Fu and Wang2016b).
Diurnal CO2ff and PM2.5 variations in Beijing in 2014. The arrows indicate the rush hour peaks (data from Niu et al. Reference Niu, Zhou, Wu, Cheng, Lu, Xiong, Du, Fu and Wang2016b).

We found that wind direction and terrain play important roles in the urban diurnal CO2ff variations. A rapid increase in CO2ff was observed from 60 ppm to 152 ppm on a diurnal Δ14CO2 observation at the Beijing urban site in January 2014 (Figure 2) (Niu et al. Reference Niu, Zhou, Wu, Cheng, Lu, Xiong, Du, Fu and Wang2016b). The back trajectories analysis using Hybrid Single-Particle Lagrangian Integrated Trajectory model (HYSPLIT) showed that the air masses over Beijing switched from the northwest direction in the daytime (Supplemental Figure S2a) to the south direction at night (Supplemental Figure S2b). The south of Beijing was a region with massive fossil fuel consumption in January. The southerly air mass would enhance the CO2ff accumulation, together with this city is surrounded by mountains in the west and north. Thus the CO2ff was accumulated at night and showed relatively high values. The simultaneous PM2.5 concentrations showed similar variations as CO2ff (Niu et al. Reference Niu, Zhou, Wu, Cheng, Lu, Xiong, Du, Fu and Wang2016b).
Spatial CO2ff Distribution
Urban CO2ff shows spatial heterogeneity, which can be efficiently studied using Δ14C in plant leaves. This is because the plants assimilate atmospheric CO2 through photosynthesis and convert it into organic matter, so their carbon isotopic composition can be used to reflect the mean atmosphere Δ14CO2 of the growing season, the warm half of the year. Green foxtail is an annual herbaceous plant with a defined growing period. We traced the CO2ff spatial distribution in Xi’an by Δ14C values in the leaves of green foxtail, and found that downtown areas and roadways generally showed relatively high CO2ff values (Figure S3), while suburban and park sites and residential areas generally showed relatively low CO2ff values (Zhou et al. Reference Zhou, Wu, Huo, Xiong, Cheng, Lu and Niu2014). Our study indicates that the spatial CO2ff distribution in cities was controlled by the distances from the CO2ff sources.
Source Attribution and Transport of CO2ff
The policy strategies for energy saving and emission reduction can be informed by understanding the origin of CO2ff . We used a modified WRF-Chem model to simulate CO2 transport in Xi’an and the greater Guanzhong region, China. The model results showed that local inputs control both summertime and wintertime regional CO2ff distribution, while regional transport is a minor contributor (several ppm) in the central and eastern Guanzhong basin (Supplemental Figures S4a and S4b) (Feng et al. Reference Feng, Zhou, Wu, Niu, Cheng, Xiong and Li2018; Zhou et al. Reference Zhou, Niu, Wu, Xiong, Hou, Wang, Feng, Cheng, Du and Lu2020).
Furthermore, we performed a source attribution analysis for the winter CO2ff in Xi’an, combined with δ13C and emission inventory. Briefly, the contributions of fossil fuel sources and biological sources to the CO2 enhancement over background were determined by CO2 and Δ14C data. 13C was then used to separate fossil fuel sources into coal combustion and vehicle exhaust emissions, since different fossil fuels sources can have characteristic δ 13C values (Supplemental Table S1). We found that the emissions from coal combustion were the main contributor (67.4%) to the recently added atmospheric CO2, relative to background, and accounted for 72.6 ± 10.4% of the total CO2ff sources (Supplemental Figure S4c) (Zhou et al. Reference Zhou, Niu, Wu, Xiong, Hou, Wang, Feng, Cheng, Du and Lu2020). From the model and source apportionment results, we suggest that it might be an effective way to achieve carbon emissions reduction by reducing coal consumption and increasing the share of more energy efficient natural gas and low-carbon renewable energy.
EXPANDED STUDIES IN 15 CHINESE CITIES
Spatio-Temporal CO2ff Variations
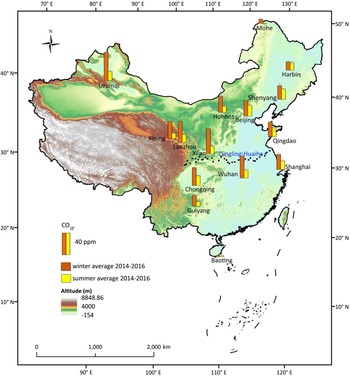
Besides the case studies in the two cities mentioned above, in phase two, we expanded the CO2ff tracing to 15 Chinese cities in the summer and winter months during 2014–2016. We found the CO2ff values in the summer were significantly (p<0.01) lower than those in winter in most cities, except in Baoting (Figure 3). The seasonal CO2ff differences resulted from the variations in atmospheric boundary layer and fossil fuel consumption for heating, while Baoting is located in the tropics on Hainan Island, with low seasonality (Zhou et al. Reference Zhou, Niu, Wu, Xiong, Hou, Wang, Feng, Cheng, Du and Lu2020). Significantly (p<0.05) higher CO2ff concentrations were observed in some northwestern cities of Urumqi (54.7 ± 2.0 ppm), Lanzhou (42.6 ± 5.9 ppm), and Xi’an (41.6 ± 2.7 ppm) in winter months than in the other cities in this study, which might result from required heating and their locations in closed and semi-enclosed topographic basins. In summer, the differences in CO2ff concentration are not significant (p > 0.05) among these cities.
Winter (orange bars) and summer (yellow bars) average CO 2ff concentrations in Chinese cities during 2014–2016. The black dotted line is the Qinling-Huaihe line, dividing China into northern and southern regions. The depth of color in the map reflects altitude (data from Zhou et al. Reference Zhou, Niu, Wu, Xiong, Hou, Wang, Feng, Cheng, Du and Lu2020; please see electronic version for color figures).

Correlations between CO2ff and PM2.5 in Chinese Cities
When we traced the CO2ff levels by Δ14C in Chinese cities, we observed that severe haze episodes were often accompanied by high CO2ff concentrations (Niu et al. Reference Niu, Zhou, Wu, Cheng, Lu, Xiong, Du, Fu and Wang2016b; Zhou et al. Reference Zhou, Niu, Wu, Xiong, Hou, Wang, Feng, Cheng, Du and Lu2020). Furthermore, we observed that the annual averages of PM2.5 concentrations in Xi’an decreased from ca.123.5 ± 9.5 µg m-3 during 2011–2013 (Cheng et al. Reference Cheng, Fan, Liu, Xiao, Guo, Li and Wang2014; Huang et al. Reference Huang, Zhang, Tang and Liu2015) to 69.6 ± 8.4 µg m-3 during 2014–2016 (MEE 2016), while the annual averages of CO2ff concentrations decreased from 40.1 ± 3.8 ppm to 25.7 ± 1.1 ppm (Figure 1). The annual averages of PM2.5 showed significant correlation (r = 0.97, p < 0.01) with the annual averages of CO2ff in Xi’an (Supplemental Figure S5). The Action Plan on Prevention and Control of Air Pollution instituted in September 2013 aimed to decrease PM2.5, and our results showed that these measures also reduced CO2ff concentrations.
We found significant (p < 0.01) correlations between PM2.5 and CO2ff in most Chinese cities (Niu et al. Reference Niu, Zhou, Feng, Feng, Wu, Cheng, Lu, Du, Xiong and Fu2018; Zhou et al. Reference Zhou, Niu, Wu, Xiong, Hou, Wang, Feng, Cheng, Du and Lu2020). As shown in Supplemental Table S2, the correlations vary among different cities. The slope of the regression line between PM2.5 and CO2ff might be partly related with the type of fossil fuel utilized. A high slope is expected in the case of coal combustion, and low slope would result from higher proportions of cleaner fossil fuels, such as natural gas (Zhou et al. Reference Zhou, Niu, Wu, Xiong, Hou, Wang, Feng, Cheng, Du and Lu2020). Thus, measures should be taken to reduce both PM2.5 and CO2ff , as China faces the dual problems of air pollution mitigation and carbon emission reductions.
TREND COMPARISON BETWEEN TOP-DOWN MEASURED CO2ff AND BOTTOM-UP CO2 EMISSIONS
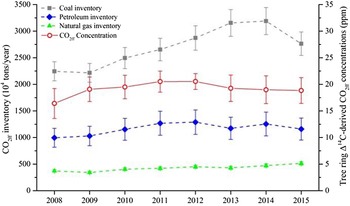
In order to compare the data derived from top-down measurements with those from bottom-up estimates, we selected Xi’an city as an example to compare the trend of CO2ff concentrations traced by tree ring Δ14C with local bottom-up CO2 emissions between 2008 and 2015, because this city is located in a basin, and regional transport has little influence on CO2ff as mentioned above (Feng et al. Reference Feng, Zhou, Wu, Niu, Cheng, Xiong and Li2018; Zhou et al. Reference Zhou, Niu, Wu, Xiong, Hou, Wang, Feng, Cheng, Du and Lu2020). Details of the tree ring Δ14C measurements are shown in the Supplementary Material. As shown in Figure 4, although there is no significant temporal variation in either the annual tree ring-derived CO2ff concentrations or the petroleum CO2ff inventory, a significant correlation (r = 0.8, p < 0.05) was found between the tree-ring-derived CO2ff concentrations and petroleum inventories. The annual arithmetic means of CO2ff concentrations generally show similar trends with petroleum CO2ff inventory. Indeed, the increase in the petroleum emissions inventory between 2008 and 2012 was 29%, similar to the 25% increase of CO2ff determined by tree ring Δ14C observations. In addition, the 10% decrease in petroleum emissions is similar to the 8% decrease in CO2ff concentration between 2012 and 2015. However, annual CO2ff concentrations were only weakly correlated with the emission inventories of coal (r = 0.4, p > 0.05) and natural gas (r = 0.3, p > 0.05). Considering the tree ring sampling site is close to a main street in Xi’an city and greatly affected by local vehicle emissions, these results suggest that the yearly variations in CO2ff based on tree ring Δ14C mainly reflect the changes of on-road transportation emissions. The inconsistencies between CO2ff concentrations and coal emissions or natural gas emissions suggest that the selection of sampling location is a crucial issue for future research. For example, sampling sites around the main coal-burning power plant are probably a reasonable option to reflect the variation of coal emissions. In addition, the combination of inverse modeling and Δ14C observations is necessary for direct validation between top-down and bottom-up methods.
Trend comparison of CO2ff concentration derived from tree ring Δ14C (open red circles; Hou et al. Reference Hou, Zhou, Cheng, Xiong, Du, Niu, Yu Xia and Lu2020) with emission inventories in Xi’an, established based on the method of Shan et al (Reference Shan, Guan, Liu, Mi, Liu, Liu, Schroeder, Cai, Chen and Shao2017). The bars represent 1-sigma uncertainties. (Please see electronic version for color figures.)

CONCLUSIONS
The following conclusions are obtained through the review of the recent progress in CO2ff tracing by Δ14C observation in Chinese cities:
-
1. There are synchronous variations in CO2ff and PM2.5 in Chinese cities, especially during haze events, which imply the feasibility of reduction of both carbon and atmospheric pollutants in China through similar policy measures.
-
2. The effectiveness of carbon emissions reduction relies heavily on policy implementation by government, especially for the reduction of coal consumption. Long-term 14C observations are useful to provide a scientific basis for verification of desired results from policy making.
-
3. The comparison between top-down observations and bottom-up inventory is important for carbon emissions reduction in China.
-
4. Carbon emissions reduction is a long-term goal in China. For future studies in China, we encourage establishing a nationwide Δ14C observation network as soon as possible and involvement of more scientists in CO2ff tracing studies that include inverse modeling of the Δ14C observations.
SUPPLEMENTARY MATERIAL
To view supplementary material for this article, please visit https://doi.org/10.1017/RDC.2022.32
ACKNOWLEDGMENTS
This work was jointly supported by National Science Foundation of China (41730108, 42173082, 41773141, and 41573136), the Strategic Priority Research Program of the Chinese Academy of Sciences (XDB 40000000, XDA23010302), National Research Program for Key Issues in Air Pollution Control (DQGG0105-02), Natural Science Basic Research Program of Shaanxi (2019JCW-20).