I. INTRODUCTION
Lead is a soft metallic solid lubricant widely used in traditional bearings. Despite its good lubricity, the toxicity of lead poses a great threat to the environment. With the increasing concern of environment preservation, lead-free material is an inevitable trend of the power metallurgy products development. Reference Tanaka, Naka, Abe, Ono, Iwata and Sugimura1–Reference Kestursatya, Kim and Rohatgi4 To achieve excellent wear resistance of the lead-free copper-based materials, Saxton Reference Saxton5 prepared Cu–Sn–Ni alloy composites and proved that Cu–Sn–Ni alloy was available to replace SAE 792 (Cu–Sn–Pb). Compared with SAE 792, Cu–Sn–Ni alloy had higher tensile and fatigue strengths, and better corrosion resistance because of the solution strengthening effect of Ni. For the purpose of replacing lead effectively, Zushi Reference Zushi, Sakai and Sugawara6 further developed a Cu–Sn–Ni–Mo2C alloy which had better wear resistance than the conventional Cu–Sn–Pb and Cu–Sn–Ni. Fathy Reference Fathy, Shehata, Abdelhameed and Elmahdy7 prepared a Cu–nano Al2O3 composite utilizing a thermos-chemical technique. This material had much improved strength and wear resistance.
All of the research above have showed improved strength and wear resistance of the composites, whereas the antifriction and antiadhesion properties are still not comparable to that of the Cu–Pb alloy for the lacking of a soft phase. Other researchers added environment-friendly solid lubricants into the copper-based materials. These lubricants can effectively replace Pb to improve the lubricity and wear resistance. Yin et al. Reference Yanguo, Xiangnan and Chizheng8 replaced lead with bismuth and silver and found that Cu–Bi–Ag material had good antifriction and wear resistance properties. Lin Reference Lin, Chang and Tung9,Reference Gardos10 showed that carbon nanotubes could improve the tribological properties of copper-based composites significantly, whereas the friction is high under low humidity or vacuum. Sueyoshi et al. Reference Sueyoshi, Yamano, Inoue, Maeda and Yamada11,Reference Sueyoshi, Inoue, Yamano, Maeda and Yamada12 prepared Cu2S/copper matrix composites by putting MoS2 into molten Cu–Sn alloy. They found that the new materials had good machinability and low friction. Kato et al. Reference Kato, Takama, Iwai, Washida and Sasaki13 found no improvement of the friction and mechanical properties of Cu–MoS2 as MoS2 reacted with the matrix and formed brittle CuMo2S3 compounds in the sintered composites. Sulfide is a common solid lubricant for its laminated structure. It is because of this structure, the materials are easy to slippage when there is a shear force between layers. So these lubricants exhibit a good property of antifriction. For the sake of finding a better sulfide lubricant, Sato et al. Reference Sato, Hirai, Fukui, Tanizawa and Usami14,Reference Sato, Hirai and Maruyama15 made Cu-based alloy containing nanosized sulfide particles using an atomizing technique. The pin-on-disc tests showed that this material had excellent friction properties especially in the high pressure condition. All these characteristics of the sulfides were necessary for lead-free copper base material. Therefore, the sulfides were widely used in surface modification of typical friction parts like gears, bearings, and piston-cylinder, Reference Wang, Xu and Liu16–Reference Kang, Wang, Wang, Xu, Liu and Li19 but few systematic investigations have been conducted on the Cu–FeS composites by the power metallurgy technique. The friction and wear behaviors of Cu–FeS composites remain unclear. These behaviors are very important for the applications of Cu–FeS in lead-free bearing materials. In this paper, we prepare Cu–FeS composites using powder metallurgy process. The aim is to evaluate the tribological performance of Cu–FeS composites and elucidate their tribological mechanisms under dry sliding conditions with and without oil immersion.
II. MATERIAL AND EXPERIMENTAL PROCEDURE
A. Preparation of the Cu–FeS composites
Table I shows the material composition. The base materials are copper alloy powders which contain 10 mass% of Sn. Seven types of materials are produced by adding different contents of FeS powders of 0, 2.5, 5, 7.5, 10, 12.5, and 15 mass% through powder metallurgy method. The average particle sizes of the Cu–Sn alloy powder and FeS powder are all 150 mesh. Firstly, the powders of FeS and Cu–Sn were precisely weighed according to Table I. 0.5 mass% of zinc stearate were added to increase the liquidity of powers in the pressing process. Besides, the zinc stearate has a lubricating effect in the process of demolding. Then the mixed powders were put into mold and pressed in 600–700 MPa by hydraulic press. Finally, they were sintered in 860–890 °C by mesh belt furnace and were held for 40–60 min in hydrogen and nitrogen atmosphere.
The mass fraction of FeS added in the test pieces which matrix material is Cu–10%Sn.

B. Characterization of the materials
The optical microscope and microhardness tester were used to characterize the microstructures and mechanical properties. The porosity, density, and oil content of the samples were measured by Archimedes principle. Figure 1 shows the optical microscopes of the samples. The optical microscopy images of 0#, 2#, 4#, and 6# at 100 times are shown in Figs. 1(a), 1(b), 1(c), and 1(d), respectively. As can be seen, the white areas were the copper alloy, the black areas were the pores, and the gray areas were the FeS particles. When the content of the FeS was lower, its distribution in copper alloy was uniform. With the increase of the FeS, these small FeS particles agglomerated together to form larger clusters [Fig. 1(d)]. The optical microscopy images of the FeS clusters in 6# at 500 times and 1000 times are shown in Figs. 1(e) and 1(f). As can be seen from Fig. 1(e), the interfaces between FeS and the copper alloy combined with strong mechanical interlock and seemed quite clear. But there was a small quantity of micropores in the interfaces due to the poor wettability of FeS and copper alloy. And larger pores existed within the FeS clusters. Figure 1(f) shows the FeS clusters, with porous structure, just like many chrysanthemum buds crowded together. So this morphology explained why there were large pores inside the FeS clusters.
The metallographic photos of Cu–FeS composites with different contents of FeS. (a) The 100-fold microscope of sample 0# without FeS. (b) The 100-fold microscope of sample 2# with 5% FeS. (c) The 100-fold microscope of sample 4# with 10% FeS. (d) The 100-fold microscope of sample 6# with 15% FeS. (e) The 500-fold microscope of sample 6# with 15% FeS. (f) The 1000-fold microscope of sample 6# with 15% FeS.

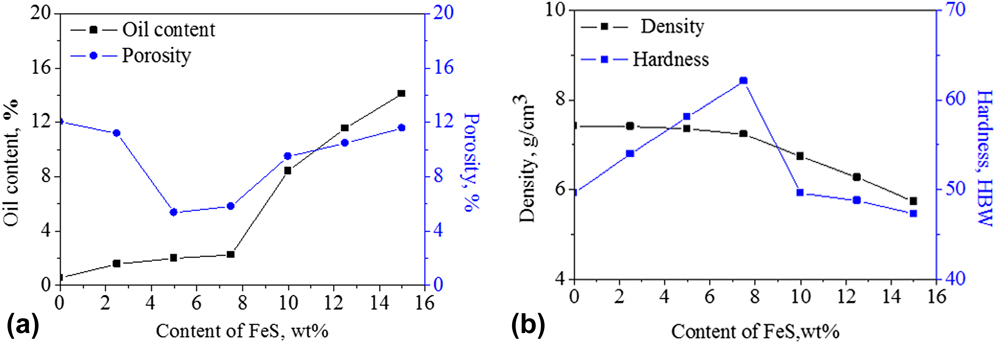
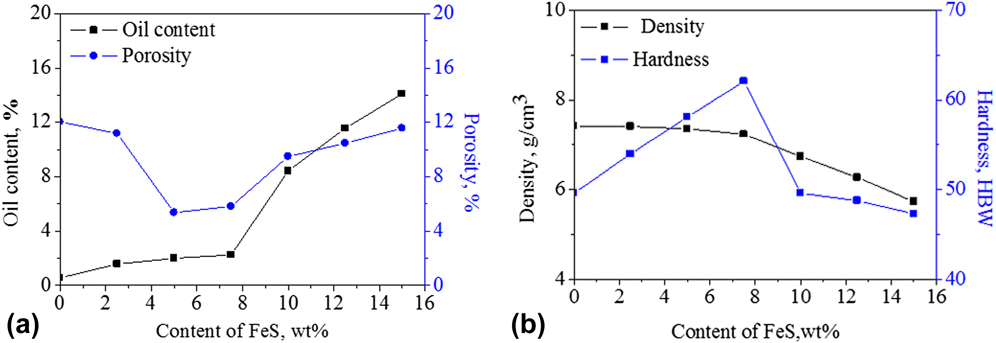
Figure 2 shows the oil content, porosity, density, and hardness of the samples. With the increase of FeS, the porosity decreased firstly, then increased again, and the oil content first increased slowly and then increased rapidly [Fig. 2(a)]. When the content of the FeS was lower, it played the role of lubrication in the process of powder compaction, thereby reducing the porosity. With the increase of FeS content, pores in the interfaces between FeS and copper alloy multiplied. And the FeS particles with porous structure also increased the porosity. Hence the porosity decreased firstly, then increased. The FeS, a solid lubricant, could also store lubricant oil and act as oil reservoirs at the surface since the porous structure of the FeS tissue. And the oil content increased with the increase of FeS. The step change of the increasing oil content can be explained in two ways. On the one hand, when the content of FeS was less than 7.5 mass%, the oil storage capacity of the porous FeS was partly offset by the decreased porosity caused by the lubrication of FeS powder. So the oil content increased slowly. When the content of FeS was higher than 7.5 mass%, the porosity of the samples increased rapidly. So the oil content increased rapidly. On the other hand, the step change of the oil content is very representative of percolation phenomenon in composites. At lower percentages of FeS, FeS with loose and porous structure dispersed separately in Cu–Sn composites, and the oil content increased slowly. The pore channels between FeS particles formed gradually as the amount of FeS increased. When the FeS content increased to the percolation threshold (7.5 mass%), the dispersed pore channels increased rapidly and changed to a continuous network structure. At this point, the oil content increased dramatically. Significantly, the porosities of 0#, 1#, 5#, and 6# were very close, but the oil contents of 5# and 6# were much higher than those of 5# and 6#. This phenomenon was different from the ordinary sintering materials with the coincident trend of the oil content and porosity. Yet this just shows how strong ability of store oil FeS is. The higher content of FeS increases the open porosity on the surface of the samples, thus the oil content is higher. Figure 2(b) shows that the density decreased and the hardness increased firstly, then decreased again with the increase of FeS content. As the density of FeS was lower than that of the copper matrix, the density of the sample was gradually decreased with the increase of FeS content. When the content of FeS was less than 7.5 mass%, the downtrend of the density was relatively slow since the porosity decreased. While when the content of FeS was higher than 7.5 mass%, the downtrend of the density increased owing to the increase of the porosity. It also can be seen that the change tendency of hardness was opposite to that of the porosity. When the FeS content was less than 7.5 mass%, the hardness increased with the increase of the content of FeS that was determined by the following two reasons. On the one hand, FeS plays a dispersion strengthening effect in copper alloy and the fine FeS particles hinder the movement of the materials, thus increasing the hardness of the material. On the other hand, the decrease of the porosity increased the hardness of the material. When the content of FeS was higher than 7.5 mass%, too many of the FeS was easy to reunite and the dispersion effect became worse. Its soft and easy slip characteristics gradually played a leading role, together with an increase in the surface porosity, the hardness become lower.
The variation of the oil content, porosity, density, and hardness with different samples. (a) The variation of the oil content and porosity with different samples. (b) The variation of the density and hardness with different samples.
C. Tribological test
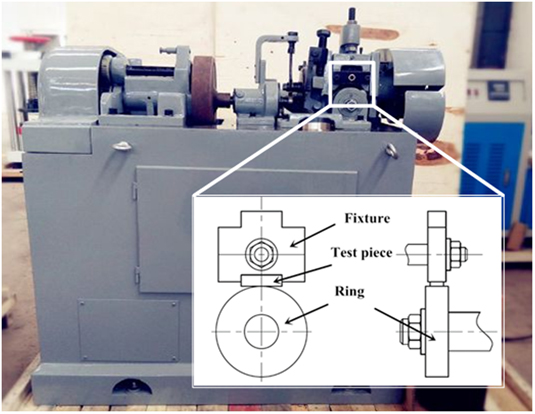
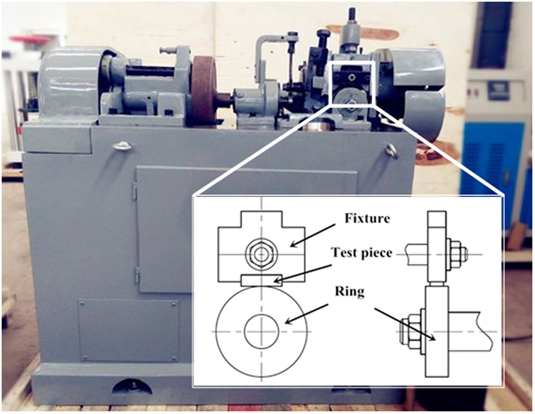
Friction tests were conducted in M-200 tribometer (Xuanhua Material Test Machine Co. Ltd., Xuanhua, China) with ring-block contact shown in Fig. 3, which is suitable for fluid lubricants, greases, coatings, or dry environment testing in many tribological fields. This work focused on the tribological properties of dry friction. The size of test pieces is 18 × 6 × 5 mm. The ring (the inner diameter is 15 mm, the outer diameter is 40 mm, and the thickness is 10 mm) was made of stainless steel with hardness of HRC16. The test conditions were as follows: dry friction with no oil or immersed oil, speed of 200 rpm, and load at 50 N for 60 min. When the test condition was dry friction after immersion oil, the test pieces needed to be immersed in the 32# machine oil for 24 h. Then it is followed by cleaning up the surface and ensuring all the test pieces at the same conditions before the friction tests. Each test result is the average value of three values of the repeated tests. The worn surface morphology and the composition of the materials were analyzed by scanning electron microscope (SEM; JSM-6360, JEOL Ltd., Tokyo, Japan) and x-ray photoelectron spectroscopy (XPS; ESCALAB 250 XI, Thermo Scientific, Waltham, Massachusetts).
Schematic of friction pair tested in M-200 tribometer with ring-block contact.
III. RESULTS AND DISCUSSIONS
A. The tribological property of Cu–FeS composites without immersion oil
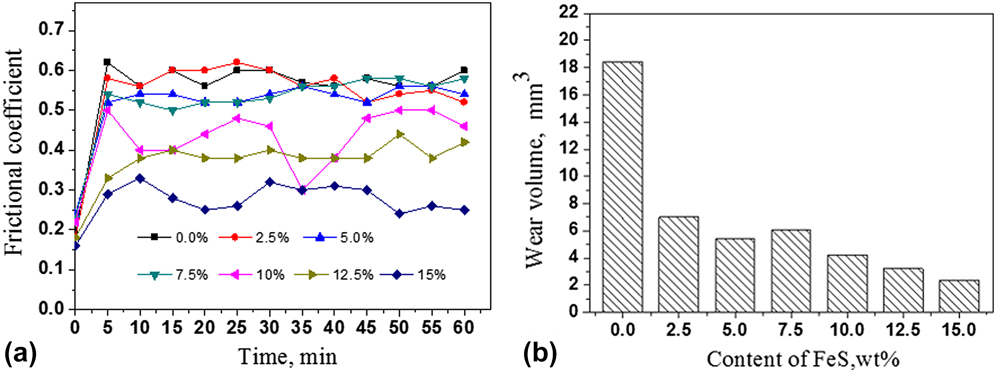
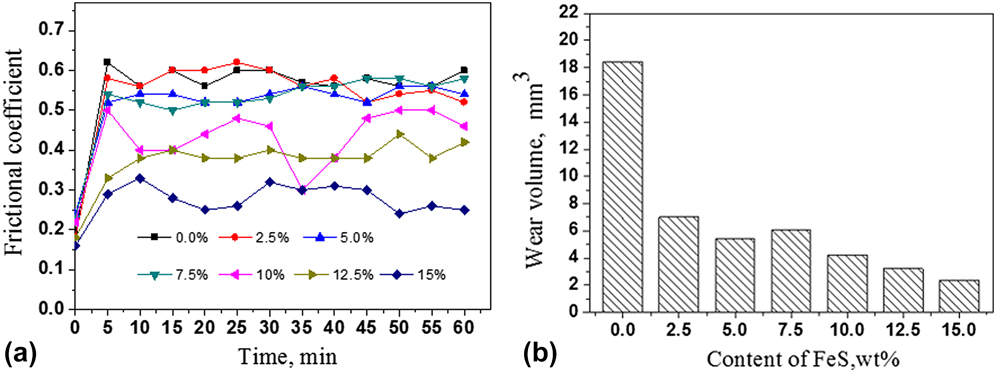
Figure 4 shows the result of the friction test of the samples without oil immersion. As shown in Fig. 4(a), it can be found that the friction coefficient of 0# that does not contain FeS has fluctuated between 0.55 and 0.62 after 5 min. The friction coefficient of 1# is close to 0#. The friction coefficients of 2# and 3# are lower than 0# before 35 min, but after 35 min, they are close to 0#. The friction coefficients of 4#, 5#, and 6# are significantly lower than 0#. The friction coefficients of 5# and 6# are more stable than 4#. From the analysis, we can conclude that 5# and 6# have a good antifriction characteristic. Figure 4(b) shows that the wear volume and FeS content have a great relationship. With the increase of FeS content, the wear volume of test pieces gradually decreases. These results demonstrate that FeS is effective to improve antifriction and antiwear characteristics under the dry condition.
Test results of the friction test with the samples under the conditions as follows: dry friction without immersed oil, speed of 200 rpm, load at 50 N for 60 min. (a) Coefficient of friction of the samples with time. (b) Wear volume with the content of FeS.
B. The tribological property of Cu–FeS composites with immersion oil
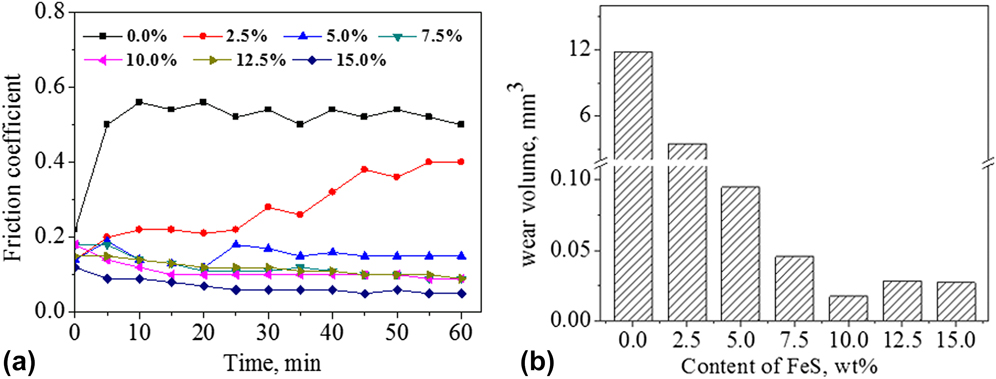
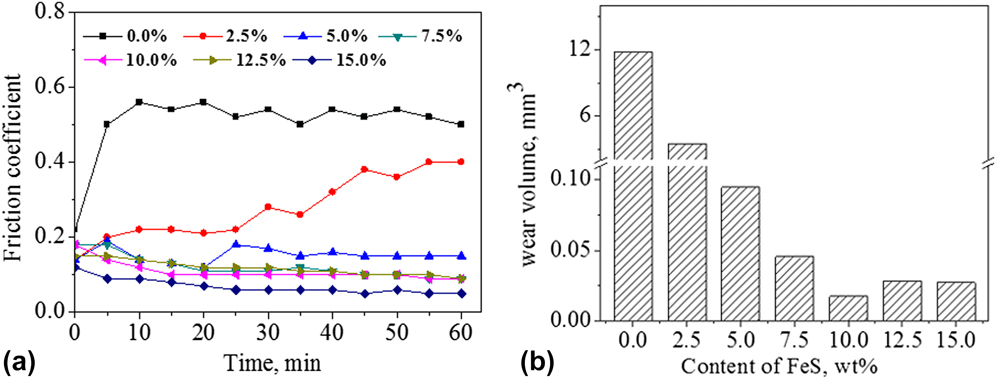
Figure 5 shows the result of the friction test with the samples after immersion oil. As shown in Fig. 5(a), it can be found that the friction coefficient of 0# has fluctuated between 0.50 and 0.55 after 5 min. It is a little lower than that of dry friction shown in Fig. 4(a). The friction coefficient of 1# is relatively stable between 5 min and 25 min. Then it gradually increases as time goes on. Until 45 min, the coefficient is beginning to stabilize again at around 0.4. It is lower than the friction coefficient of 0#. The friction coefficient of 2# is relatively stable before 25 min, then it rises slightly and eventually stabilizes at around 0.2. That is far less than 1#, 3#, 4#, 5#, and 6#, they have lower and more stable friction coefficients than all of the above. In particular, 6# shows the best property of antifriction and the friction coefficient has a decreasing trend as time goes on. Figure 5(b) shows the variation of wear volume with different test pieces. Compared with 0#, there is a 3-fold fall in wear volume of 1#. The wear volume of 3#, 4#, 5#, and 6# is less than 0.1 mm3, far less than that of 0# and 1#.
The result of the friction test with the samples under the conditions as follows: dry friction with immersed oil, speed of 200 rpm, load at 50 N for 60 min. (a) Coefficient of friction of the samples with time. (b) Wear volume with the content of FeS.
C. Mechanism of solid self lubrication of Cu–FeS composites without immersion oil
Figure 6 shows the wear scars of test pieces by SEM. Since 0# and the ring contact directly in the process of friction, adhesion and avulsion arise easily between surfaces. Moreover, the ring was relatively hard and the hard asperities on the ring would scratch the soft matrix. Hence, several furrows can be seen on the surface of 0# and the appearance of seizure and adhesion is obvious. With the increase of FeS content, a few portions of solid lubricant film have formed on the wear scar of 3#. So the behaviors of seizure and adhesion are slighter than those of 0#. The figure also tells us that the area of solid lubricant film of 5# is larger than 3#. That is because more lubricant film can segregate two frictional surfaces, thus no adhesion exists on 5#.
The wear scars of test pieces 0#, 3#, 5#, and 6# by SEM which are tested with the conditions as follows: dry friction without immersed oil, speed of 200 rpm, load at 50 N for 60 min. (a) The wear scar of sample 0# without FeS. (b) The wear scar of sample 3# with 7.5% FeS. (c) The wear scar of sample 5# with 12.5% FeS. (d) The wear scar of sample 6# with 15% FeS.

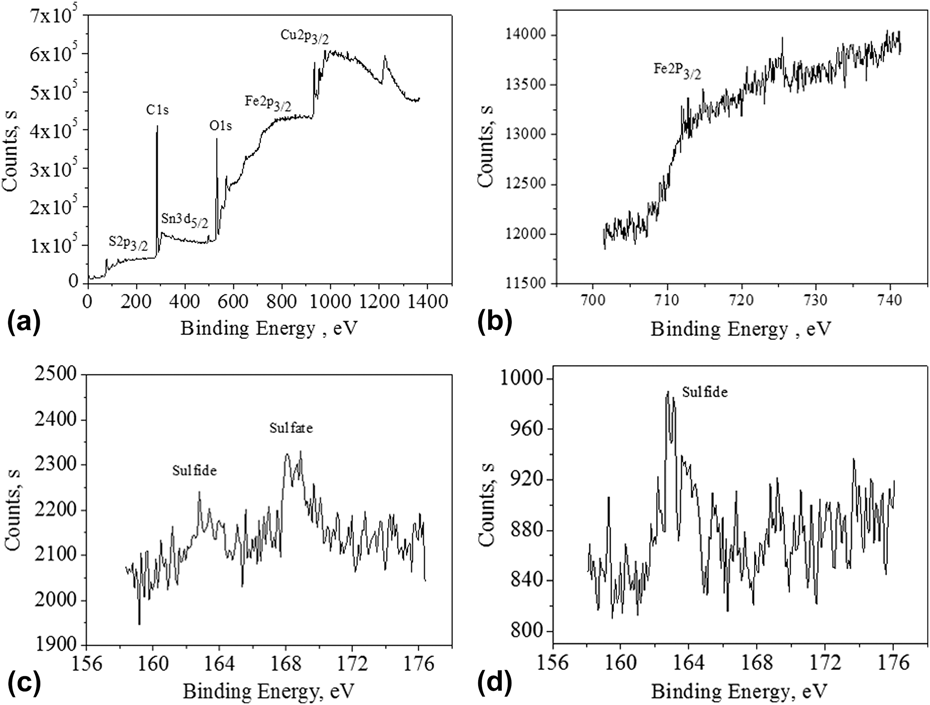
The lubricant film is beneficial to improve tribological performance. So it is important to identify the chemical composition of the film. The XPS images of wear scar of 5# are illustrated in Fig. 7. Figure 7(a) shows the full scan spectra of wear region. As can be seen from the picture, high contents of elements such as C, O, Cu, Sn, Fe, and S exist in the wear scar area of 5#. Figures 7(b) and 7(c) show the spectra of Fe and S. According to the binding energy of the peaks, it can be confirmed that the area of wear scar contains FeS and FeSO4. The spectra of S before friction test are shown in Fig. 7(d). According to the binding energy of the peak, S exists in the form of FeS. All the above analyses demonstrate that FeSO4 is a necessary result of the oxidation of partial FeS during test.
The XPS of wear scar of 5# with 12.5% FeS tested with the conditions as follows: dry friction without immersed oil, speed of 200 rpm, load at 50 N for 60 min. (a) The full scan spectra of wear region of 5# after the friction test. (b) The spectra of element Fe of wear region of 5# after the friction test. (c) The spectra of element S of wear region of 5# after the friction test. (d) The spectra of element S of 5# before the friction test.

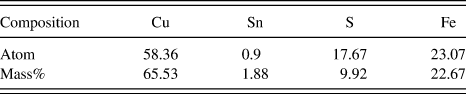
As mentioned earlier, the FeS content of 5# is 12.5 mass% before test. Correspondingly, the content of S is 4.5 mass%. Table II shows the result of XPS composition analyses after friction test. The content of S is 9.92 mass% after friction test. It indicates that part of sulfide adheres to the friction surface and it has good effects on antifriction and antiadhesion.
XPS composition analyses of wear scar of the sample 5# with 12.5% FeS.

Figure 8 shows the 3D surface profiling of the rings matched with 2# and 6# after friction test. The photographs are measured by 3D laser scanning microscope. The 3D surface of the ring matched with 2# is shown in Fig. 8(a). As can be seen, a large number of furrows exist on the ring and the wear degree is very serious. Obviously, the main wear mechanism is abrasive wear. The photograph of the ring matched with 6# is shown in Fig. 8(b). The surface is quite smooth and no obvious furrow can be found on the ring. Also the wear degree is relatively slight. It denotes that the existence of FeS has a protective effect on the counterface.
Three dimensional laser scanning microscope of the surface profiling of the rings matched with 2# and 6# after friction test with the conditions as follows: dry friction with no immersed oil, speed of 200 rpm, load at 50 N for 60 min. (a) The 3D surface photograph of the ring matched with 2# with 5% FeS. (b) The 3D surface photograph of the ring matched with 6# with 15% FeS.

Figure 9 shows the distribution of S on the rings. The distribution of S on the ring matched with 2# is shown in Fig. 9(a). It can be seen sulfide on the surface distribute uniformly. That is because partial FeS transfers from the matrix to the surface of the ring during friction. When the temperature of the friction is high, the molten FeS would ionize. Then S ion produced by ionization would react with the ring to generate new FeS. The ability of regeneration can ensure that the FeS content reaches dynamic equilibrium. The FeS adhered to the surface of the ring and the solid lubricant film formed on the piece could work together to prevent contacting directly between surfaces. Thereby the coefficient of friction is very low and the property of antiadhesion is improved. The distribution of S on the ring matched with 6# shows in Fig. 9(b). Compared with Fig. 9(a), there are more FeS existing in Fig. 9(b). So we can conclude that the solid lubricant film on the wear scar of test piece is relatively sufficient. Certainly 6# has the best properties of antifriction and antiwear.
EDS analyses for the distribution of the S on the surface of the rings matched with 2# and 6# after friction test with the conditions as follows: dry friction with no immersed oil, speed of 200 rpm, load at 50 N for 60 min. (a) The distribution of S on the ring matched with 2# with 5% FeS. (b) The distribution of S on the ring matched with 6# with 15% FeS.

D. Mechanism of liquid–solid synergistic lubrication of Cu–FeS composites with immersion oil
The photographs of the wear scars measured by the laser scanning microscope are shown in Fig. 10. Furrows and adhesion are present clearly in the surface of 0#. They are formed as a combined result of the asperities contact directly for lacking of lubricant oil and the scuffing temperatures generated at the frictional process. Wear scar of 3# has a fewer furrows. The phenomenon of adhesion and avulsion is relatively slight. It can be found that there is a solid lubricant film that is green in the picture on the surface. Compared with 3#, the wear degree of 6# is much slighter than that of 0# and 3#. There is a thicker lubricant film and no obvious adhesion on the wear scar. But a spot of pits still exist. Owing to more FeS particles, the bonding strength of FeS particles and 6# matrix is relatively weak. When the shear force is too large, FeS particles would fall off from the matrix to form pits. Those detached particles would adhere to the surface of the wear scar to form solid lubricant film. This film has good properties of antifriction and antiwear.
The laser scanning microscope of the wear scars of test pieces 0#, 3#, and 6# with the test conditions as follows: dry friction with immersed oil, speed of 200 rpm, load at 50 N for 60 min. (a) The wear scar of sample 0# without FeS. (b) The wear scar of sample 3# with 7.5% FeS. (c) The wear scar of sample 6# with 15% FeS.

When friction tests finished, it was easy to find that lubricant oil existed on the surface of rings and wear scars of 3#, 4#, 5#, and 6#. The lubricant oil could decrease the coefficient of friction. To analyze the friction mechanism of Cu–FeS composites under dry friction after immersion oil, it is important to identify the causes of lubricating oil. With reference to Fig. 1(f), we can see that the internal structure of FeS is relatively loose so as to storing lubricant oil. With the temperature rises, more and more lubricating oil overflow from the matrix because of thermal expansion in the process of friction. The higher the FeS content, the more oil overflows from the matrix. The lubricant oil and FeS transfer film could work together to achieve the liquid–solid lubrication. It shows a good effect of boundary lubrication.
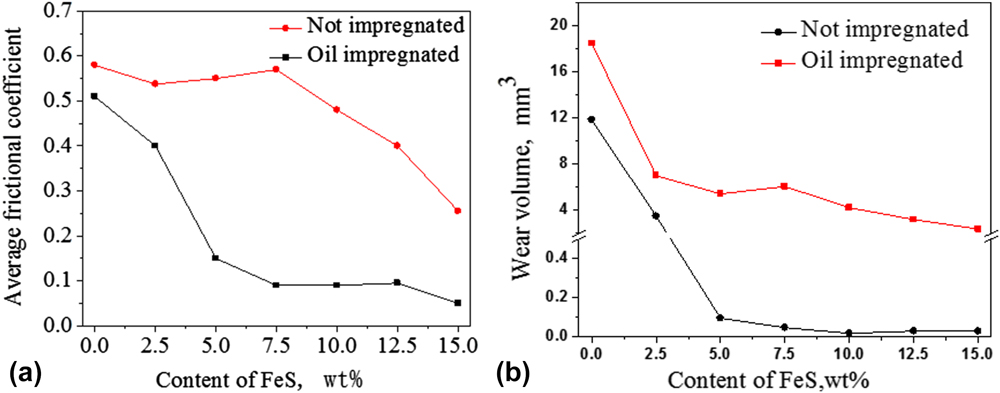
Figure 11 shows the variation of the average friction coefficients and the wear volumes with different test pieces under dry sliding conditions with and without oil immersion. As shown in Fig. 11(a), all the friction coefficients decreased with the increase of the FeS content. And the difference of the friction coefficients between the two test conditions was not significant for the Cu-based composites without FeS. With the increase of FeS content, the difference became larger under the two conditions. It shown that the lubricating oil and the FeS solid lubrication film can form a good synergistic lubrication effect, and its lubrication effect was much better than that of the FeS solid lubrication film. The wear volumes after immersion oil were less than that without oil as shown in Fig. 11(b). The change of the wear volumes was similar to that of the average friction coefficients.
The variation of the average friction coefficients and the wear volumes with different test pieces under dry sliding conditions with and without pre-oil-immersion. (a) The average friction coefficients of the samples with the content of FeS. (b) The wear volume of the samples with the content of FeS.

In summary, adding proper amount of FeS to lead free copper matrix composites can improve the tribological property of the materials under dry friction with and without oil immersion. Especially after oil immersion, Cu–FeS composites can present a liquid–solid synergistic lubrication effect. And its lubrication performance is much better than that of the FeS solid lubrication film.
IV. CONCLUSION
-
(1) Under dry sliding condition, friction of FeS/copper composite decreased with increased FeS content in the composite and the surface lubricating film. The sliding-generated solid lubricant tribofilm contains sulfide. This film and FeS adhered on the ring could work together to reduce friction.
-
(2) Under dry sliding after oil immersion, the lubricant oil stored in the porous FeS layer precipitated to the surface to form the oil film. The lubricant oil film and the solid lubricant film could work synergistically to achieve a low friction, liquid–solid lubrication state, which shown a good boundary lubrication effect.
-
(3) Tribological property became better with the increase of FeS content under dry sliding conditions with and without oil immersion. The lubricating oil and the FeS solid lubrication film can form a good synergistic lubrication effect, and its lubrication performance was much better than that of the FeS solid lubrication film.
ACKNOWLEDGMENTS
The authors are very grateful for the support of the Natural Science Foundation of China (No. 51575151, No. 50975072), the Anhui Key Scientific and Technological Projects (No. 1501021006).