Introduction
Potassium (K) is an essential macronutrient for plants and of major importance for the sustainability of agricultural grassland production. Globally K deficiency is estimated to affect 20 % of agricultural soils (Brownlie et al., Reference Brownlie, Alexander, Maslin, Cañedo-Argüelles, Sutton and Spears2024). Deficiency of K in soils can be evaluated by soil testing and this is typically done to determine the relative soil fertility status. For instance, in the UK, an assessment of soil K test results found that 34 % of grassland and 37 % of arable land had soil K indices of 0 or 1 (Cawood, 2024), and thus were low or deficient in K (Table S1) (AHDB, 2017). More than one third of agricultural soils in the UK are categorized as low or deficient in K, hence there is a need to re-examine the agricultural management of K.
The British Survey of Fertiliser Practice (BSFP) reports on the application rates and usage of fertilizer in UK agriculture (DEFRA, 2024). Recently, the rate of decline has increased due to global price increases and a reduction in supply due to the war in Ukraine (DEFRA, 2024). There has been significant market volatility which has impacted the prices of potash (Brownlie et al., Reference Brownlie, Alexander, Maslin, Cañedo-Argüelles, Sutton and Spears2024). The cost of fertilizers is an important factor which can strongly influence the cost of agricultural production and also management decisions regarding fertilizer usage. Consequently, the overall application rate (kg K/ha) of potash on all crops and grass has been steadily declining over the past 40 years in the UK. For example, the application rate on crops in 1984 was nearly 70 kg K/ha, but was 23 kg K/ha in 2023; while on grassland the annual K applied was >30 kg K/ha and had decreased to 6 kg K/ha over the same period (DEFRA, 2024). In sum, these BSFP survey results indicate there is an increased risk of a future soil K deficiency which has implications on the potential of agricultural production and also the K balance.
There has been a lack of research on the K balance of grasslands and there is a significant need to improve understanding of management effects on K inputs and K losses. The nutrient cycling of K differs greatly between soils according to the soil texture. For example, there is little K retention in sandy soils and a greater risk of K being leached (Alfaro et al., Reference Alfaro, Gregory and Jarvis2004; Johnston and Goulding, Reference Johnston and Goulding1992). In comparison, the cycling of K in clay soils is quite different (Kayser and Isselstein, Reference Kayser and Isselstein2005). Soil mineralogy has a strong influence on how K is held and released (Öborn et al., Reference Öborn, Edwards and Hillier2010). Moreover, the quantity of total K concentration in the soil varies between soil types according to the mineralogy composition (Andrist-Rangel et al., Reference Andrist-Rangel, Hillier, Öborn, Lilly, Towers, Edwards and Paterson2010). In the context of soil fertility considerations it is important to confirm there are different soil K pools (e.g. including soil solution K, exchangeable K, non-exchangeable or fixed K and structural K) (Bell et al., Reference Bell, Moody, Harch, Compton and Want2009). A dynamic interplay exists between these soil K pools which influences the rate of soil K cycling. An evaluation of six contrasting soil types in New South Wales, Australia demonstrated the distinct differences in soil K pools and soil K availability (Holland et al., Reference Holland, Conyers, Orchard and Poile2014). Thus, the variability in K cycling between soil types adds to the complexity of an appropriate level of K inputs. Likewise, management and the level of applied nutrient inputs can have a significant impact on the soil K status (Mikkelsen and Roberts, Reference Mikkelsen, Roberts, Murell, Mikkelsen, Sulewski, Norton and Thompson2021). It can be difficult to ensure that nutrient inputs suitably match crop requirements and do not produce either significant K losses or a large K surplus. Management needs to match soil type to ensure that both K deficiency and luxury K uptake are avoided. Consequently, Moir et al. (Reference Moir, Seidel and Kayser2013) suggested that for grasslands on sandy soils lower K applications may prevent luxury K consumption.
Land use and the management system are the two dominant factors which drive the level of K cycling and determine the level of K losses (Kayser and Isselstein, Reference Kayser and Isselstein2005). Moreover, the nature of K balance is often closely related to the level of nitrogen (N) inputs supplied as N availability is typically the primary determinant of biomass productivity. Thus, the relationship between the total inputs of K and N has implications on the efficiency of K used (Alfaro et al., Reference Alfaro, Jarvis and Gregory2003). A major challenge regarding the calculation of the soil K balance are the sources of uncertainty. Öborn et al. (Reference Öborn, Andrist-Rangel, Askekaard, Grant, Watson and Edwards2005) lists three areas of uncertainty: (1) calculations of K inputs and outputs, (2) the existing soil K reserves and (3) the potential for the soil to release additional K. To complicate matters the K balance can be determined at different scales. Foy et al. (Reference Foy, Bailey and Lennox2002) reported that the overall farm-gate K balance was positive and had been significantly increasing over the past decades in Northern Ireland. In contrast, Øgaard and Hansen (Reference Øgaard and Hansen2010) found in a survey that 23 out of 26 farms had a negative K balance in Norway. Calculations of the K balance from experiments in the UK of grassland systems have reported both a K deficit (Öborn et al., Reference Öborn, Edwards and Hillier2010) and mixed results (positive and negative K balance) (Alfaro et al., Reference Alfaro, Jarvis and Gregory2003). McCarthy et al. (Reference McCarthy, Wall, Forrestal, Casey and Humphreys2024) reported that K losses in drainage to groundwater for a grassland dairy farm were 55 % of the total losses, however overall there was still a positive K balance. The magnitude of K losses in intensive agricultural systems with nutrient balance surpluses and large K losses are often associated with significant nitrogen (N) leaching which is of concern for water quality (Goulding et al., Reference Goulding, Murrell, Mikkelsen, Rosolem, Johnston, Wang, Alfaro, Murell, Mikkelsen, Sulewski, Norton and Thompson2021). Over recent decades there has been a lack of research attention in K and significantly less interest compared with N and phosphorus (P). One factor that can explain the small interest in K has been the perception that there is no serious environmental impact associated with off-site movement of K, although Brownlie et al. (Reference Brownlie, Alexander, Maslin, Cañedo-Argüelles, Sutton and Spears2024) reports that K can be a cause of toxicity for freshwater biodiversity.
Nutrient imbalances are a complex management challenge within agricultural systems. The examination of trends in K inputs and K losses can assist the identification of K deficits or K surplus. This study focuses on the nutrient management of grasslands with aims of investigating slurry and fertilizer treatments effects on soil K (i.e., soil extractable K; SEK), herbage K and the partial K balance for a long-term grassland experiment. Moreover, the implications of K management for livestock dietary requirements in the present study are corroborated by a recently published study on Mg conducted from the same experiment (Holland et al., Reference Holland, Gordon and McLenaghen2025). Objectives were to determine the nutrient treatment effects (including slurry rate and slurry type) on: (i) the concentration of SEK at three depths (0–5, 5–10 and 10–15 cm), (ii) the concentration of herbage K and K offtake at three harvest cuts and on an annual basis and (iii) the long-term mean partial K balance.
Materials and methods
Site description and experimental design
A long-term grassland experiment was established in 1970 at Hillsborough, Northern Ireland, UK (54.452698, 6.0825411). Originally the site was sown as a perennial ryegrass (Lolium perenne) sward and is typical of permanent grassland in Northern Ireland. From 1970 to 2018 the plots were not ploughed or reseeded, but weed species were controlled, such as dock (Rumex spp.). The site is 120 m above sea level and the soil is classified as a Dystric Cambisol (WRB, 2006). It has clay loam texture (42 % sand, 24 % silt and 34 % clay) overlying Silurian shale and greywacke (Christie, Reference Christie1987). The soil is classified as a Dystric Cambisol (WRB, 2006). The climate is described as temperate oceanic and is characterized by mild-wet winters and cool humid summers. The observed long-term monthly mean rainfall and air temperature from 1970 to 2018 are given in Table S2. This long-term experiment has generated >40 published studies covering soil chemistry, soil carbon, agronomy, forage quality and related fields (Christie and Beattie, Reference Christie and Beattie1989; Fornara et al., Reference Fornara, Wasson, Christie and Watson2016, Reference Fornara, Flynn and Caruso2020; Murphy et al., Reference Murphy, Stevens and Christie2005).
The experiment has a randomized complete block design with three adjacent blocks with two replicates of each treatment within each block (i.e., six replicates in total). The eight nutrient treatments are: (1) unfertilized control, (2) inorganic fertilizer (NPK: 200 kg N, 32 kg P and 160 kg K/ha/year), three rates of cattle slurry applied at (3) 50 m−3 ha−1 year−1, (4) 100 m−3 ha−1 year−1, (5) 200 m−3 ha−1 year−1, three rates of pig slurry applied at (6) 50 m−3 ha−1 year−1, (7) 100 m−3 ha−1 year−1, (8) 200 m−3 ha−1 year−1. Thus, in total there were 48 plots (each 3.5× 8.5 m). The three rates of slurry applications are described as Low (L), Medium (M) and High (H) both for the cattle and pig. The inorganic fertilizers applied were urea (for N), superphosphate (for P) and muriate of potash (for K). During the early years of the experiment ammonium nitrate was used, however from 1975 onwards urea was the N fertilizer applied (Christie, Reference Christie1987). From 1970 to 2010 the superphosphate applied included P only. From 2011 a single super phosphate product was used which included 11 % S which corresponds to 21.9 kg S/ha/year (Goulding NI Fertilizers, Londonderry, UK). The nutrient treatments were applied in three equal amounts at three times each year (early Spring (March), later spring (May) and summer (July)) and all treatments were applied at each application time.
Soil, plant and slurry sampling and laboratory analysis
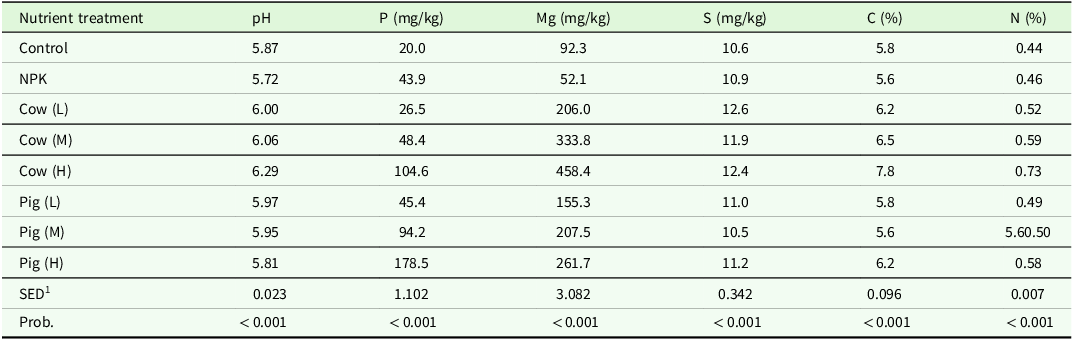
A summary of mean values for basic soil properties over the experimental period (1970–2018) are given in Table 1. Soil samples were collected between 1972 and 2018 at three depths (0–5, 5–10 and 10–15 cm). The samples were collected from five points within each plot using a 2.5cm diameter soil corer and pooled to form a composite soil sample. Each year the soil was sampled (in February) before the application of any slurry or fertilizer. The soils were sieved (<2 mm size mesh) and air-dried. Soil pH was measured in a 1:2.5 soil-to-solution (water solution) (MAFF, 1986). Soil phosphorous (P) was estimated using a sodium bicarbonate extraction method (Olsen, Reference Olsen1954). Soil potassium (K) and magnesium (Mg) were extracted using 1M ammonium acetate solution (NH4CH3CO2) at pH 7 and the concentrations in the extract detected using atomic absorption spectroscopy (Jackson et al., Reference Jackson, Farrington and Henderson1986); hereafter, the soil extractable K is designated as SEK. Sulphur was extracted from soil with a calcium phosphate (500 mg P/l) solution (Islam and Bhuiyan, Reference Islam and Bhuiyan1988). For all soil nutrients (P, K, Mg and S) the filtered extractant was analysed by inductively coupled plasma optical emission spectroscopy (ICP-OES) (Agilent 5100, Santa Clara, CA, United States). The soils were ground to <150 µm using a regular ball mill and the total soil C% and N% was determined according to a Dumas combustion method using a LECO Trumac CN Elemental Analyser (St Joseph, Michigan, USA).
Summary of basic soil properties at 0–5 cm depth from 1970–2018

1 The average standard error of the difference of mean (SED).
Plots were cut three times each year: in May (spring), July (summer) and September (autumn) from 1970 until 2018. Herbage yield was determined from the central 20 m2 of each plot using a plot harvester (Haldrup GMbH, Germany). All plant biomass was weighed in the field and removed, and a sub-sample (∼300 g fresh weight) was oven-dried (at 80°C) until constant weight. Thus, the percentage dry matter was determined to estimate dry matter (DM) production. Total concentration (g/kg DM) of plant nutrients (P, K, Mg, S, Fe, Cu, Zn, Mn) were determined using a nitric acid digest (Havlin and Soltanpour, Reference Havlin and Soltanpour1980). The concentration of herbage nutrient was multiplied by the biomass DM to determine the nutrient offtake (e.g. kg K/ha). The ‘critical’ concentrations of herbage K concentration (18 g/kg) in grassland plants was based on results from a Timothy and meadow fescue dominant sward (Lunnan et al., Reference Lunnan, Øgaard and Krogstad2018) and a perennial ryegrass sward (Whitehead, Reference Whitehead2000). This corresponds to the dietary requirements of dairy cattle in the UK. Sub-samples of cow and pig slurry were collected at each application and analysed for ammonium-N, total N and total P and K. The DM content (%) of slurry was determined by drying a sample at 100°C (±2°C) in a forced draught oven overnight. The total nitrogen (N) in the fresh slurry was digested with sulphuric acid in a Kjeldahl flask and ammonia in the digest was determined by steam distillation. The phosphorous (P) and potassium were digested with a nitric-perchloric acid. The slurry digest solution was introduced into the plasma of an ICP emission spectrometer (Peters et al., Reference Peters, Combs, Hoskins, Jarman, Kovar, Watson, Wolf and Wolf2003). The mean applied rate (kg/ha) of nitrogen (N) and phosphorus (P) for each nutrient treatment during the study are given in Table S3.
Partial soil potassium balance calculation
The partial K balance was calculated using long-term mean data for each nutrient treatment using plot level data from 1970 to 2018 (Equation 1). The applied K inputs (InputK) and the atmospheric K deposition (DepK) were the total K inputs. The K outputs was the amount of K removed in the harvested offtake (OffK).
 $${\rm{Partial \ K \ balance}} = \left( {{\rm{Input}_{\rm{K}}} + {\rm{Dep}_{\rm{K}}}} \right)-{\rm{Off}_{\rm{K}}}$$
The annual K inputs from slurry and mineral fertilizer were calculated (InputK). The annual DepK was estimated to be 5 kg/ha based on the data reported in Ireland (Jordan, Reference Jordan1997; O’Carroll and McCarthy, Reference O’Carroll and McCarthy1973). The annual herbage K offtake was calculated as the sum of the biomass measured at three harvests each year (OffK). No direct measurements of the amount of the K leached or lost via run-off (LossK) were undertaken. Thus, it was not possible for the full soil K balance to be robustly calculated. Nevertheless, for the general purposes of ‘indication only’ the amount of K leached or lost via run-off were estimated using the OVERSEER model (Wheeler et al., Reference Wheeler, Ledgard and DeKlein2008). OVERSEER is a nutrient budget model to estimate the flow of nutrients on farms. It models the effects of various farm management practices in order to understand nutrient use efficiency and environmental impacts, particularly nutrient losses to water and air. The model calculates how nutrients, including S is lost from the soil profile through drainage – i.e., water moving below the root zone which can eventually reach groundwater or surface water bodies. The OVERSEER model was parameterized with the long-term mean evapotranspiration and rainfall data. Each simulation was according to a grassland silage harvest system without any grazing and simulations were run with the experimental site soil properties.
The K use efficiency (KUE) was calculated as the proportion of herbage offtake K for the applied K input in either fertilizer or slurry after the subtraction of K offtake in the unfertilized control but not including the K deposition. All components of the partial K balance were based on overall mean values for the study period (1970 to 2018) on an annual basis with the same units i.e. kg K/ha/year.
Statistical analysis
SEK, herbage K and K offtake data were analysed using linear mixed model methodology (REML estimation method). The SEK data included three depths (0–5, 5–10 and 10–15 cm) and depth was included as a factor. The SEK data had Block and Plot within Block fitted as random effects and in a factorial arrangement the following factors were tested: depth and nutrient treatment as fixed effects. In addition, the nutrient treatment factor was partitioned into three slurry rates × two slurry types + two ‘other’ (where other = the unfertilized control and inorganic mineral fertilizer (NPK) treatments). Thus, the model was run a second time with the nutrient treatment factor replaced in the fixed effects by a multi-factorial term which tested for slurry, slurry rate and slurry type i.e. other/(rate × type). Year was a fixed effect and this allowed the effect of changes over time to be assessed. The SEK data modelled every year for the nutrient treatment, however the slurry rate and slurry type were modelled every third year starting at 1972.
The same analysis was undertaken for the herbage K and offtake K data, although instead of the depth factor there were three harvest cuts (1. spring, 2. summer and 3. autumn) alongside annualized data. For all variables, the fixed effects were assessed using an F-test. The adequacy of all models was assessed by visual inspection of the appropriate residual plots. All analyses were carried out using GenStat Release 23.1 (VSN International, 2023). All figures were plotted using R software (R Core Team, 2023).
Results
Slurry composition
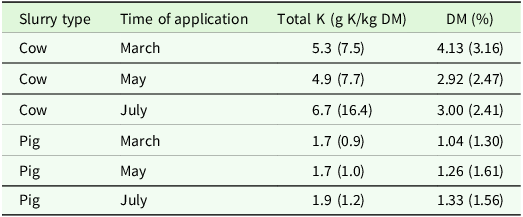
There were significant slurry type and application effects on the total K (g K/kg DM) and the dry matter (DM) of the applied slurry (Table 2). The cow slurry had significantly greater total K (g K/kg DM) than the pig slurry (P < 0.001) and there were significant effects according to the time of application (P < 0.01). Nevertheless, there was no significant interaction effect (P > 0.05) between slurry type and application time. The DM (%) of cow slurry was significantly (P < 0.001) greater than the pig slurry, but no significant application effect (P > 0.05) for the DM was detected. A significant interaction effect (P < 0.05) was found for the DM between the slurry type and the timing of application. There was no significant time effect (P > 0.05) for either the total K or the DM was detected across the different years between 1970 and 2018.
The mean concentration (g K/kg DM) of total K and dry matter (%) (DM) for each slurry type (cow and pig) at three times of application between 1970 and 20181

1 Standard deviation is given in brackets.
Soil extractable K
Soil extractable K (SEK) was measured at three depth intervals (0–5, 5–10 and 10–15 cm). Significant main effects (P < 0.001) were found for all treatment factors (year, nutrient, rate of slurry and type of slurry) on the SEK. Moreover, significant (P < 0.001) interaction effects were found between these treatment factors. Because of the significant (P < 0.001) depth effects, the subsequent evaluation of treatment effects is described by each depth separately below.
Treatment effects on soil extractable K (SEK)
For each soil depth there were significant treatment effects (P < 0.001) found over the years from 1971 to 2018 (Table S4). A long-term assessment is required to better understand the overall average differences between these nutrient applications. Unsurprisingly, there were large differences between treatments in all depth intervals. The highest SEK values were in the surface interval (0–5 cm) and for each nutrient treatment there was a decrease in SEK in the next two depth intervals. The cow (H) treatment had highest SEK values and this was followed by the other cow slurry treatments. The lowest SEK values were for the control and the pig (L) treatments, while the mineral fertilizer NPK treatment was slightly higher than the control treatment, but only at the 0–5 cm depth interval.
There were significant year effects (P < 0.001) on the concentration of SEK and consequently there were dynamic changes over time (Figure 1). The largest differences between the nutrient treatments took place by 1976 for the 0–5 cm depth. Since 1977 the nutrient treatment differences were maintained. Figure 1 shows that there are distinct differences in the mean SEK between the three sampled depths (0–5, 5–10 and 10–15 cm). The highest concentration of SEK is observed in the surface depth (0–5 cm) and the concentrations for most nutrient treatments decrease with increasing depth. There are significant nutrient treatment effects on SEK and the magnitude of the treatment difference changes from 1971 to 2018. Overall, the cow (H) treatment had the highest SEK value followed by the other cow slurry treatments (L and M), then pig (H) treatment and in 2018 there was little difference between the remaining nutrient treatments (pig (L), pig (M), NPK and control). There were year-to-year fluctuations, but little overall change in the SEK for the control and NPK treatments. On the right-hand y axis of Figure 1 the soil K index value according to the concentration of SEK is given. This index value is based on the UK recommendations for potash applications on grassland according to the Nutrient Management Guide (RB209) (Table S1) (AHDB, 2017).
The effect of nutrient treatments (Cow (L), Cow (M), Cow (H), Pig (L), Pig (M), Pig (H), control and NPK) on soil extractable K (SEK) (mg/kg) at three depths (a) 0–5 cm, (b) 5–10 cm and (c) 10–15 cm from 1971 to 2018 (the left hand y axis is on the log(10) scale; the right-hand y axis provides the soil K index values for the concentration of SEK based on RB209 (AHDB, 2017); the average standard error of the difference (SED) of the mean and P value are for the nutrient treatment at each soil depth.

Slurry rate and slurry type effects on soil extractable K (SEK)
The effect of the slurry rate was significant (P < 0.001) on the concentration of SEK at each soil depth interval. The mean SEK concentration for each slurry rate treatment at each depth is given in Table S5. There was a positive relationship between the rate of slurry and the SEK. The high slurry treatment had the greatest SEK and the control had the lowest values.
There were significant slurry type effects (P < 0.001) on the concentration of SEK at each soil depth (Table S6). The concentration of SEK for the cow slurry treatment was significantly greater than the pig slurry and the two non-slurry (NPK and control) treatments. At all three depths there was no significant difference between the control and NPK treatments. At the second depth (5–10 cm) the SEK for the pig slurry treatment was higher than the control and NPK treatments, however it was less than 20 % of that recorded in the cow slurry treatment. While at the 10–15 cm depth intervals there was no difference between the control, NPK and the pig slurry treatments.
Temporal changes in the slurry rate were detected between 1971 and 2018 (Figure S1). The general nature of the slurry rate effect was similar at each depth. The H rate of slurry had the greatest increase in the concentration of SEK and this was followed by the M and L rates. Most of the increase in the concentration of SEK took place within the first ten years of the experiment. There was no significant difference in the concentration of SEK between the control and the NPK treatments.
There were large differences over time for the type of slurry treatment on the SEK from 1972 to 2017 (Figure S2). The type of slurry effect was significant (P < 0.001) at each depth. For example, within five years after the commencement of the experiment significant type effects (P < 001) were observed. There was an increase in the concentration of SEK for the cow slurry and significantly higher values were maintained for the whole measurement period. For the pig slurry there were small fluctuations between years, but overall there were little temporal changes in the concentration of SEK from 1972 until 2017. In contrast, the control and NPK treatments initially decreased and then stabilized at concentrations which were between half and 2/3 of the starting concentrations.
Herbage K and K offtake
There were significant main effects (P < 0.001) found for all treatment factors (year, harvest cut, nutrient, rate of slurry and type of slurry) on both herbage K and the K offtake. Significant interaction effects (P < 0.001) were found between these treatment factors for the herbage K concentration and K offtake. Due to the significant (P < 0.001) cut effects that were detected the herbage K and K offtake are evaluated for each harvest cut and on an average annual basis.
Treatment effects on Herbage K and K offtake
Nutrient treatments had significant effects (P < 0.001) on the concentration of herbage K (g/kg) and the K offtake (kg K/ha). The overall mean values of herbage K and the offtake for each nutrient treatment from 1971 to 2018 are shown in Table S6 and the trend over time with values for each year (Figure S3). The highest herbage K and K offtake was for the cow (H) treatment and the lowest values were for the control treatment. For the herbage concentration of K the NPK treatment was less than all of the cow slurry treatments and similar to the pig (M) treatment. At the corresponding rate of slurry the values for cow slurry were always significantly higher than the pig slurry values. The low K offtake for the control corresponds with the low biomass yield (Table S7). In fact, the nutrient treatment effects on the mean annual biomass dry matter yield (kg DM/ha/year) are informative to explain the K offtake results.
At each harvest cut there were significant nutrient treatment effects on the concentration of herbage K (g/kg) (Figure 2). The concentration of herbage K varied over time from 1970 to 2018 and there were significant year effects on the herbage K at each harvest cut (spring, summer and autumn). Indeed, significant treatment interaction effects (P < 0.001) indicate the importance of evaluating the herbage K for each harvest cut separately. Large differences between the nutrient treatments were observed within the first five years of the start of the experiment. Over time most of the nutrient treatment effects have been maintained, although there is observed significant year-to-year dynamics. The largest differences in the concentration of herbage K are found in harvest cut 1 (in spring). In comparison the difference in concentration is smaller at cut 2 and 3 (summer and autumn respectively). In most years the cow (H) treatment had the highest concentration of herbage K and this was followed by the other cow slurry treatments. The pig (H) treatment was often the within the top four nutrient treatments in terms of herbage K concentration. The control treatment frequently had the lowest herbage K concentration. The NPK, pig (L) and pig (M) treatments were often in the mid-range of concentrations. The critical K concentration was marked with a horizontal dashed line (Lunnan et al., Reference Lunnan, Øgaard and Krogstad2018; Whitehead, Reference Whitehead2000). Several nutrient treatments were below the critical K concentration in each year (at each harvest cut).
The effect of nutrient treatments (Cow (L), Cow (M), Cow (H), Pig (L), Pig (M), Pig (H), control and NPK) on herbage K (g/kg) for each harvest cut (spring, summer and autumn) from 1970 to 2018; the horizontal dashed line represents the critical K concentration (Lunnan et al., Reference Lunnan, Øgaard and Krogstad2018; Whitehead, Reference Whitehead2000); the average standard error of the difference (SED) of the mean and P value are for the nutrient treatment.

At each harvest cut there were significant nutrient treatment effects on the total K offtake (kg K/ha) (Figure 3). The K offtake fluctuated from year-to-year after the experiment commenced in 1970. Thus, the significant year effects (P < 0.001) on K offtake were found at each harvest cut. These changes over time are consistent with the significant treatment interaction effects (P < 0.001) for the K offtake. The differences in K offtake were small between the nutrient treatments during the early years of the experiment. Most of the nutrient treatment effects have remained the same since about 1980. There were significant harvest cut effects on the K offtake with the largest K offtake values at cut 1 (spring) followed by a decrease in K offtake for cut 2 (summer) and cut 3 (autumn). The cow (H) treatment often had the highest concentration of K offtake and this usually followed by the pig (H) treatment. In most years the control treatment frequently had the smallest K offtake. In between these two extremes the other nutrient treatments varied across years in K offtake. An evaluation of the concentration of K in herbage and the K offtake was also undertaken on an annual basis (Figure S4). The nutrient treatment effects observed for annualized data are very similar to those for each harvest cut (Figures 2 and 3).
The effect of nutrient treatments (Cow (L), Cow (M), Cow (H), Pig (L), Pig (M), Pig (H), control and NPK) on K offtake (kg K/ha) for each harvest cut (spring, summer and autumn) from 1970 to 2018; the average standard error of the difference (SED) of the mean and P value are for the nutrient treatment.

Slurry rate and slurry type effects on Herbage K and K offtake
The rate of slurry had significant effects (P < 0.001) on the herbage K (g/kg) and K offtake (kg K/ha); with the overall mean values calculated from 1971 to 2018 (Table S8). The highest herbage K and K offtake was for the medium level treatment and the lowest values were for the control treatment. The values for the high slurry treatment were less than for the low slurry treatment.
The type of slurry had significant effects (P < 0.001) on the herbage K (g/kg) and the K offtake (kg K/ha). The overall mean values for each slurry type were calculated between 1971 and 2018 (Table S8). The cow slurry had significantly higher herbage K and K offtake compared to the pig slurry treatment. The values for the pig slurry treatment were similar to the NPK treatment and the control had the lowest values.
The rate of slurry had significant effects (P < 0.001) at each harvest cut on the concentration of herbage K (g/kg) (Figure 4). The temporal changes in the concentration of herbage K (g/kg) are shown from 1970 to 2018 and the significant year effects were found at each harvest cut. The significant interaction between treatment factors (Year × Cut × Rate) confirms the requirement to evaluate the concentration of herbage K at each harvest cut separately. The largest differences between the rate of slurry treatments were during the first 25 years of the experiment. During this period there was a greater number of observations that were less than the estimated critical K concentration. There were also seasonal aspects to the rate effects and the largest rate effects were in spring (harvest cut 1). The rate of slurry had a positive increasing effect on the concentration of herbage K, although the rate effects were smaller at harvest cut 2 and 3. The NPK mineral fertilizer treatment was often close to the critical concentration (Lunnan et al., Reference Lunnan, Øgaard and Krogstad2018; Whitehead, Reference Whitehead2000).
The effect of the rate of slurry (control, NPK, low, medium and high) on the herbage K (g/kg) for each harvest cut (1. spring, 2. summer and 3. autumn) from 1971 to 2018; the horizontal dashed line represents the critical K concentration (Lunnan et al., Reference Lunnan, Øgaard and Krogstad2018; Whitehead, Reference Whitehead2000); the average standard error of the difference (SED) of the mean and P value are for the rate of slurry treatment.

The type of slurry treatment had significant effects (P < 0.001) on the K offtake (kg K/ha) at each harvest cut (Figure 5). The K offtake (kg K/ha) fluctuated from year-to-year after the experiment commenced in 1970. At each harvest cut significant year effects on K offtake were found. The K offtake was clearly greater with increasing slurry rate. The NPK and low slurry rate often had similar K offtake values. The K offtake for the control treatment decreased sharply in the first five years of the experiment, but has maintained a similar value since then. Annual presentation of the slurry rate effects on the concentration of K in herbage and the K offtake is given in Figure S4. The annual trends for the slurry rate treatment for annual data are similar to that shown for each harvest cut (Figures 6 and 7).
The effect of the rate of slurry (control, NPK, low, medium and high) on the annual K offtake (kg K/ha) each harvest cut (1. spring, 2. summer and 3. autumn) from 1971 to 2018; the average standard error of the difference (SED) of the mean and P value are for the rate of slurry treatment.

The effect of the type of slurry (control, NPK, low, medium and high) on the herbage K (g/kg) for each harvest cut (1. spring, 2. summer and 3. autumn) from 1971 to 2018; the horizontal dashed line represents the critical K concentration (Lunnan et al., Reference Lunnan, Øgaard and Krogstad2018; Whitehead, Reference Whitehead2000); the average standard error of the difference (SED) of the mean and P value are for the type of slurry treatment.

The effect of the type of slurry (control, NPK, low, medium and high) on the annual K offtake (kg K/ha) each harvest cut (1. spring, 2. summer and 3. autumn) from 1971 to 2018; the average standard error of the difference (SED) of the mean and P value are for the type of slurry treatment.

For each harvest cut the type of slurry effects (P < 0.001) clearly show the significantly greater concentration of herbage K (g/kg) for the cow slurry compared to the pig slurry (Figure 6). Significant year effects were detected on the concentration of herbage K from 1970 to 2018. Distinct differences were found between the harvest cuts with a greater range of concentrations at cut 1 (spring) compared to cut 2. At cut 2 there was a larger number of observations less than the critical K concentration and this often included the pig slurry treatment. The NPK treatment was typically less than cow slurry, but more than the pig slurry treatment. For cut 3 the cow slurry treatment was close to or >30 g K/kg.
The type of slurry effects (P < 0.001) on the K offtake fluctuated significantly from 1970 onwards (Figure 7). The year effects are consistent with the significant treatment interaction effects (P < 0.001) for the K offtake. The highest K offtake values in cut 1 and there was a decrease to cut 2 and cut 3. The K offtake for the cow slurry increased over time and always the NPK and pig slurry treatments were often very similar to each other. At cut 1 there was a steady decrease in the K offtake for the control treatment over time, but after five years from the experiment commencement thereafter it remained very low. A similar trend was found for the control K offtake at cut 2 and 3. For each year the mean concentration of K in herbage and the total K offtake was calculated (Figure S5). The nature of the type of slurry effects for annualized data are very similar to those for each harvest cut (Figures 6 and 7).
Partial K balance
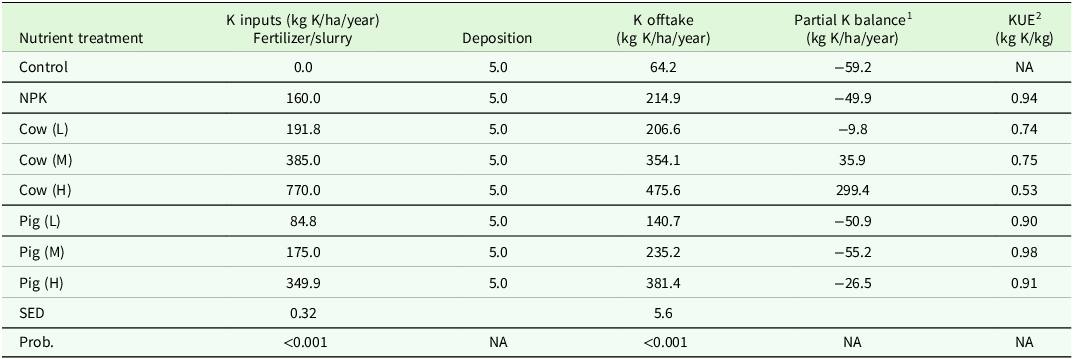
An evaluation of the long-term mean K inputs (kg K/ha) (fertilizer/ slurry and deposition), K herbage offtake was undertaken to determine the partial soil K balance based on data collected from 1970 to 2018 (Table 3). A very large range was found between the applied K inputs for the different nutrient treatments. The highest K input was for the cow (H) treatment which was over twice the amount of the pig (H) treatment and 4.8 times the mineral fertilizer (NPK) treatment. At the same corresponding rate, the cow slurry treatments were all more than two times the pig slurry treatments. The K lost in the measured herbage offtake varied significantly between the nutrient treatments. The cow (H) treatment had the highest K herbage offtake, while the lowest K offtake was for the control treatment. The NPK and cow (L) treatments had very similar K herbage offtake. The calculated partial K balance was negative for several nutrient treatments including the control and NPK treatments, the low (L) rate for cow slurry and all rates for pig slurry. In contrast, the medium (M) and high (H) cow slurry rates were positive. On average the K balance for the cow slurry treatments was much higher than the pig slurry treatments (at the same corresponding rate). In accord with these differences in the K balance there were large differences between the nutrient treatments in the KUE. The pig slurry treatments had much higher KUE values than the cow slurry treatments, however there were inconsistent slurry rate effects on the KUE.
Long-term mean K inputs (kg K/ha/year) (fertilizer/ slurry and deposition), K herbage offtake, the partial K balance and K use efficiency for each nutrient treatment (control, NPK, Cow (L), Cow (M), Cow (H), Pig (L), Pig (M) and Pig (H)) from 1970 to 2018

1 The partial soil K balance was calculated as the applied K inputs and the atmospheric deposition of K minus the K offtake (see Equation 1).
2 The K use efficiency was calculated as the K offtake for each nutrient treatment subtracted by the K offtake in the unfertilized control then divided by the applied Mg input slurry, excluding the K deposition.
For the purposes of general indication only the estimated K losses in leaching and run-off were determined using the OVERSEER model (Table S9). These estimates of K losses suggest that there could be very large differences between the nutrient treatments. Moreover, the size of K losses are increased according to the level of applied K inputs with the greatest estimated K losses for the high (H) cow slurry treatment.
Discussion
Intensively managed grasslands are by their nature highly dynamic in terms of the inputs and removals of nutrients (Kayser and Isselstein, Reference Kayser and Isselstein2005). The long-term slurry experiment detailed in this study was established in 1970 and provides a unique opportunity to evaluate differences between a range of industry-relevant nutrient inputs and the subsequent changes over time in K for the soil and the herbage. The focus here on K is valuable as it is a macronutrient that has been neglected in recent years (McCarthy et al., Reference McCarthy, Wall, Forrestal, Casey and Humphreys2024; Öborn et al., Reference Öborn, Andrist-Rangel, Askekaard, Grant, Watson and Edwards2005).
The impact of different sources of K inputs
Recent concerns regarding the sustainability of current farming practices have focused on the utilization of mineral resources to supply the requirements for fertilizers. For instance, there has been attention on high fertilizer prices (Brownlie et al., Reference Brownlie, Alexander, Maslin, Cañedo-Argüelles, Sutton and Spears2024). A response to these input cost pressures could be a greater reliance on organic nutrient inputs and survey data from 2014 to 2023 does indicate that increasing areas of arable land and grassland are receiving a dressing of organic manure (DEFRA, 2024). The contribution of organic manure is a significant, although potentially highly variable source of nutrients. There is always year-to-year variability in the concentration of nutrients and between the different types of manures. In this study there was evidence of higher K concentration of the cow slurry compared to the pig slurry as an example (Table S3). The concentration of K was on average three times greater for cow slurry than pig slurry and as a result the applied K inputs were 2.2 times higher for the cow slurry (Table 3). As a comparison even the low application rate (50 m3/year) of cow slurry increased the concentration of SEK, while the SEK values for pig slurry decreased over the same period (Figure S2). A comparison of both cow manure and pig slurry reported that the pig slurry needed to be supplemented with 50 % additional K (as potassium sulphate) because of the low K% of the pig slurry (Domingo-Olivé et al., Reference Domingo-Olivé, Bosch-Serra, Yagüe, Poch and Boixadera2016). Therefore, cow slurry could be strategically used because of the comparatively high K concentration. The contribution of K from cattle manure has been shown to ensure that a K balance can be maintained on UK grassland soils (Berry et al., Reference Berry, Stockdale, Sylvester-Bradley, Philipps, Smith, Lord, Watson and Fortune2003). However, the application of slurry is associated with the risk of leaching, especially on sandy soils and so it is important that it is carefully applied to the soil (Smith and Van Dijk, Reference Smith, Van Dijk, Van Der Meer, Unwin, Van Dijk and Ennik1987). Moreover, the K in slurry and farmyard manure is more mobile than K from KCl or K2SO4 (Johnston et al., Reference Johnston, Goulding and Mercer1993). Grassland which includes inputs of cow slurry or cattle farm yard manure allows for on-farm recycling of K, although the rates of organic inputs need to be optimized to maintain a healthy K balance (McCarthy et al., Reference McCarthy, Wall, Forrestal, Casey and Humphreys2024; Öborn et al., Reference Öborn, Andrist-Rangel, Askekaard, Grant, Watson and Edwards2005).
Factors affecting the changes in and the management of soil K
The observed differences in both SEK and plant K were strongly influenced by the nutrient treatments. These effects are responsive to wide range in the applied K inputs (Table 3). For example, the cow (H) treatment had the highest concentration of SEK which corresponds with the highest K input levels and the greatest K offtake. The SEK which was measured represents K in the soil which is available to plants which correlates well with the K offtake of silage herbage (Fortune et al., Reference Fortune, Robinson, Watson, Philipps, Conway and Stockdale2005). The implications of the nutrient treatment effects on SEK is assisted with the Nutrient Management Guide (RB209) which provides recommendations for potash applications for grassland (AHDB, 2017). The RB209 provides guidance on the nutrient input requirements in the UK. For the upper soil depth (0–5 cm) interval which is most relevant for grassland all treatments that were above the optimal soil K index value (i.e., 2−/2+) (Table S1). It is recommended that no K is applied for grass silage for nutrient treatments with a concentration of SEK that corresponds with a K index of 4 or higher (AHDB, 2017). The remaining treatments (control, NPK, pig (L) and pig (M)) were within the optimal index range of SEK. In specific, the SEK values at the 0–5 cm depth indicates that adequate K had been supplied. In an earlier assessment (i.e., up to 2002 data) of this long-term experiment Murphy et al. (Murphy et al., Reference Murphy, Stevens and Christie2005) reported that for the 0–5 cm depth interval the application of cow and pig slurry increased the concentration of exchangeable K, but no effect detected for the NPK treatment. This is a similar finding as shown for the concentration of SEK with results until 2018 (Table 3). K in the soil can be determined using a range of different chemical reagents and each soil test can be related to different pools or components of soil K. (Bell et al., Reference Bell, Thompson, Moody, Murell, Mikkelsen, Sulewski, Norton and Thompson2021). The SEK corresponds with surface absorbed K and assists in understanding nutrient treatment effects and trends, but it does not represent all of the K which plant roots can access. Alternative soil extractants can measure the less readily available K such as ‘non-exchangeable’ K (Bell et al., Reference Bell, Thompson, Moody, Murell, Mikkelsen, Sulewski, Norton and Thompson2021). Future research which evaluates the long-term changes in soil K should include the measurement of other soil K tests such as the sodium tetraphenylboron (NaTPB) method (Kirkman et al., Reference Kirkman, Basker, Surapaneni and MacGregor1994).
The reserves of K in grassland soils can be explained according to the soil mineralogical composition (Andrist-Rangel et al., Reference Andrist-Rangel, Hillier, Öborn, Lilly, Towers, Edwards and Paterson2010). For instance, micas have been quantified as an important K-bearing mineral (Öborn et al., Reference Öborn, Edwards and Hillier2010). The contribution of the mineralogy is helpful to explain the supply and replenishment of K of the soil. In fact, the control treatment had a similar concentration of SEK for the 0 to 5 cm depth interval for the duration of this study (Figure 1). An explanation for this is the relative abundance of mica (at least 15 %) in soils formed on shale in Northern Ireland (Ashton et al., Reference Ashton, Tye, Pattrick and Van Dongen2016). Thus, the presence of mica, illite and other minerals in the soil were able to supply the K for a reduced level of plant growth in the control treatment. For the control treatment the inherent (or native) soil available K was not able to supply all of the K removed in the herbage biomass.
An evaluation of the other two depth intervals (5–10 and 10–15 cm) provides another perspective. The overall mean concentration of SEK at these depths corresponds with either index 0 or 1 (Table 3). The changes over time at these depths suggests that there has been mining of K for selected treatments (Figure 1). For instance, evaluating the results from 1970 until 2018 it is clear that there was a distinct decrease in the concentration of SEK for the control, NPK, pig (L) and pig (M) treatments. The likelihood of K mining is supported by the corresponding low concentration of herbage K for these treatments (Figure 2). Selected nutrient treatments had herbage K concentrations which were lower than the critical K concentration (Lunnan et al., Reference Lunnan, Øgaard and Krogstad2018; Whitehead, Reference Whitehead2000). Mining of K is not unusual in grasslands (Korsaeth, Reference Korsaeth2012). For instance, Öborn et al., (Reference Öborn, Edwards and Hillier2010) reported significant depletion of soil exchangeable K on a loamy sand soil with a ryegrass based rotation. Moreover, the decrease in the concentration of SEK was accompanied by a fall in the concentration of herbage K over a 30-year period. This confirms the value and importance of long-term experiments to fully understand the effects of nutrient management and to determine the nutrient requirements for grassland or crops (Johnston and Poulton, Reference Johnston and Poulton2018). Indeed, the evaluation of K in the soil and the crop (herbage in this case) provides a more complete understanding of the K status rather than just consideration of soil or plant data only.
K extraction from depth is likely to be an important consideration especially for those treatments (i.e., the control and low slurry rates) which supplied low K inputs. The sampling and measurement of SEK was only to 15 cm depth in this study and so it is not possible to determine the amount of sub-soil K extraction. Further research that evaluates deeper (i.e., >15 cm) soil profile layers is required to understand the changes in soil SEK, overall soil K uptake and the soil K balance.
The sustainable management of herbage K
There is some debate regarding the critical K concentration for herbage. A value of 18 g/kg was used in this study which is based on a results from a Timothy and meadow fescue dominant sward (Lunnan et al., Reference Lunnan, Øgaard and Krogstad2018) and a perennial ryegrass sward (Whitehead, Reference Whitehead2000). This is appropriate because the sward contains a mixture of species which includes fescue and perennial ryegrass (Liu et al., Reference Liu, Zhu, Christie and Laidlaw2010). A recent Irish study on a ryegrass-clover (red and white) sward mixture calculated the critical K concentration at 25 g/kg (McCarthy et al., Reference McCarthy, Wall, Forrestal, Casey and Humphreys2024). If the higher critical K concentration by McCarthy et al. was applied in this study, then most nutrient treatments except for the cow (H) treatment would be classified as K deficient (Figures 4 and S1). This suggests that further research is required to confirm the critical K concentration for common grass species such as Lolium perenne. It is worth noting that the critical K concentration for clover (reported as 10 g/kg) is significantly less than grasses (Whitehead, Reference Whitehead2000). Thus, there is a current need for determining the critical K concentration of clover-rich and multi-species swards which have recently become an emerging feature of grasslands (Malisch et al., Reference Malisch, Finn, Eriksen, Loges, Brophy and Huguenin-Elie2024; Shackleton et al., Reference Shackleton, Boland, Kennedy, Grace, Beaucarne, Kirwan, Schmidt and Sheridan2024; Suter et al., Reference Suter, Huguenin-Elie and Lüscher2021).
There are potentially negative impacts of excessive K inputs to grassland. A positive and large K balance is often associated with increased concentrations of K in the herbage. This was observed for the cow (H) treatment which has both a high concentration of herbage K (Figure 4) and a large partial K balance (Table 3). The excessive supply of K leads to ‘luxury’ consumption which can lead to hypomagnesaemic tetany for grazing ruminant livestock (Kemp & ‘t Hart Reference Kemp and ‘t Hart1957; Mayland and Wilkinson, Reference Mayland and Wilkinson1989). Indeed, the significant slurry type effect on the herbage concentration of K showed that cow slurry had the most risk of increased K levels (Figure 6) and increased slurry rates are also a problem (Figure 4). Thus, these results suggest that for cow slurry there is a greater risk of luxury K concentrations than for pig slurry and this has implications for grassland management recommendations. Grass tetany can cause negative impacts on livestock health (Foster et al., Reference Foster, Livesey and Edwards2007). A survey of farmers in the UK has reported that this nutrient-related disorder affects 39 % of their livestock (Kumssa et al., Reference Kumssa, Penrose, Bone, Lovatt, Broadley, Kendall and Ander2019). The estimation of the K balance provides some indication of the potential risk of tetany. Indeed, evaluation of soil extractable Mg and herbage Mg in a separate study of this long-term experiment showed that high rates of cow slurry significantly are risky and exceeded the Tetany Index threshold after 15 years of slurry application (Holland et al., Reference Holland, Gordon and McLenaghen2025). However, the identification of grass tetany is complex and is not directly related to herbage K status. For instance, the soil/ herbage status of Mg is an important factor which can explain grass tetany (Foster et al., Reference Foster, Livesey and Edwards2007). Further research is required to examine the impact of nutrient management (including slurry applications) on the development of grass tetany and problems associated with increased herbage concentrations of K.
After N, K is often described as the most important macronutrient for plant growth; K plays a key role in photosynthesis, plant-water relations and protein synthesis (Marschner, Reference Marschner2011). While essential for the healthy growth of herbage the importance of K is cannot be considered without consideration of other nutrients. Herbage with deficient concentrations of K do not respond to applied K if there is insufficient N applied (Øgaard and Hansen, Reference Øgaard and Hansen2010). In the context of this study, the applied slurry treatments include sufficient amounts of N and P (Table S3). Nevertheless, the key finding from this study is the significant contrast between the cow and pig slurry on the concentrations of both SEK and herbage K.
Management impacts on the partial K balance
A wide range in the applied K inputs is the main factor that explains differences between the nutrient treatments for the partial K balance (Table 3). The highest K balance values were for the cow slurry treatments and this is consistent with reports of organic farms which rely on manure as their sole source of K (Berry et al., Reference Berry, Stockdale, Sylvester-Bradley, Philipps, Smith, Lord, Watson and Fortune2003). At this site the calculated K deposited from the atmosphere was very small and has little effect on the overall K inputs. The K inputs from atmospheric deposition are associated with a significant degree of uncertainty. A value of 5 kg K/ha/year was estimated based on the calculations of (O’Carroll and McCarthy, Reference O’Carroll and McCarthy1973). Vanguelova et al. (Reference Vanguelova, Benham and Nisbet2022) reported a range of K deposition values between 2.6 and 6.9 kg K/ha/year for ten sites across Great Britain. While compared with the K inputs from slurry or fertilizer the estimated atmospheric K inputs are small, however they are especially important for grasslands under low input or extensive management. Indeed, K from atmospheric deposition was the only input for the control treatment (Table 3). The K inputs from deposition have been found to balance the K removed from harvest of plantation forests in Ireland (Johnson et al., Reference Johnson, Aherne and Cummins2015). Further research is required to directly measure the K inputs from atmospheric deposition to improve the accuracy of this key component of the K balance. This source of K is especially relevant for low input or extensive grasslands such as are found in upland areas of the UK and elsewhere.
The partial K balance (Table 3) does not account for all K in this system. Thus, there is a need for better understanding on the K leached or lost (‘unaccounted K’) via run-off from grasslands. Kayser and Isselstein (Reference Kayser and Isselstein2005) reported a wide range in K losses from <1.5 to 110 kg K/ha in mown grassland; while K losses could be as high as 185 kg K/ha from under urine patches. These large differences in K losses can be explained by differences according to the soil type (texture) and management practices. Other soil factors such as the soil structure and the presence of preferential flow also influence the magnitude of K leached (Kayser and Isselstein, Reference Kayser and Isselstein2005). A large-scale assessment of nutrient balances in Northern Ireland by Foy et al., (Reference Foy, Bailey and Lennox2002) found that drainage losses of K can be very high and can reduce the K balance by almost 50 %. A high percentage of K losses were reported with farm-scale observations for a grassland-based dairy farm in the Republic of Ireland (McCarthy et al., Reference McCarthy, Wall, Forrestal, Casey and Humphreys2024). McCarthy et al. reported that K leaching was 55 % of the total K losses and leaching was greater than the K exported in milk or other products. In the present study no direct measurement of the K lost in leaching or run-off was undertaken in this study, however modelled estimates suggest that K losses could be up to 198 kg K/ha/year (Table S9). It is recognized that there is significant uncertainty is associated with these modelled estimates of K leached which was determined via simulation with the OVERSEER model (Wheeler et al., Reference Wheeler, Ledgard and DeKlein2008) (Table S9). Future research is required to directly measure the K leaching losses and validate the K leaching estimates determined using OVERSEER. Another factor which influences K leaching is the balance between the N and K inputs and the greatest leaching of K is without N fertilizer (Brummerloh and Kuka, Reference Brummerloh and Kuka2023). Therefore, the leaching of K should be considered in conjunction with both N and P to ensure the overall nutrient balance is suitable for sustainable herbage production and the preservation of water quality standards.
Conclusion
Intensive nutrient management of a mown grassland can lead to large differences in the SEK and the K in the herbage biomass. The supply of K from the cow slurry treatments was significantly greater than the pig slurry. Long-term trends indicate mining of K for the pig slurry, mineral fertilizer (NPK) and control treatments. High rates of slurry led to luxury consumption of K which increases the risk of herbage cationic imbalance such as grass tetany. The optimization of K inputs are required to improve the sustainability of grassland production systems and to balance K inputs and losses to avoid both K deficiency and excessive K accumulation. Farmers and land managers ought to consider applying a pragmatic mixture of K inputs from organic sources (e.g. slurry) and mineral fertilizer (according to local resources) to achieve efficient and responsible grassland agriculture.
Supplementary material
The supplementary material for this article can be found at https://doi.org/10.1017/S0021859626100550
Acknowledgements
The authors would like to thank the technical assistance provided for the field work in this study by G. Ridgway, E. Mulligan, E-A. Wasson, N. Crumlish, J. Larkin, N. McCloskey and B. Wallace. We would like to acknowledge the laboratory analysis by H. McKeating and A. Wright.
Author contributions
Conceptualization: JH; data curation: JH; formal analysis: JH, AG and RM; methodology: JH, AG; project administration: JH; supervision: JH; statistical analysis and visualization: AG; writing– original draft: JH; writing– review and editing: JH, AG and RM.
Funding statement
This study was supported by the DAERA (Department of Agriculture, Environment and Rural Affairs) Evidence & Innovation fund, Northern Ireland (Project number 41499).
Competing interests
The authors declare that they have no known competing financial interests or personal relationships that have influenced the results in this paper.
Ethical standards
Not applicable.