Introduction
Pastures in tropical and subtropical environments largely consist of C4 forage species such as bermudagrass (Cynodon dactylon L.), bahiagrass (Paspalum notatum Flugge), and limpograss [Hemarthria altissima (Poir.) Stapf & C.E. Hubb.] (Vendramini Reference Vendramini2010). Due to their anatomical and morphological characteristics, these forages are often low in digestibility and crude protein compared to C3 species (Vendramini Reference Vendramini2010). Therefore, supplements are added to animal diets to improve digestibility and crude protein of poor-quality forage grasses (Graham and Vance Reference Graham and Vance2003). While supplementation with feedstuffs or molasses is common, legumes are a preferred supplement to meet the dietary needs of livestock (Foster et al. Reference Foster, Myer, Adesogan, Carter, Sollenberger and Blount2017; Williams et al. Reference Williams, Chase and Hammond2004). Perennial peanut, such as pinto peanut (Arachis pinto Krap. and W.C. Greg.) or rhizoma perennial peanut (RPP) is grown in the Gulf Coast region of the United States, and commonly used as supplementation for improving digestibility and nutrient value of C4 grasses (Mislevy et al. Reference Mislevy, Williams, Blount and Quesenberry2007; Quesenberry et al. Reference Quesenberry, Blount, Mislevy, French, Williams and Prine2010; Villarreal et al. Reference Villarreal, Cochran, Villalobos, Roja-Bourrillon, Rodriguez and Wickersham2005).
RPP is a rhizomatous, prostrate growing, perennial herbaceous legume that grows from a strong tap root and forms a dense mat of stolons (Ball and Hoveland Reference Ball and Hoveland2015; Williams et al. Reference Williams, Newman and Blount2017). Tetrafoliolate leaves are comprised of linear-lanceolate leaflets measuring 4 cm long and 2 cm wide (Cook et al. Reference Cook, Pengelly, Brown, Donnelly, Eagles, Franco, Hanson, Mullen, Partridge, Peters and Schultze-Kraft2005). RPP is native to Brazil and it is widely used as livestock forage in the tropical and subtropical regions because of its high nutritive value and persistence under a wide range of management conditions (Williams et al. Reference Williams, Newman and Blount2017). Various varieties of RPP are grown in Florida, including Florigraze, Ecoturf, UF-Tito, UF-Peace, and Arblick, and newer varieties are continuously introduced and evaluated for potential use.
Because RPP produces few viable seeds, it is propagated primarily by planting rhizomes. Establishment of RPP is typically slow and can take up to 2 yr to achieve a productive sward (Mislevy et al. Reference Mislevy, Williams, Blount and Quesenberry2007). During establishment, broadleaf weeds are typically managed by timely applications of the herbicide imazapic. Mislevy et al. (Reference Mislevy, Williams, Blount and Quesenberry2007) reported that two applications of imazapic at 70 g ai ha−1 at 60 d after planting and 4 mo after the first application provided effective weed control during the first year of establishment. However, with widespread ALS-resistant weed species and limited herbicide registered on RPP, weed management remains as one of the major challenges for successful establishment and production. The presence of weeds can compromise palatability or diminish stands. Likewise, weed interference decreases forage/pasture yield, compromises forage value, and competes with desirable crop species, and has resulted economic loss of about $180 million to Florida ranchers (Sellers and Ferrell Reference Sellers and Ferrell2018).
Similar to other crops, chemical weed control is a critical tool for reducing weed populations in perennial peanut stands (Valencia et al. Reference Valencia, Williams and Sollenberger1999). However, few herbicides are registered for use on RPP, and published information on RPP tolerance to postemergence herbicides is limited. Herbicide applied without proper information can cause undesirable injury to RPP, desiccate foliage, and result in total plant loss. Previous researchers have suggested that imazapic use results in minimal RPP injury at any growth stage (Ferrell et al. Reference Ferrell, Sellers and Mudge2006; Mislevy et al. Reference Mislevy, Williams, Blount and Quesenberry2007). RPP was found to be tolerant to 2,4-D (at 0.56 kg ha−1) and hexazinone (at 0.28 kg ha−1) applied at 3 d after clipping (Ferrell et al. Reference Ferrell, Sellers and Mudge2006). Additionally, RPP has illustrated some level of tolerance to glyphosate and triclopyr (Valencia et al. Reference Valencia, Williams and Sollenberger1999), but the detail on the rate for RPP tolerance and the varietal differences for tolerance to these herbicides remains unknown.
Currently, imazapic, 2,4-D, and hexazinone are the only herbicides labeled for broadleaf weed control in RPP production in Florida. The labeled rates of 2,4-D and hexazinone often are not adequate for controlling various problematic weeds such as tropical soda apple (Solanum viarum), dogfennel (Eupatorium capillifolium), licoriceweed (Scoparia dulcis), thistles (Cirsium sp.), and smutgrass (Sporobolus indicus; Sellers and Devkota Reference Sellers and Devkota2020). Therefore, application of additional herbicides such as glyphosate and triclopyr is necessary to increase the weed control efficacy and spectrum in RPP production. However, expanding herbicide options for RPP must be based on crop tolerance as well as weed control. Therefore, understanding RPP tolerance to glyphosate and triclopyr is necessary so as to apply these herbicides safely and without severely injuring the desirable forage.
Materials and Methods
Herbicide Rate Response on Rhizoma Perennial Peanut
Field studies were conducted to evaluate the response of established RPP to various rates of glyphosate and triclopyr. Studies were conducted at a grower’s farm near Zolfo Springs, FL (27.50oN, 81.82oW) in summer of 2015 and 2016. The soil type was St. Lucie fine sand, pH 6. The field was planted with UF-Tito variety in 2012, which indicates that study was conducted on fully established RPP sward. A proportion of the RPP rhizomes were removed from the site to propagate this variety elsewhere approximately 18 mo before the study began.
Prior to treatment application, the experimental areas were clipped to a height of 7.6 cm and biomass was removed. Plants were allowed to regrow for 2 wk and were approximately 10 cm tall with four to six fully expanded leaves. The individual plot size was 1.5 m by 1.5 m. Treatments consisted of glyphosate (Mad Dog Plus, Loveland Products, Inc., Greeley, CO) at 0.14, 0.28, 0.56, 1.12, and 2.24 kg ae ha−1; and triclopyr (Remedy Ultra, Dow AgroSciences, LLC, Indianapolis, IN) at 0.07, 0.14, 0.28, 0.56, and 1.12 kg ae ha−1. An untreated check was included in the study for treatment comparisons. Herbicide treatments were applied on August 5, 2015, and July 14, 2016. Treatments were applied using a CO2-pressurized backpack sprayer calibrated to deliver 281 L ha−1 at 200 kPa using AirMix 11002 spray nozzles (Greenleaf Technologies, Covington, LA). For trial maintenance, clethodim was applied at 0.28 kg ha−1 for grass weed control.
Data Collection and Statistical Analysis
The study was conducted as a randomized complete block design with four replications for each experiment year. Following treatment application, visually assessed crop injury was recorded on a 0% to 100% scale (where 0% = no injury or similar to untreated check and 100% = complete death of the plant) at 15, 30, and 60 d after treatment (DAT). Aboveground RPP biomass was collected from the center 0.25-m2 of each plot at 60 DAT by clipping plants at the soil surface. Plant samples were placed in a forced air-dryer at 60 C for 4 d, and dry biomass was then recorded.
Data for glyphosate and triclopyr were analyzed separately because the objective of this research was to determine the tolerance of RPP to various rates of these herbicides and not to compare the two herbicides. Data were subjected to ANOVA using the PROC MIXED procedure in SAS (version 9.4, SAS Institute, Cary, NC) to determine the interaction between year and herbicide treatment. Year and herbicide rate were considered fixed effects, whereas replication and its interactions with year were considered as random effects. Effect of year and its interaction with replication was nonsignificant; therefore, data were combined over years for further analysis. Prior to analysis, biomass data were multiplied by 4 to obtain biomass on a square meter basis. Regression analysis was performed to determine the effect of increasing glyphosate and triclopyr rates on RPP injury and biomass. Because trends were most accurately described by either linear or quadratic functions, these models were used to establish the predicted line using Sigma Plot 12.0 software (SPSS Inc., Chicago, IL).
Rhizoma Perennial Peanut Varieties and Herbicide Rate Response
Field studies were conducted at the University of Florida Range Cattle Research and Education Center near Ona, FL (27.39oN, 81.94oW) in mid and late summer of 2016. Response of various rates of glyphosate and triclopyr were evaluated on established RPP varieties. The soil type at this location was an Ona fine sand, pH 6. The experimental site was planted in 2005 with four RPP varieties: Ecoturf, Florigraze, ‘PI262833’ (hereafter referred to as ‘Ona 33’, a nonreleased variety), and UF-Tito. The site preparation, plot size, and glyphosate and triclopyr formulation and rates used in this study were the same as those previously mentioned for the Zolfo Springs study. An untreated check was included in the study for treatments comparison. Herbicide treatments were applied on June 23, 2016, and July 19, 2016, as previously described. Clethodim was applied at 0.28 kg ha−1 for grass weed control as needed.
Data Collection and Statistical Analysis
For each herbicide, the study was conducted as a 4 × 6 factorial arrangement in a randomized complete block design with four replications and repeated twice. Main factors were RPP varieties and herbicide rates. Following herbicide application, visually assessed percent RPP injury were recorded on a 0% to 100% scale (where 0% = no injury or similar to untreated check and 100% = complete death of plant) at 15, 30, and 60 DAT. Aboveground RPP and broadleaf weed biomass was collected at 60 DAT by clipping plants at the soil surface, from a 0.25-m2 area for each plot at the center of each plot to avoid border effects. The broadleaf weed present in the research site were licorice weed and tropical soda apple. RPP and broadleaf weed biomass were separated after clipping. Plant samples were dried in a forced air-dryer at 60 C for 4 d, and dry biomass was then recorded.
Data for glyphosate and triclopyr were analyzed separately. Data were subjected to ANOVA using the PROC MIXED procedure in SAS to determine the interaction between experimental run and herbicide rate. Run, herbicide rate, and variety were considered fixed effects, whereas replication and its interactions with run were considered as random effects. Because there was no significant effect of replication and its interaction with run, data were combined over experimental runs for further analysis. Herbicide rate, variety, and interactions were considered fixed effects, whereas replication was considered a random effect. Prior to analysis, biomass data were multiplied by 4 to obtain biomass on a square meter basis. Means separation was performed using Fisher’s protected LSD at P ≤ 0.05. Regression analysis was used to determine the effect of increasing glyphosate and triclopyr rates on RPP injury and biomass using either linear or quadratic equations in Sigma Plot 12.0 software. In addition, ratio analysis was used to determine the herbicide rate for optimum RPP biomass with providing maximum weed control. Ratios were square root–transformed prior to regression analysis and were back-transformed for reporting results in percentage units.
Results and Discussion
Herbicide Rate Response on Rhizoma Perennial Peanut
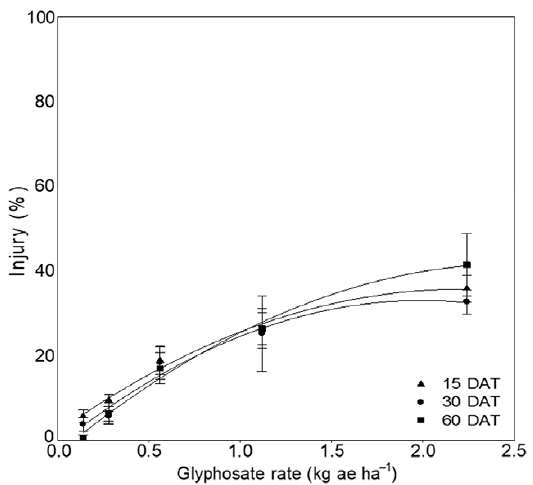
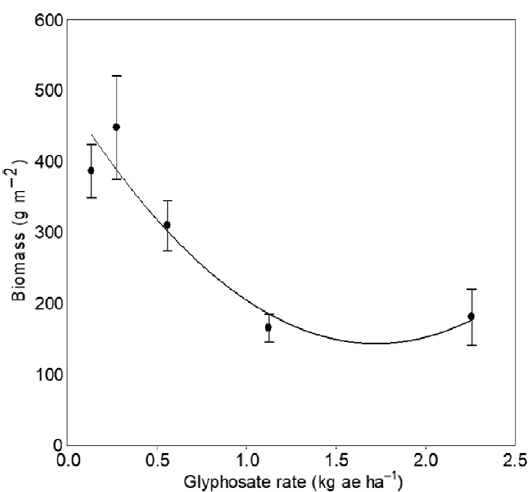
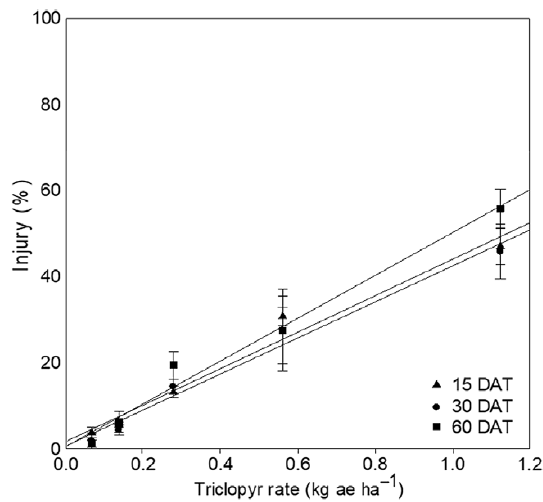
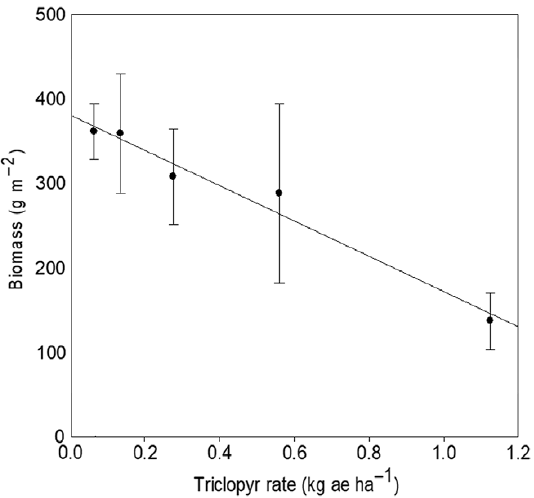
RPP injury followed a quadratic response to glyphosate rates at 15, 30, and 60 DAT (Figure 1). The glyphosate I20 (rate for 20% injury, which is considered to be acceptable by most RPP producers) was estimated to be 0.72, 0.77, and 0.78 kg ae ha−1 at 15, 30, and 60 DAT, respectively. The RPP biomass also followed a quadratic response to glyphosate rate (Figure 2), but a 20% reduction in biomass was estimated at 0.53 kg ae ha−1 at 60 DAT. RPP injury followed a linear response to increasing triclopyr rates at 15, 30, and 60 DAT (Figure 3). Estimated I20 values for triclopyr were 0.47, 0.45, and 0.39 kg ae ha−1 at 15, 30, and 60 DAT, respectively. Perennial peanut biomass also followed a linear response to increasing triclopyr rate, and a 20% reduction in biomass was estimated at 0.45 kg ae ha−1 at 60 DAT (Figure 4). Unlike glyphosate, visual estimations of plant injury may provide a relationship to potential yield loss with using triclopyr. Other forage legume species including blue pea (Clitoria ternatea L.) and perennial soybean (Neonotonia wightii L.) have shown a relatively high tolerance to glyphosate with ED50 values for at 0.6 and 0.33 kg ae ha−1, respectively (Cruz-Hipolito et al. Reference Cruz-Hipolito, Rojano-Delgado, Dominguez-Valenzuela, Heredia, Castro and Prado2011).
Rhizoma perennial peanut injury as a function of glyphosate rate for data combined across 2015 and 2016 at the Zolfo Springs, FL, location. Predicted line is plotted with mean and standard error. The predicted model for 15 DAT is y = −6.9x2 + 30.4x + 2.0 (R 2 = 0.99); 30 DAT, y = −8.6x−2 + 34.1x − 1.2 (R 2 = 0.98); and 60 DAT, y = −7.0x2 + 35.4x − 3.1 (R 2 = 0.99), where y = injury (%) and x = glyphosate rate (kg ae ha−1).

Rhizoma perennial peanut biomass as a function of glyphosate rate for data combined across 2015 and 2016 at the Zolfo Springs, FL, location at 60 DAT. Predicted line is plotted with mean and standard error. The predicted model is y = 117.4x2 − 402.3x + 489.6 (R 2 = 0.89), where y = biomass (g m−2) and x = glyphosate rate (kg ae ha−1).

Rhizoma perennial peanut injury as a function of triclopyr rate for data combined across 2015 and 2016 at the Zolfo Springs, FL, location. Predicted line is plotted with mean and standard error. The predicted model for 15 DAT is y = 42.4x + 1.56 (R 2 = 0.97); 30 DAT is y = 41.9x + 0.55 (R 2 = 0.98); and 60 DAT is y = 49.8x + 0.37 (R 2 = 0.98), where y = injury (%) and x = triclopyr rate (kg ae ha−1).

Rhizoma perennial peanut biomass as a function of triclopyr rate for data combined across 2015 and 2016 at the Zolfo Springs, FL, location at 60 DAT. Predicted line is plotted with mean and standard error. The predicted model is y = −210.7x + 382.8 (R 2 = 0.97), where y = biomass (g m−2) and x = triclopyr rate (kg ae ha−1).

Rhizoma Perennial Peanut Varieties and Herbicide Rate Response
Glyphosate Study
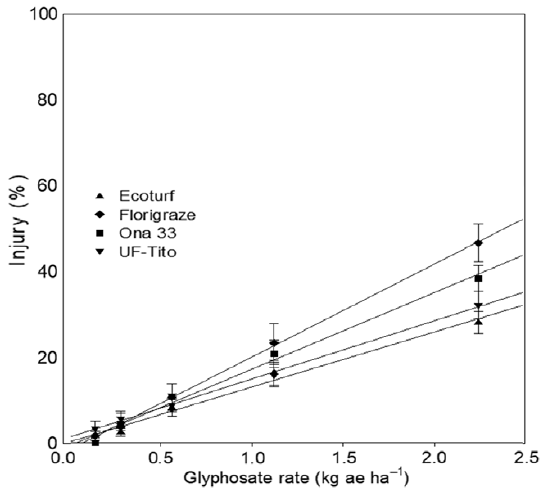
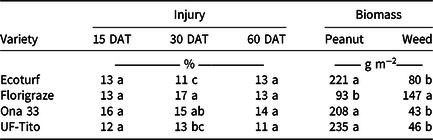
The interaction between variety and glyphosate rate, and the main effect of variety, was significant at 30 DAT; however, only the effect of glyphosate rate was significant at 15 and 60 DAT. The general trend observed between varieties at 30 DAT indicated that Florigraze and Ona 33 were less tolerant to glyphosate than UF-Tito or Ecoturf (Figure 5). Estimates of I20 values were 1.0, 1.17, 1.38, and 1.56 kg ae ha−1 for Florigraze, Ona 33, UF-Tito, and Ecoturf, respectively. When averaged over glyphosate rates, injury to Florigraze was at least 4% greater than that to UF-Tito or Ecoturf at 30 DAT (Table 1). Likewise, Ona 33 exhibited greater injury than Ecoturf. Biomass results corresponded with the injury data for Ecoturf and UF-Tito biomass being at least 2-fold greater than that of Florigraze. Weed biomass in Florigraze was at least 1.8-fold greater compared to other varieties. Overall, Ecoturf was found to be the most tolerant to glyphosate among the four RPP varieties evaluated in this study.
Rhizoma perennial peanut variety injury as a function of glyphosate rate at 30 DAT at the Ona, FL, location. Data are combined across two runs in 2016. Predicted line is plotted with mean and standard error. The predicted model for Ecoturf is y = 12.7x + 0.23 (R 2 = 0.99); Florigraze, y = 21.5x − 1.54 (R 2 = 0.99); Ona 33, y = 17.7x − 0.63 (R 2 = 0.99); and UF-Tito, y = 13.5x + 1.36 (R 2 = 0.99), where y = injury (%) and x = glyphosate rate (kg ae ha−1).

Rhizoma perennial peanut variety injury, biomass, and broadleaf weed biomass averaged over glyphosate rate at the Ona, FL, location.a,b

a Data are combined across two runs in 2016. Glyphosate was applied at 0.14, 0.28, 0.56, 1.12, and 2.24 kg ae ha−1.
b Means within a column followed by the same letter are not different based on Fisher’s protected LSD at P ≤ 0.05.
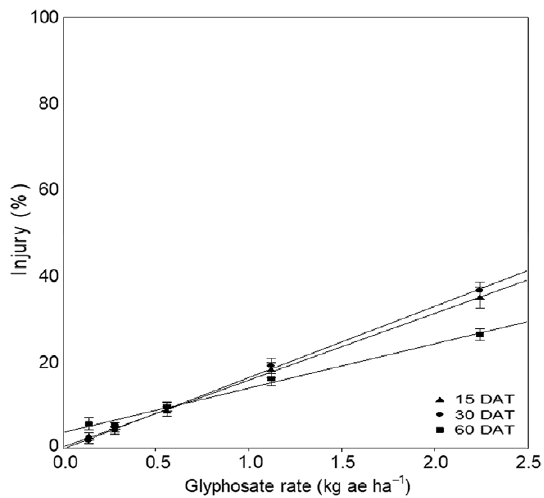
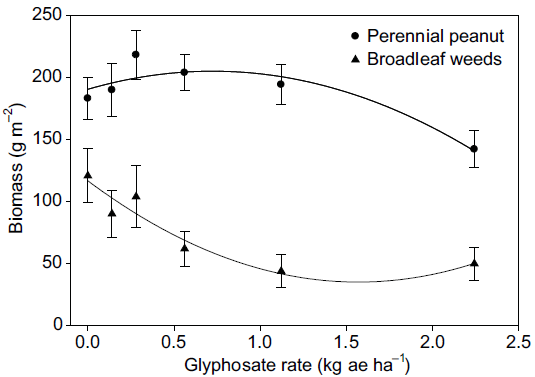
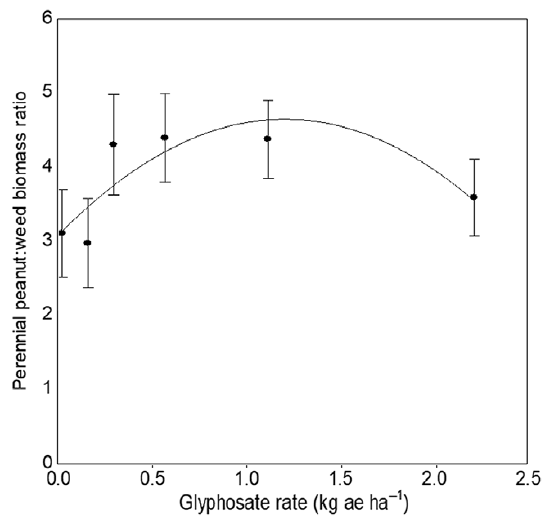
Data averaged across RPP varieties illustrated that injury followed a linear response to increasing glyphosate rate at 15, 30, and 60 DAT (Figure 6). It is also important to note that there was no RPP injury between rating timing at the lower rates of glyphosate; however, injury was greater at 15 and 30 DAT compared to 60 DAT with glyphosate at rates ≥1.12 kg ae ha−1 (data not shown). Estimated I20 values were 1.28, 1.23, and 1.60 kg ae ha−1 at 15, 30, and 60 DAT, respectively. RPP and weed biomass followed a quadratic response to increasing glyphosate rate (Figure 7). In general, RPP biomass after glyphosate application was similar to that of the untreated control except for the highest rate of glyphosate used in the study. Glyphosate applied at 2.17 kg ae ha−1 was estimated to reduce RPP biomass by 20%. Conversely, weed biomass was affected with glyphosate at rates ≥0.56 kg ae ha−1. Ratio analysis estimated that glyphosate at 1.21 kg ae ha−1 resulted in optimum RPP biomass production and weed biomass reduction (Figure 8). At this rate, RPP biomass is estimated at 199 g m−2 (Figure 7), which is similar to the biomass from untreated plots.
Rhizoma perennial peanut injury as a function of glyphosate rate for data pulled across four varieties at the Ona, FL location. Data are combined across two runs in 2016. Predicted line is plotted with mean and standard error. The predicted model for 15 DAT is y = 15.4x + 0.25 (R 2 = 0.99); 30 DAT, y = 16.4x − 0.20 (R 2 = 0.99); and 60 DAT, y = 10.2x + 3.61 (R 2 = 0.99), where y = injury (%) and x = glyphosate rate (kg ae ha−1).

Rhizoma perennial peanut and broadleaf weed biomass as a function of glyphosate rate at 60 DAT for data pulled across four varieties at the Ona, FL, location. Data are combined across two runs in 2016. Predicted line is plotted with mean and standard error. The predicted model for rhizoma perennial peanut is y = −27.9x2 + 40.4x + 190.8 (R 2 = 0.86); and broadleaf weeds, y = 33.3x2 − 104.3x + 117 (R 2 = 0.91), where y = biomass (g m−2) and x = glyphosate rate (kg ae ha−1).

Rhizoma perennial peanut and broadleaf weed biomass ratio as a function of glyphosate rate at 60 DAT at the Ona, FL location. Data are combined across two runs in 2016. Predicted line is plotted with mean and standard error. The predicted model is y = −1.0x2 + 2.5x + 3.1 (R 2 = 0.7), where y = rhizoma perennial peanut and broadleaf weed biomass ratio and x = glyphosate rate (kg ae ha−1).

Previous research indicated that RPP is tolerant to glyphosate at 1.21 kg ae ha−1, and RPP recovered at this rate (Valencia et al. Reference Valencia, Williams and Sollenberger1999). Similarly, Dwyer et al. (Reference Dwyer, O’Hare and Cook1989) observed perennial peanut (A. pintoi Krapov & W.C. Greg.) tolerance to glyphosate. Research by Quesenberry et al. (Reference Quesenberry, Blount, Mislevy, French, Williams and Prine2010) reported that RPP yields were similar among varieties under various environmental and management condition, and the same was found for Ona 33 in relation to other varieties (Mislevy et al. Reference Mislevy, Williams, Blount and Quesenberry2007). However, the biomass of Florigraze was less than that of other varieties in this study. This could be attributed to potential susceptibility of Florigraze to weed competition compared to that of other varieties. Similar results were reported in previous research illustrating that UF-Tito was more competitive with common bermudagrass (Cynodon dactylon L.) than Florigraze (Quesenberry et al. Reference Quesenberry, Blount, Mislevy, French, Williams and Prine2010).
Triclopyr Study
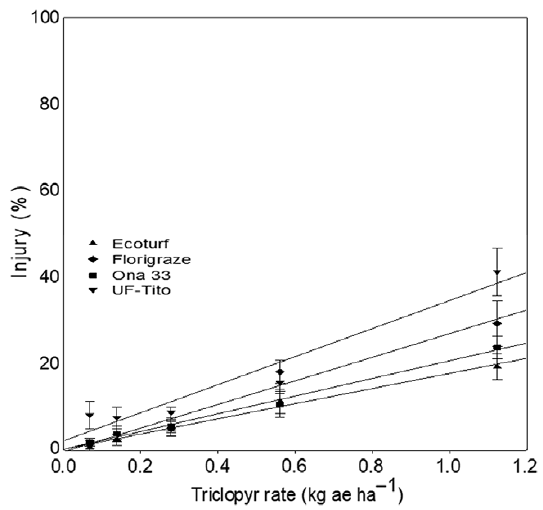
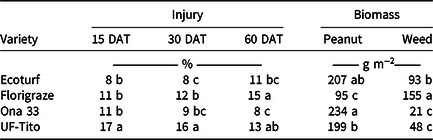
There was no interaction of RPP variety and triclopyr rate, except for injury at 30 DAT, on RPP injury and biomass (data not shown). The main effect of variety or triclopyr rate was significant at 15, 30, and 60 DAT for RPP injury, and for RPP and weed biomass. The RPP injury trend among varieties at 30 DAT indicated that UF-Tito was the least tolerant variety and that Ona 33 and Ecoturf were the most tolerant varieties to triclopyr (Figure 9). Estimated I20 values were 0.55, 0.74, 0.97, and 1.12 kg ae ha−1 for UF-Tito, Florigraze, Ona 33, and Ecoturf, respectively. When averaged over triclopyr rates, injury to UF-Tito was at least 1.5-fold and 1.3-fold greater than injury to the other three varieties at 15 and 30 DAT, respectively, but UF-Tito and Florigraze injuries were similar by 60 DAT (Table 2). Likewise, Florigraze biomass was at least 2.1-fold lower than that of other varieties, and this result was similar to that with glyphosate. Weed biomass collected from Florigraze plots was at least 1.7-fold greater compared with that of other varieties. As mentioned previously, the difference in Florigraze biomass may be due to weed competition at this location because this variety is reported to be more susceptible to weed competition because of its prostrate growth habit (Mislevy et al. Reference Mislevy, Williams, Blount and Quesenberry2007).
Rhizoma perennial peanut variety injury as a function of triclopyr rate at 30 DAT at the Ona, FL, location. Data are combined across two runs in 2016. Predicted line is plotted with mean and standard error. The predicted model for Ecoturf is y = 17.6x + 0.23 (R 2 = 0.99); Florigraze, y = 27.4x − 0.37 R 2 = 0.97); Ona 33, y = 20.5x + 0.21 (R 2 = 0.99); and UF-Tito, y = 32.5x + 2.11 (R 2 = 0.94), where y = injury (%) and x = triclopyr rate (kg ae ha−1).

Rhizoma perennial peanut variety injury, biomass, and broadleaf weed biomass averaged over triclopyr rate at the Ona, FL, location.a,b

a Data are combined across two runs in 2016. Triclopyr was applied at 0.07, 0.14, 0.28, 0.56, and 1.12 kg ae ha−1.
b Means within a column followed by the same letter are not different based on Fisher’s protected LSD at P ≤ 0.05.
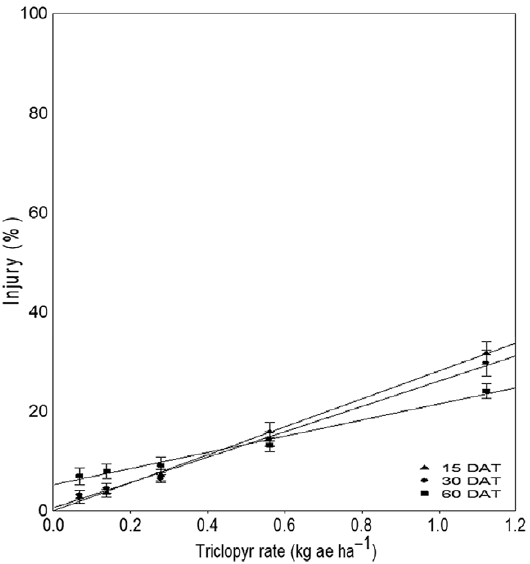
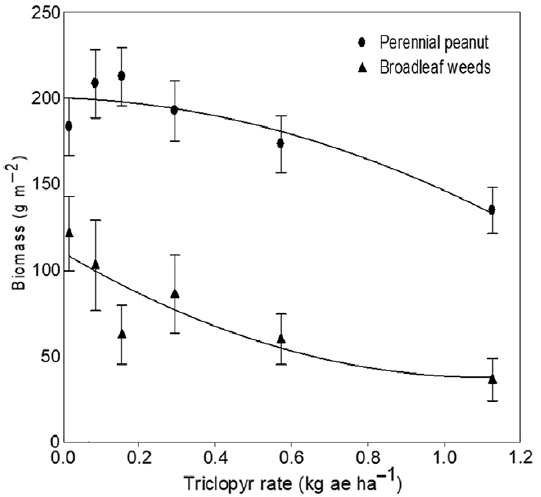
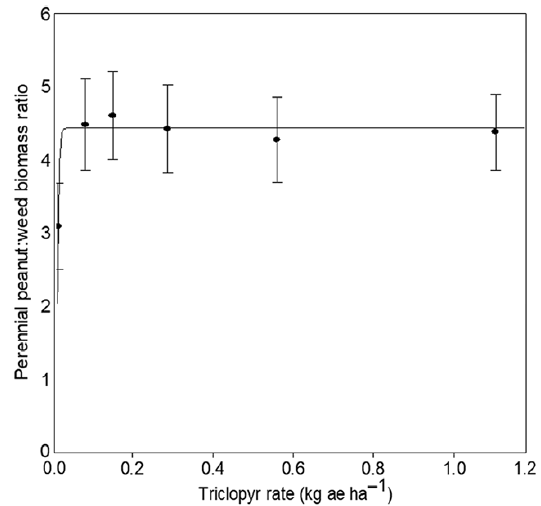
Data averaged across varieties illustrated that RPP injury followed a linear response to increased triclopyr rates at 15, 30, and 60 DAT. Estimated I20 values were 0.74, 0.79, and 0.95 kg ae ha−1, respectively (Figure 10). In general, more injury was observed at 15 and 30 DAT than at 60 DAT. RPP and weed biomass followed a quadratic response to increasing triclopyr rates (Figure 11). RPP biomass was similar to that of the untreated control except when triclopyr was used at 1.12 kg ae ha−1; however, the weed biomass was reduced at rates greater than 0.56 kg ae ha−1. Based on regression estimates, triclopyr at 0.99 kg ae ha−1 was required for 20% RPP biomass reduction. This result contrasts with that of previous research that evaluated the effect of triclopyr on RPP, in which 0.56 kg ae ha−1 resulted in 30% to 50% biomass reduction at 60 DAT (Valencia et al. Reference Valencia, Williams and Sollenberger1999). Furthermore, those authors reported that RPP regrowth occurred 2 mo after triclopyr application. The ratio analysis estimated that triclopyr rate above 0.07 kg ae ha−1 would result in optimum RPP biomass production and weed biomass reduction (Figure 12). Valencia et al. (Reference Valencia, Williams and Sollenberger1999) reported that triclopyr was very effective at reducing broadleaf weeds in RPP swards.
Rhizoma perennial peanut injury as a function of triclopyr rate for data pulled across four varieties at the Ona, FL, location. Data are combined across two runs in 2016. Predicted line is plotted with mean and standard error. The predicted model for 15 DAT is y = 27.3x − 0.07 (R 2 = 0.99); 30 DAT, y = 24.7x + 0.51 (R 2 = 0.99); and 60 DAT, y = 15.7x + 5.02 (R 2 = 0.99), where y = injury (%) and x = triclopyr rate (kg ae ha−1).

Rhizoma perennial peanut and broadleaf weed biomass as a function of triclopyr rate at 60 DAT for data pulled across four varieties at the Ona, FL, location. Data are combined across two runs in 2016. Predicted line is plotted with mean and standard error. The predicted model for rhizoma perennial peanut is y = −45.7x2 – 8.8x + 200.2 (R 2 = 0.84); and broadleaf weeds, y = 58.0x2 − 127.9 + 108 (R 2 = 0.77), where y = biomass (g m−2) and x = triclopyr rate (kg ae ha−1).

Rhizoma perennial peanut and broadleaf weed biomass ratio as a function of triclopyr rate at 60 DAT at the Ona, FL, location. Data are combined across two runs in 2016. Predicted line is plotted with mean and standard error. The predicted model is y = −1.5*exp{−exp[−(x+4.0)/−5.5]} (R 2 = 0.96), where y = rhizoma perennial peanut and broadleaf weed biomass ratio and x = triclopyr rate (kg ae ha−1).

The results from this research illustrate differences in RPP response to glyphosate or triclopyr application between two study locations. The predicted I20 rate for glyphosate was 0.78 kg ae ha−1 at the Zolfo Springs location, whereas 1.6 kg ae ha−1 was estimated for the Ona location. This result corresponded with RPP biomass and illustrates that glyphosate needed for a 20% biomass reduction was 0.53 and 2.17 kg ae ha−1 at the Zolfo springs and Ona locations, respectively. The results further suggested that the I20 rate for glyphosate was higher than the rate for 20% biomass reduction at Zolfo Springs; however, this result was contrary for the Ona site. The reason for the differences between the two sites could be attributed to the difference in the age of RPP stand at Zolfo Springs versus that at Ona. Furthermore, the site at Zolfo Springs was disturbed 18 mo prior to study initiation, and this could have resulted on the differential response of glyphosate on RPP compared to that at the Ona location. The results also illustrate that despite injury, glyphosate applied at less than 1.12 kg ae ha−1 is unlikely to reduce RPP biomass. This result agrees with the findings from previous research reporting that RPP recovery from injury and dry matter was unaffected with glyphosate applied at 1.12 kg ae ha−1 (Valencia et al. Reference Valencia, Williams and Sollenberger1999).
Similar to experiments when glyphosate was used, there were differences in RPP response to triclopyr between the two locations. The estimated triclopyr I20 value (0.39 kg ae ha−1) was similar to the predicted rate for 20% biomass reduction (0.45 kg ae ha−1) at the Zolfo Springs location. However, the I20 value (0.95 kg ae ha−1) estimate and triclopyr rate (0.99 kg ae ha−1) predicted to result 20% biomass reduction at the Ona location were higher than those at Zolfo Springs. Valencia et al. (Reference Valencia, Williams and Sollenberger1999) also reported that there was no difference on RPP dry matter without or with triclopyr at <1.12 kg ae ha−1 at 2 mo after application.
Overall, the results from this research illustrate that that RPP is relatively tolerant to glyphosate and triclopyr, and that sward age could have a potential influence on RPP tolerance to these herbicides. Furthermore, some level of injury should be expected from these herbicides and increased injury should be expected as higher application rates are used for optimum weed control in RPP swards. Future research should evaluate the effects of glyphosate or triclopyr applied sequentially or mixed with other labeled herbicides, and on various ages of RPP sward.
Acknowledgments
We thank Mr. Glen Emerson for use of his farm for a portion of this research. This project is a contribution of the Florida Agriculture Experiment Station and is based upon work that is supported by the U.S. Department of Agriculture–National Institute of Food and Agriculture, Hatch project under accession number 0231798, project number FL-ONA-005203. No conflict of interest has been declared.