Implications
This study shows the effect of amino acids on nitrogen excretion and deposition and on their efficiency of utilisation for protein deposition by broilers. The nitrogen originating from the poultry is an environmental pollutant. Provision of higher amounts of amino acids, besides not increasing protein deposition, also causes increased nitrogen excretion. Meeting animal’s amino acids requirements, provides greater efficiency of utilisation of these amino acids, without affecting protein deposition in the animals, and thus reduces nitrogen excretion. In this way, the management of amino acids in broilers diets may allow new efforts to reduce the impact of intensification of livestock.
Introduction
The intensification of livestock have significantly increased the emission of pollutants to the environment, leading to a growing interest in seeking alternatives that minimise these emissions. The European Union has already implemented laws regulating environmental pollution, especially in regard to the emission of nitrogen (N) compounds, considered to be a critical pollutants affecting life on earth (European Commission, Reference Edwards, Baker, Fernandez and Parsons2007). N compounds are responsible for pollution of groundwater due to nitrate leaching, eutrophication of surface water and soil acidification.
In a study covering a large area in Europe, Oenema et al. (Reference Oenema, Oudendag and Velthof2007) found that ~52% of the N excreted in animal housing systems is used as a plant nutrient, whereas 48% is lost to the environment. In this scenario, the N lost to the environment represents almost half of the total N amount excreted. Thus, the development of strategies aiming at decreasing the amount of lost N is greatly needed. One such strategy is to reduce the amount of N excreted by livestock (Méda et al., Reference Méda, Hassouna, Aubert, Robin and Dourmad2011), by increasing the N utilisation efficiency.
Body protein deposition (PD) depends on the animal’s maximum genetic potential. For instance, in broilers, too much protein or amino acid imbalance in the diet does not promote extra growth but rather may overload the bloodstream with amino acids to be metabolised, requiring extra energy that is diverted from production to N excretion processes in the synthesis of uric acid (Macleod, Reference Macleod1997). Therefore, N utilisation efficiency can be improved by reducing the dietary CP content and by supplying the correct amount of essential amino acids. Studies have shown that it is possible to manipulate diets by reducing CP levels and establishing an amino acid profile that meets broilers’ requirements without compromising performance. The effect of this manipulation on reducing N excretion has also been shown (Cauwenberghe and Burnham, Reference Cauwenberghe and Burnham2001; Si et al., Reference Si, Fritts, Waldroup and Burnham2004; Faria Filho et al., Reference Faria Filho, Rosa, Vieira, Macari and Furlan2005; Gomide et al., Reference Gomide, Rodrigues, Bertechini, Freitas, Fassani, Reis, Rodrigues and Almeida2011).
Knowledge of how broilers respond to intake of each amino acid and how each one relates to efficiency of utilisation and PD can be used to develop novel strategies to mitigate this source of pollution. However, we have no knowledge of any study that has focused on reducing N excretion and has related this reduction to individual amino acid. Because of it, this study was conducted to investigate the effect of dietary methionine+cysteine (MC) and threonine (THR), the two most limiting amino acids for broiler production, on nitrogen excretion (NE) and nitrogen deposition (ND) and determined the efficiency of utilisation of both amino acids for PD. The findings of this study were obtained from different broiler rearing phases, of both sexes, and therefore can be widely applied, contributing to lowering the levels of N in the environment.
Material and methods
Birds, housing and housing management
Six trials were conducted at the Poultry Science Laboratory of Faculdade de Ciências Agrárias e Veterinárias, UNESP, Jaboticabal Campus in São Paulo, Brazil, designed to measure the response of broiler chickens during three rearing phases (1 to 14, 15 to 28 and 29 to 42 days) to dietary amino acids. A total of 560 male and female broilers (totalling 1120 broilers/trial and 3360 broilers/amino acid studied) were distributed in a completely random design in each trial, according to a 7×2 factorial (seven levels of dietary amino acids and two sexes) totalling 14 treatments, with four replicates. Each experimental unit comprised 20 birds (6.7 birds/m2). Cobb 500 broilers were used in all the trials. Birds were housed in a tunnel type shed provided with 3 m2 (1×3 m) floor pens. Pens were provided with nipple drinkers and tubular feeders. At the beginning of each trial, birds were individually weighed and distributed such that each experimental unit had homogeneous weight. Feed (mash form) and water were offered ad libitum. Light programme was set at 24 h light/day. Temperature was controlled according to the strain guide.
Experimental diets
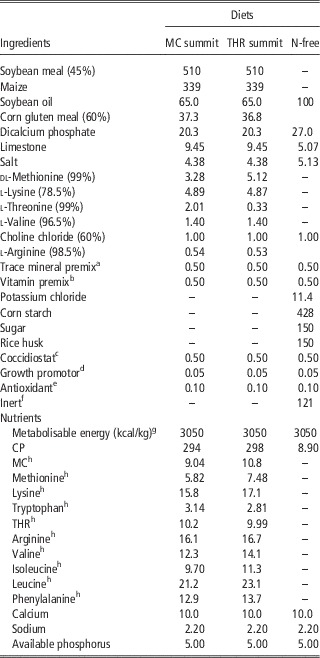
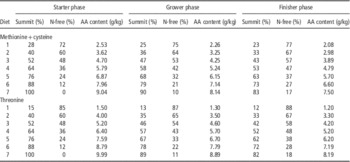
The experimental diets were formulated using the dilution technique. A high-protein summit diet was formulated to contain ~1.2 times the digestible MC and THR levels suggested by Rostagno et al. (Reference Rostagno, Albino, Donzele, Gomes, Oliveira, Lopes, Ferreira and Barreto2005) for broilers during the respective phases, and all other essential amino acids were set at a minimum of 1.4 times their suggested levels. These summit diets were diluted sequentially with isoenergetic, protein-free diets (N free) (Fisher and Morris, Reference Fisher and Morris1970) (Table 1), to create a range of seven feeds increasing in content of the studied amino acids as shown in Table 2.
Composition (g/kg) and analysed nutrient content (g/kg) of the summit and Nfree diets

MC=methionine+cysteine; THR=threonine; N=nitrogen.
a Content/kg of product: Mn=150 000 mg, Fe=100 000 mg, Zn=100 000 mg, Cu=16 000 mg, I=1500 mg.
b Content/kg of product: folic acid=1000 mg, pantothenic acid=15 000 mg, niacin=40 000 mg, biotin=60 mg, vitamin B1=1800 mg, vitamin B12=12 000 mg, vitamin B2=6000 mg, vitamin B6=2800 mg, vitamin D3=2 000 000 UI, vitamin E=15 000 mg, vitamin K3=1800 mg, Se=300 mg, antioxidant=500 mg.
c Coxistac.
d Zinc bacitracin.
e Butylated hydroxytoluene.
f Wash sand.
g Predicted value.
h Digestible amino acid composition.
Dilution scheme of summit and nitrogen (N)-free diets and amino acid (AA) content in all methionine+cysteine and threonine experimental diets in starter (1 to 14 days), grower (14 to 28 days) and finisher (28 to 42 days) phases

To verify whether the responses were due to limitation of the selected amino acid in the dilution series, a pilot trial for each amino acid was conducted with 30 male Cobb broilers from 1 to 14 days for MC and from 7 to 21 days for THR. They were distributed in a completely random design between two treatments in each trial, one with the lowest studied levels for each amino acid and the other the control treatment. This treatment had the same nutritional composition as the lowest treatment in the dilution series, but it was supplemented with the test amino acid to reach the same level as the second treatment. Body weight gain (BWG) and feed conversion ratio (FCR) were evaluated.
Measures and chemical analysis
Nitrogen intake (NI, g/bird per day) was calculated from the feed intake (FI) and the nitrogen content of the diet (Ndiet) (NI=FI×Ndiet/100). ND (g/bird per day) was determined using the comparative slaughter technique, where six birds of each sex at the beginning of each phase and two birds of each experimental unit (totalling 112 birds, with 56 of each sex) at the end of each phase were fasted for 24 h, slaughtered, and feather-free body and feathers were analysed by Kjeldahl method, from which the amount of N deposited during each phase was calculated. NE (g/bird per day) was calculated as the difference between the NI and the ND (NE=NI–ND). The ND/NI and NE/ND ratios were also evaluated.
Statistical analyses
All statistical analyses were performed in SAS 9.1 software (SAS Institute, 2009) using PROC NLIN. A statistical ANOVA and t test (5% significance level) was conducted on performance variables to test the limiting amino acids. A statistical ANOVA on each of the variables measured, and a Tukey test with 5% significance level was conducted to test the means of the ND/NI and NE/ND ratios. In order to estimate the rate of NE an exponential regression model (equation (1)) (Samadi and Liebert, Reference Samadi and Liebert2006 and Reference Samadi and Liebert2007) was fitted to NE data in function of amino acid intake for each studied phase and sex:
 $$Y{\equals}a{\times}{\rm exp(}b{\times}X{\rm )}$$
where Y is the NE (g/bird per day), a the intercept, b the rate of excretion and X the amino acid intake (mg/bird per day). This model has a biological interpretation for NE, since NE increases with amino acid intake, and increases exponentially after ND reaches the plateau. When amino acid intake is null the a coefficient represents the NE, in this case the endogenous losses of N.
To determine the maximum rate of PD in each phase and for each sex a linear response plateau model was fitted (equation (2)):
 $$\eqalignno{ & Y{\equals}L{\plus}u{\times}(R{\minus}X)\,if\,X\,\lt\,R \cr & Y{\equals}L\,if\,{\rm }X\geq R $$
where Y is the protein deposition (g/bird per day), L the maximum protein deposition (g/bird per day, which is referred to as PDmax in the text), u the slope, which is the coefficient of response to amino acid intake and the inverse of the efficiency of utilisation of amino acids for PD, R the break point and X the amino acid intake (mg/bird per day).
To test the null hypothesis (the coefficients are similar for both sexes and all phases) and the alternative hypothesis (the coefficients are different at least for one sex and/or phase), the a and b coefficients estimated by equation (1) and u coefficients estimated by equation (2) for each phase and sex were compared using a likelihood ratio test for non-linear models as described by Regazzi (Reference Regazzi2003).
Results
Limiting amino acid
When working with a dilution technique it is important to confirm that the amino acid being studied is limiting. Two diets for each amino acid were tested and the results for BWG and FCR were compared. The addition of industrial MC and THR to the feed containing the lowest contents of these amino acids significantly (P<0.01 in all cases) improved both BWG (7.79 v. 5.18 g/bird per day for MC and 30.05 v. 27.55 g/bird per day for THR) and FCR (2.65 v. 2.98 g/g for MC and 2.28 v. 2.45 g/g for THR). Pilot trial results confirmed that MC and THR were the limiting amino acids in the respective dilution series, which validates our findings.
Responses to NI: estimates of NE and ND
The contribution of MC and THR to environmental N emission was studied in three rearing phases in both sexes through the responses of excreting N and N deposition. To detect differences in responses, a two-way ANOVA was performed.
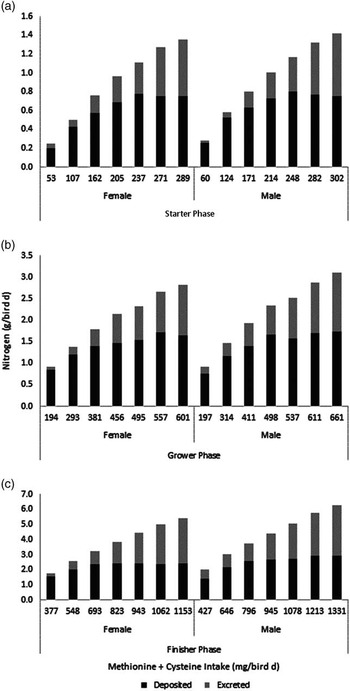
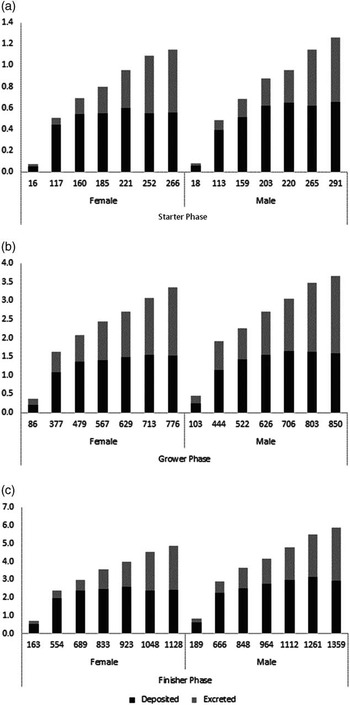
The mean ND, NE and NI (which is the sum of deposition and excretion) by broilers subjected to increasing dietary levels of MC are presented in Figure 1. No interaction between amino acid levels and sex were observed for any of the variables in the starter phase (Figure 1a), whereas in the grower phase (Figure 1b) interaction was observed for all of them. In the finisher phase (Figure 1c) it was observed only for NE. Note that in all phases and for both sexes NI, ND and NE increased according to amino acid increments changed in the diet. In addition, ND increased until it reached a plateau whereas NE showed an exponential increase (Table 3). Using the methodology described by Regazzi (Reference Regazzi2003), it was observed that despite the differences between sexes in NE for MC in the grower phase, both parameters of exponential fitted equations were the same.
Average nitrogen deposition, excretion and intake (sum of deposition and excretion) (g/bird per day) in female and male broilers in three rearing phases as a function of average methionine+cysteine intake (mg/bird per day). (a) Starter phase; (b) grower phase; (c) finisher phase.

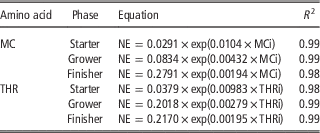
Fitted equations to describe nitrogen excretion (NE; g/bird per day) responses to methionine+cysteine (MCi; mg/bird per day) and threonine (THRi; mg/bird per day) intake by broilers in starter (1 to 14 days), grower (14 to 28 days) and finisher (28 to 42 days) phases

Supplementary Table S1 presents the ratios of ND and NI and of NE and ND in the MC trial. An interaction between sex and treatment in the grower phase was observed for ND/NI but not for NE/ND. In the finisher phase, the interaction was significant for both ratios (ND/NI and NE/ND). As expected, the ND/NI ratio decreased as the level of MC in the diet increased. Also expected was the observation that the ratio NE/ND in the MC trial increased according to amino acid increments in the diet.
In the THR trial, an interaction between sex and treatment in the starter phase (Figure 2a) was observed only for NI and ND but not for NE. In the grower phase (Figure 2b), an interaction between these parameters was observed for NI only whereas in the finisher phase (Figure 2c) the interaction was not significant for NE, nor for ND/NI or NE/ND (Supplementary Table S2).
Average nitrogen deposition, excretion and intake (sum of deposition and excretion) (g/bird per day) in female and male broilers in three rearing phases as a function of average threonine intake (mg/bird per day). (a) Starter phase; (b) grower phase; (c) finisher phase.

Likewise in the MC trial, NI, ND and NE increased with dietary increases of THR (Figure 2) in all phases and in both sexes. In the THR trial, ND reached a plateau similar to that observed in the MC trial. In the same way, the NE exponential behaviour was similar to that observed in the MC trial (Table 3). As observed in Figures 1 and 2, NE can exceed 50% of NI, and thus 100% of ND.
The ratio ND/NI for THR (Supplementary Table S2) showed the same behaviour as that observed in the MC trial, in which the ND/NI decreased as the level of THR in the diet increased. The ND/NI ratio was higher in the MC than in the THR trial, especially at lower levels of the amino acid. The ratio NE/ND in the THR trial increased as the level of THR in the diet increased, similar to that of the MC trial. However, the NE/ND ratio was higher in the THR trial. For the lower amino acid levels this difference between trials was expected because the first level of the THR trial was lower than that of the MC trial.
According to the fitted equations (Table 3), the rate of NE decreases with broiler’s age, while endogenous losses (a coefficient) increase. When expressed as kilogram of BW, considering the average weight at each phase (0.164, 0.843 and 2.017 kg for starter, grower and finisher phases, respectively), the endogenous losses were 0.177, 0.099 and 0.138 for MC and 0.231, 0.239 and 0.108 for THR, for starter, grower and finisher phases, respectively.
Amino acid contribution to PD and NE
Knowing the contribution of each amino acid to PD and NE in each sex and in each rearing phase is crucial to better understand how amino acids in the diet can be manipulated. To determine the contribution of each amino acid, the body PD and NE were plotted against the amino acid intake.
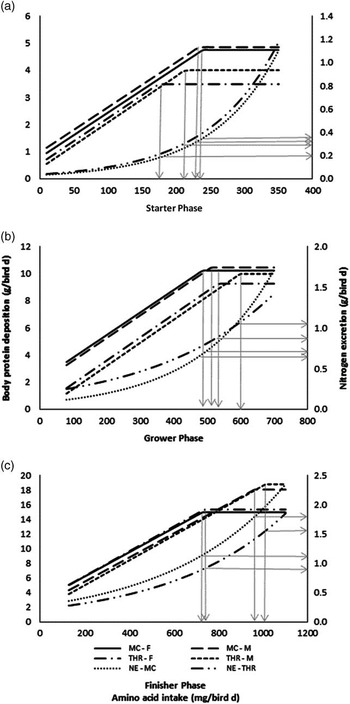
In the starter and grower phases (Figure 3a and b, respectively) differences in PDmax between males and females were observed in the THR trial but not in the MC trial. In the finisher phase, significant differences in the PDmax were observed in both trials (Figure 3c). In all cases, differences in PDmax resulted in differences in NE. In the grower phase (Figure 3b) although the PDmax was higher in the MC trial, the NE was lower than that observed in the THR trial. In the finisher phase (Figure 3c) in the THR trial, the opposite situation was observed, where PDmax was higher and NE was lower.
Body protein deposition (g/bird per day) and nitrogen excretion (NE; g/bird per day; data from both sexes were combined) by broiler males (M) and females (F) in function of methionine+cysteine (MC) or threonine (THR) intake (mg/bird per day) in three rearing phases. (a) Starter phase; (b) grower phase; (c) finisher phase.

Table 4 shows the NE amounts estimated by the equations presented in Table 3, considering the amino acid intake for PDmax in both trials (i.e., when amino acid intake reaches the break point R). Note that for PDmax, the relation between deposition (converted into N) and NE was the same between trials (2.1), regardless of sex.
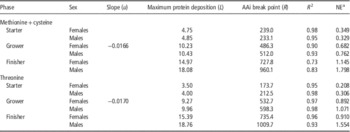
Slope (u), maximum protein deposition (L, g/bird per day) and amino acid intake (AAi, mg/bird per day) break point (R) estimated values determined by fitting linear response plateau model to body protein deposition (PD) PD=L+u(R−MCi) and nitrogen excretion (NE, g/bird per day) for female and male broilers in starter (1 to 14 days), grower (14 to 28 days) and finisher (28 to 42 days) phases

a Determined using R values in the NE equations (Table 3).
Efficiency of amino acid utilisation for PD
The determination of the efficiency of amino acid utilisation for PDmax allows the manipulation of dietary amino acids in order to minimise NE. Thus, a broken line regression between PD and amino acid intake was applied to determine this parameter. Although there is no interaction between sex and the level of MC or THR for ND in some of the phases here studied, the linear response plateau model was fitted separately (Table 4), allowing determination of the PDmax and evaluation of the efficiency of amino acid utilisation for PD in each sex. The slopes (u coefficients) in each sex and phase in each trial were compared through the likelihood ratio test and showed no significant difference. Note that the efficiency of PD is the slope (u) of the broken line model, and is determined considering the added dietary amino acid levels before reaching the PDmax. The fitted linear response plateau model for each amino acid is illustrated in Supplementary Figures S1 and S2. The efficiency of MC utilisation for PD was 1/0.0166=0.60, and for THR was 1/0.0170=0.59. The plateaus (PDmax) estimated for MC and THR in all phases are similar (Supplementary Figures S1 and S2).
Discussion
This study investigated the effect of different levels of amino acid intake on NE and ND in broilers and determined the amino acid utilisation efficiency for body PD. The findings presented in this study show that manipulation of dietary MC and THR decreases N excretion (and thus potential N gaseous emissions to the environment), without affecting performance.
According to Sklan and Noy (Reference Sklan and Noy2004), the carcass accretion is related to the most limiting amino acid in the diet and increases up to the maximal rate, when another amino acid may then become limiting. The pilot trial presented in this study showed that the two amino acids were indeed limiting. In this study, the dilution technique was used to formulate the experimental diets because with this technique the balance of amino acids remains the same, which cannot be assured when the graded supplementation technique is used (Gous and Morris, Reference Gous and Morris1985).
The efficiency of amino acid utilisation is better when all amino acids are at or slightly below their requirement for protein accretion and maintenance rather than above their requirement (Corzo et al., Reference Corzo, Fritts, Kidd and Kerr2005). This finding provides support for using the slope of linear response plateau model to determine the efficiency of utilisation of amino acids for PD. This study shows that after the PDmax is reached, less amino acid is catabolised, and the rate of NE increases, leading to the excretion of excessive N (Figures 1, 2 and 3), thus decreasing the efficiency of amino acid utilisation. Data on ND/NI ratio shown in Supplementary Tables S1 and S2 also provide information about the efficiency of N utilisation to N deposition, and confirm the decrease of N efficiency as the NI increases. Both tables show that an excess of NE occurs in relation to ND (NE/ND) when amino acid levels increase, which indicates the inefficiency of N deposition. The NE/ND ratio can reach >1 when excretion is higher than deposition.
The amino acid utilisation efficiency for PD was expected to be different between MC and THR, as essential amino acids have different degradation rates (Edwards et al., 1997); and between sex and phases, as the nutrient requirements are higher during starter growth phases, which is associated with muscle mass and/or ND (Namazu et al., Reference Namazu, Kobashigawa, Albuquerque, Schammass, Takeara and Trindade Neto2008). However, in the current study only one efficiency was determined for all three phases and both sexes, for both MC (0.60) and THR (0.59) (Supplementary Figures S1 and S2), and were very similar between the two amino acids.
Using the first derivative of the fitted equations to predict NE (Table 3), it is possible to observe that the rate of NE for MC and THR intake decreased 92% (starter phase), 87% (grower phase) and 80% (finisher phase), which is the maximum rate (at maximum amino acid intake observed) minus the minimum rate (at minimum amino acid intake observed). These values indicate that the late stage of rearing is the most important phase in regard to NE, as at this phase the FCR is higher as well as the FI. Therefore, if amino acid intake is not optimal, NE increases.
Knowing endogenous N losses and the variables that affect them may help improve the efficiency of protein and amino acid utilisation, which may lead to reductions in NE. Adedokun et al. (Reference Adedokun, Parsons, Lilburn, Adeola and Applegate2007) observed a decrease in endogenous amino acids losses in chicks with increasing age (from 5 to 21 days). According to the authors this could be attributed to a decreased rate of mucin secretion with age, and increased rate of digestion and absorption of endogenous proteins. On the other hand, Sibbald (Reference Sibbald1981) observed an increase in endogenous losses of N in roosters with increasing age, similarly to what was observed in the present study (a coefficient, Table 3). According to Sibbald (Reference Sibbald1981), this fact is expected because older birds are heavier and their greater fat reserves are used as a source of energy to maintain life during fasting, and thus they catabolise less N compounds. Considering the age period studied by Adedokun et al. (Reference Adedokun, Parsons, Lilburn, Adeola and Applegate2007), those birds were too young and have no fat reserves to be used as energy source, catabolising more N compounds. In addition, the different methodologies used could have affected the results.
In this study, a comparative slaughter technique was used to determine the ND, whereas the NE was determined by subtracting ND from NI. The slaughtering technique is better than excreta collection because in the latter N may be volatilised before analysis. Furthermore, in the slaughtering technique there is no risk of contamination of excreta with others sources of N, such as feed and feathers.
Using the data estimated in this trial for PDmax for both amino acids (Table 4) and substituting these data in the NE equations for the variables of interest (Table 3), an average of 33% was established for NE arising from feed. This value is lower than that reported by Coufal et al. (Reference Coufal, Chavez, Niemeyer and Carey2006), which was 43.6%, and by Applegate et al. (Reference Applegate, Potturi and Angel2003), which was 39.8%. According to Coufal et al. (Reference Coufal, Chavez, Niemeyer and Carey2006), differences in feed N content, feed consumption rates, bird size at marketing and carcass N values used in the calculations could explain the different values found in different studies. In addition, the method used to estimate NE and the amino acid profile might affect the final result. Using diets with normal CP level, De Boer et al. (Reference De Boer, Van Der Togt, Grossman and Kwakkel2000) reported 55% of NE arising from feed, which shows a lower efficiency of nutrient utilisation, besides the environmental impact it represents.
Several studies (Cauwenberghe and Burnham, Reference Cauwenberghe and Burnham2001; Si et al., Reference Si, Fritts, Waldroup and Burnham2004; Faria Filho et al., Reference Faria Filho, Rosa, Vieira, Macari and Furlan2005) evaluated the NE as a function of dietary CP and found that for each decrease of 1% in dietary CP there is a decrease between 7% (Faria Filho et al., Reference Faria Filho, Rosa, Vieira, Macari and Furlan2005) and 10% of NE (Cauwenberghe and Burnham, Reference Cauwenberghe and Burnham2001; Si et al., Reference Si, Fritts, Waldroup and Burnham2004). Concerning amino acid reduction, the present study shows an exponential decrease in NE, which is age dependent (Figure 3 and Table 3). On average, for a reduction in intake of each unit of MC or THR (mg) there is a reduction of 0.5% in NE. Although this reduction seems low, considering that it corresponds to changes in a single amino acid, the impact on a large scale would be significant. For example, in a facility with 30 000 broilers reared in a production cycle of 42 days, feeding only 10 mg/bird per day of MC over the requirement for PDmax would increase the NE by about 44.0 kg throughout the period. Considering the total Brazilian annual production of six billion broilers (Avisite, 2014), the positive impact on the environment resulting from feeding these birds the requirement for MC would be huge. Knowing how animals respond to NE and ND/PD according to amino acid dietary content may allow new efforts towards the reduction of the impact of intensification and conglomeration of livestock.
Acknowledgements
The authors thank Fundação de Amparo à Pesquisa do Estado de São Paulo (FAPESP) for financial support for this project and scholarship. A part of this study was carried out within the framework of the CAPES-COFECUB project Sv687/10 funded by the Comité Français d’Evaluation de la Cooperation Universitaire et Scientifique avec le Brésil (COFECUB, France) and the Coordenação de Aperfeiçoamento de Pessoal de Nível Superior (CAPES, Brazil).
Supplementary material
For supplementary material/s referred to in this article, please visit http://dx.doi.org/10.1017/S175173111500289X