1. INTRODUCTION
Astrophysical collimated outflows — energetic giant jets — are one of the most exciting phenomena in space. Astronomical observations provide images of well-collimated jets ejected from active galactic nuclei (Bridle & Perley, Reference Bridle and Perley1984) and from young stellar objects (Zinnecker et al., Reference Zinnecker, McCaughrean and Rayner1998). Protostellar jets associated with Herbig-Haro objects observed from space and ground telescopes are intensively studied (Heathcote et al., Reference Heathcote, Morse, Hartigan, Reipurth, Schwartz, Bally and Stone1996). The tight collimation of jets propagating at a high Mach number M > 10 over distance exceeding tens of jet diameters, their structure and their interactions with an ambient medium remains still an open question (Reipurth & Bally, Reference Reipurth and Bally2001).
Recently, high power lasers have been applied to simulate physics of astrophysical objects and processes in laboratory (Remington et al., Reference Remington, Drake and Ryutov2006). For this purpose, sharp and dense plasma jets are usually produced from special targets using sufficiently high laser energy of kJ order (Rosen et al., Reference Rosen, Wilde, Williams, Foster, Keiter, Coker, Perry, Taylor, Khokhlov, Drake, Bennett, Sinars and Campbell2005). Collimated jets were also generated from cone targets by several high-energy laser beams at Nova (Farley et al., Reference Farley, Estabrook, Glendinning, Glenzer, Remington, Shigemori, Stone, Wallace, Zimmerman and Harte1999) and Gekko-XII (Shigemori et al., Reference Shigemori, Kodama, Farley, Koase, Estabrook, Remington, Ryutov, Ochi, Azechi, Stone and Turner2000) lasers.
Simple and reliable method of the jet generation with tunable and reproducible parameters is thus very important for extending laboratory astrophysics. In addition to astrophysics, high-velocity dense jets are of practical interest for fusion, in particular, to a new fast ignition concept (Velarde et al., Reference Velarde, Ogando, Eliezer, Martinez-Val, Perlado and Murakami2005), since it seems realistic to reach jet parameters suitable for ignition of the pre-compressed fuel.
Wider application of laser produced jets is hindered by the necessity of using special targets and laser energy of kJ order. However, an amazingly simple jet production from planar targets using a shaped interaction beam pattern was reported at relatively low laser energies (Gribkov et al., Reference Gribkov, Krokhin, Nikulin, Semenov and Sklizkov1975; Gabl et al., Reference Gabl, Failor, Armentrout, Delamater, Fechner, Bosch, Busch, Koenig, Ress, Suter and Schroeder1989; Stehle et al., Reference Stehle, Ciardi, Colombier, Gonzalez, Lanz, Marocchino, Kozlova and Rus2009) backed up by simulation (Sizyuk et al., Reference Sizyuk, Hassanein and Sizyuk2007; Stehle et al., Reference Stehle, Ciardi, Colombier, Gonzalez, Lanz, Marocchino, Kozlova and Rus2009).
Recently, well-collimated jets have been produced from massive planar targets at NHELIX (Schaumann et al., Reference Schaumann, Schollmeier, Rodriguez-Prieto, Blazevic, Brambrink, Geissel, Korostiy, Pirzadeh, Roth, Rosmej, Faenov, Pikuz, Tsigutkin, Maron, Tahir and Hoffmann2005) and PALS (Nicolai et al., Reference Nicolai, Tikhonchuk, Kasperczuk, Pisarczyk, Borodziuk, Rohlena and Ullschmied2006) lasers. While 15-ns-long laser pulses and uncorrected spherical focusing lens with relatively low laser intensities on the order of 1011 W/cm2 were used in NHELIX experiment, PALS operated with 300 ps pulses and delivered interaction intensity in range 1013–1014 W/cm2 by an aberration corrected aspherical lens. Both lasers used a central obscuration of the beam to avoid damage of focusing optics.
PALS-produced high-velocity jets, well-decoupled from the laser target, were characterized by a three-frame laser interferometric system (Kasperczuk et al., Reference Kasperczuk, Pisarczyk, Borodziuk, Ullschmied, Krousky, Masek, Rohlena, Skala and Hora2006). The jet length exceeded by many times its diameter that was only a fraction of the laser spot. A sequence of frames synchronized to the laser shot enabled to obtain density profiles of expanding plasma at selected times after the interaction up to 20 ns. Unfortunately, information about the early plasma dynamics was limited due to the high opacity of dense plasma to the probe. Recently, a table top capillary X-ray laser was applied to an investigation of jet dynamics when produced from grooved targets (Grava et al., Reference Grava, Purvis, Filevich, Marconi, Rocca, Dunn, Moon and Shlyaptsev2008).
Simplicity and reliability of the PALS single-beam jet generation enabled experiments ranking from laboratory astrophysics (Nicolai et al., Reference Nicolai, Stenz, Tikhonchuk, Ribeyre, Kasperczuk, Pisarczyk, Juha, Krousky, Masek, Pfeifer, Rohlena, Skala, Ullschmied, Kalal, Klir, Kravarik, Kubes and Pisarczyk2009) to fusion related research (Badziak et al., Reference Badziak, Pisarczyk, Chodukowski, Kasperczuk, Parys, Rosinski, Wolowski, Krousky, Krasa, Masek, Pfeifer, Skala, Ullschmied, Velyhan, Dhareshwar, Gupta, Rhee, Torrisi and Pisarczyk2009). Due to unusual features of the observed jets, the influence of different phenomena such as magnetic field (Nicolai et al., Reference Nicolai, Tikhonchuk, Kasperczuk, Pisarczyk, Borodziuk, Rohlena and Ullschmied2006), radiative cooling (Nicolai et al., Reference Nicolai, Tikhonchuk, Kasperczuk, Pisarczyk, Borodziuk, Rohlena and Ullschmied2006), nonlinear laser-plasma interaction (Kasperczuk et al., Reference Kasperczuk, Pisarczyk, Borodziuk, Ullschmied, Krousky, Masek, Rohlena, Skala and Hora2006), and the laser beam profile (Kasperczuk et al., Reference Kasperczuk, Pisarczyk, Demchenko, Gus'kov, Kalal, Ullschmied, Krousky, Masek, Pfeifer, Rohlena, Skala and Pisarczyk2009) have been considered as the primary cause of the jet formation. Recent paper (Kasperczuk et al. (Reference Kasperczuk, Pisarczyk, Badziak, Borodziuk, Chodukowski, Parys, Ullschmied, Krousky, Masek, Pfeifer, Rohlena, Skala and Pisarczyk2010) suggests that the stable jet formation is due to the synergic effect of the laser beam profile and of radiative cooling. Numerical simulations predicted elongated plasma plumes, but with a diameter comparable to the interaction beam size (Nicolai et al., Reference Nicolai, Tikhonchuk, Kasperczuk, Pisarczyk, Borodziuk, Rohlena and Ullschmied2006, Reference Nicolai, Stenz, Tikhonchuk, Ribeyre, Kasperczuk, Pisarczyk, Juha, Krousky, Masek, Pfeifer, Rohlena, Skala, Ullschmied, Kalal, Klir, Kravarik, Kubes and Pisarczyk2009), and the origin of the narrow jets remained elusive. Up to date, the much desired details on the jet homogeneity, structure, and stability could not be obtained because of the limitations of the employed diagnostic methods, and also due to the assumption of an axisymmetric plasma profile (Kasperczuk et al., Reference Kasperczuk, Pisarczyk, Borodziuk, Ullschmied, Krousky, Masek, Rohlena, Skala and Hora2006) used in the deconvolution process for the data processing from the diagnostics.
In this paper, we investigate in detail the dynamics of laser plasmas produced from massive planar targets at intensities of the order of 1013 W/cm2 by hydrodynamic simulations. Our fluid code PALE is briefly described in Section 2 together with the general simulation parameters. When a laser beam with an intensity minimum in the center (annular beam) is incident on a massive planar target, the corona formation and the plasma outflow differ qualitatively from the interaction of a Gaussian laser beam. This difference is depicted and discussed in Section 3. In Section 4, the collimated jet formation is studied for various profiles of annular laser beams and various target materials. The features of laser beam profiles and target materials preferential for the collimated jet formation are identified. Our modeling of the laser beam propagation in the amplifier chain and the calculation of the intensity distribution in the PALS laser interaction spot are described in Section 5. Fluid simulations of the interactions of the beam with the calculated intensity profile with targets are presented in Section 6. Our conclusions are summarized in the last section.
2. SIMULATION CODE PALE AND GENERAL SIMULATION PARAMETERS
PALE is our Arbitrary Lagrangian-Eulerian (ALE) simulation code, where the incidence of laser and its interaction with plasma is modeled by Euler equations, i.e., hydrodynamic conservation laws for mass, momentum, and energy of compressible fluid, complemented by terms for laser absorption and heat transfer. In Lagrangian coordinates, they write
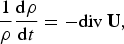
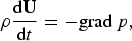

where ρ is density, U is velocity, p is pressure, ɛ is specific internal energy (energy per unit mass), T is temperature, κ is heat conductivity coefficient, I is laser energy flux density (Poynting vector) and d/dt=∂/∂t+u · grad is the total Lagrangian time derivative (which also includes convective terms). Note that instead of conservation law for the total energy we use an equation for the internal energy (1c), whereas the total energy conservation is achieved by the construction of the numerical scheme. As a thermodynamic closure of the system (1), we use the equation of state (EOS), which couples density, internal energy, pressure and temperature. In the simulations presented below, we used either EOS for perfect polytropic gas (with reduced maximum ionization degree) or Quotidian EOS (More et al., Reference More, Warren, Young and Zimmerman1988).
The ALE method is a strategy that combines the advantages of both the Eulerian and Lagrangian approaches to dealing with computational meshes. One of the classical formulations (Hirt et al., Reference Hirt, Amsden and Cook1974) describes it by three basic blocks that are repeated until solution at the desired time is reached: First is the Lagrangian stage, where we advance in time using a classical Lagrangian scheme, with no mass fluxes between cells. Second, when the mesh becomes deformed to the extent that the accuracy of simulation is threatened, we need to adapt (rezone) it, i.e., correct the bad elements while keeping the new mesh as close as possible to the old (deformed) one to preserve the information about the overall flow patterns contained in the mesh deformation. Finally, we need to transfer (remap) the values of the state variables from the old (deformed) mesh to the new (rezoned) one, so that we can continue with Lagrangian phase again.
The PALE code uses staggered discretization (Caramana et al., Reference Caramana, Burton, Shashkov and Whalen1998a), where the kinematic variables (position and velocity) are assigned to the mesh nodes, while the thermodynamic variables (density, pressure, temperature, internal energy, etc.) are defined in the cells. Since staggered schemes must be equipped with some mechanism to dissipate kinetic energy into internal energy on the shock waves, PALE contains several types of artificial viscosity (Caramana et al., Reference Caramana, Shashkov and Whalen1998b; Campbell & Shashkov, Reference Campbell and Shashkov2001). The subcell pressure forces (Caramana & Shashkov, Reference Caramana and Shashkov1998) are used to prevent hourglass-type mesh motion. All simulations presented in this paper have been performed in cylindrical (r-z) geometry employing two-dimensional structured quadrilateral (logically rectangular) meshes.
Heat conductivity is introduced by a parabolic part in the energy equation (1c), which is solved separately by splitting from the otherwise hyperbolic system (1). It is transformed to the heat equation for temperature and described by the system

where a = ρ ∂ɛ/∂T and we introduced the heat flux w. Continuous operators div and grad are discretized by the mimetic method (Shashkov & Steinberg, Reference Shashkov and Steinberg1996), so that their discrete analogs have the same integral properties in the discrete space. Thermal conductivity coefficient κ is approximated by the classical Spitzer-Härm formula (Spitzer & Härm, Reference Spitzer and Härm1953). To avoid unphysical results, computed heat fluxes are limited to a value smaller than physical free streaming flux multiplied by the flux limiter f = 0.1 by modification of κ, using the ratio of the unlimited heat flux and the heat flux limit.
Laser absorption is represented by a source term in the internal energy equation (1c). Currently, we use either the simplest mechanism of absorption at critical surface (i.e., the laser energy is entirely absorbed with given efficiency as soon as it enters the first cell with supercritical density), or ray-tracing.
While PALE contains several advanced rezoning (mesh adaptation) strategies, all results presented in this paper have been calculated using the classical Winslow smoothing formula (Winslow, Reference Winslow1963). However, the relaxation of the mesh motion was introduced already in the Lagrangian part, where the mesh is held static (zero velocity imposed to nodes until the surrounding cells are heated) in the cold regions of the domain.
Remapping of the solution between the meshes is performed by piecewise linear reconstruction of mass, momentum, and energy on the subcells using Barth-Jespersen limiting, followed by integration over the swept regions (differences of old and new mesh associated with mesh edges), and a posteriori redistribution of possibly created local extremes (repair) to preserve local bounds in density, velocity, and energy (Reference Kuchařík, Shashkov and WendroffKuchaříket al., 2003).
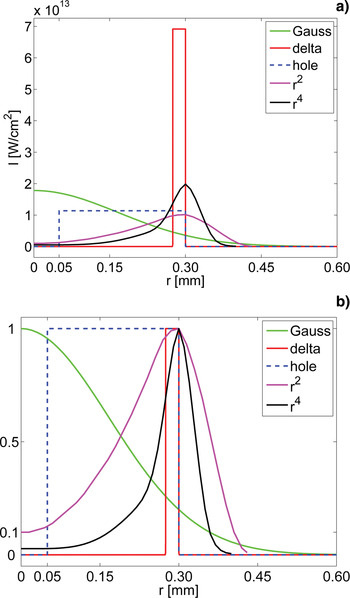
In our simulations, normal incidence of the laser beam on a planar bulk solid target is assumed. The target material is either aluminum or silver. However, radiation losses are not included in our simulations, so the difference is only in hydrodynamic parameters such as different ratio of the mean ion charge Z to the ion mass number A and different material density. The temporal profile of the laser pulse is Gaussian with 300 ps full width at half maximum (FWHM), laser wavelength is 439 nm equal to the third harmonic frequency of the iodine laser. We use the Gaussian spatial intensity profile as a typical representative of ordinary profiles with the intensity maximum in the center, for the Gaussian beam 80% of the energy is inside the radius 300 µm. Plasma expansion from the target is compared with the plasma dynamics obtained for various intensity profiles with an intensity minimum in the beam center and with an intensity maximum at the radius 300 µm that are presented in Figure 1.
(Color online) Laser intensity profiles used in simulations of laser interaction with bulk planar targets. Intensity distribution at the same power for laser energy 10 J (a) and intensity distributions normalized to the same maximum intensity (b).

It is shown that some profiles lead to a sharper and a longer-lived cumulation of the plasma outflow. In Section 6, the laser beam profile calculated for the PALS laser is presumed and the contribution of the beam profile to the cumulative outflow in the PALS experiments is depicted.
3. PLASMA OUTFLOW FOR GAUSSIAN LASER BEAM AND FOR ANNULAR LASER BEAM
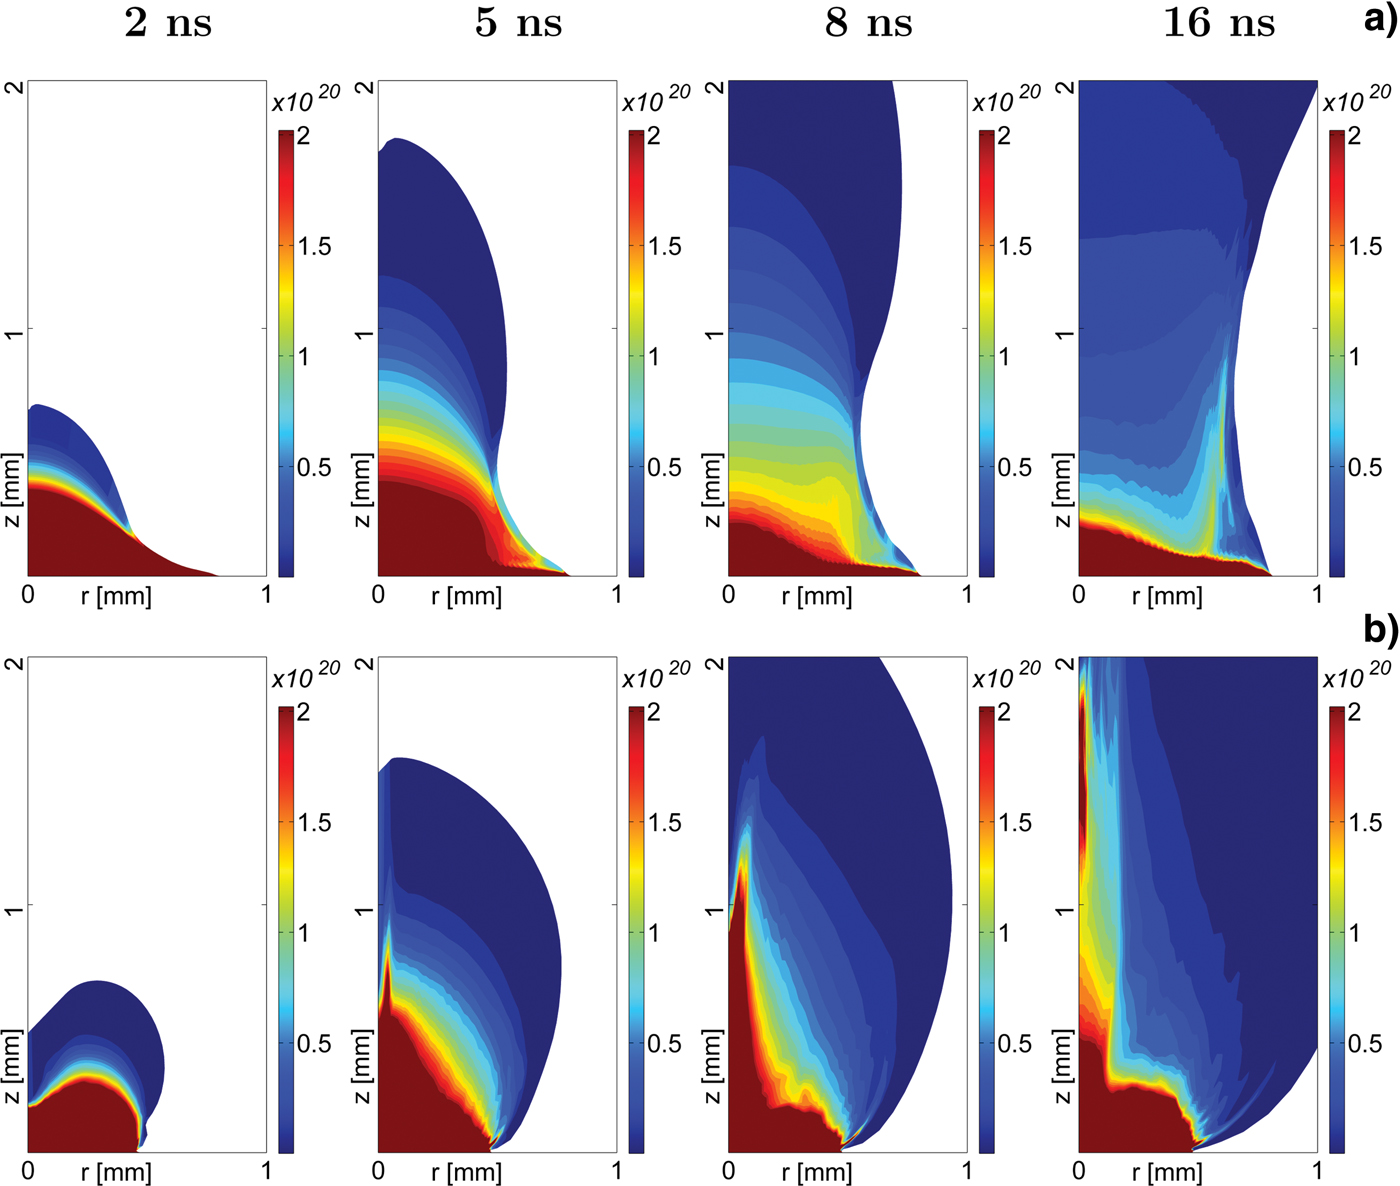
In many experiments, laser beam intensity profiles are close to the Gaussian shape, and Gaussian shape is often presumed in numerical simulations, even when the detailed beam profile is not known. In Figures 2 and 3, plasma outflow for the Gaussian beam is compared at various time instants with that induced by a beam with an intensity minimum in the center. This beam has the same energy as the Gaussian beam and it has the “r 2” profile (Fig. 1) with a parabolic intensity dependence near the beam center. This profile has the intensity maximum at r = 300 μm and reaches 10% of its maximum intensity at the beam center. The electron density, that is measurable via optical interferography, is plotted in Figure 2 for the laser energy 10 J and silver target. The maximum laser intensity is 1.78 × 10¹³W/cm2 for Gaussian beam and 1.02 × 10¹³ W/cm2 for the “r 2” beam. For the same parameters and times, the plasma pressure profiles are plotted in Figure 3.
(Color online) Electron densities for silver target, and Gaussian (a) and “r 2” (b) laser beam intensity profiles. Laser energy 10 J, pulse duration 300 ps and laser wavelength 439 nm.
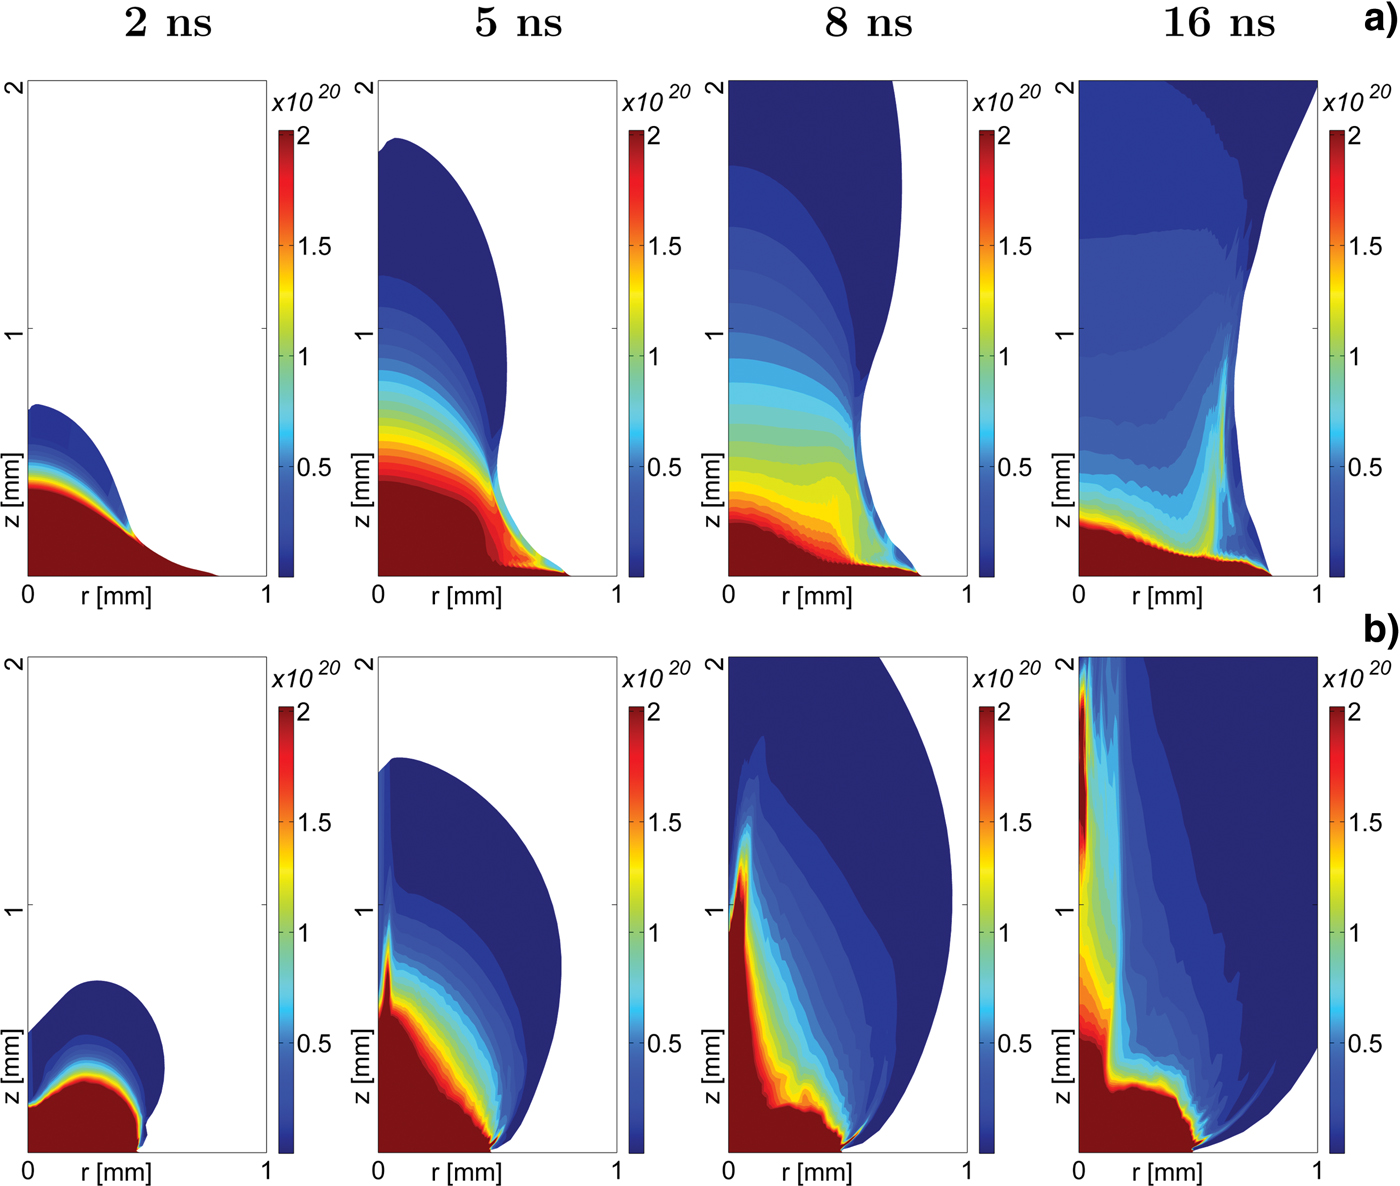
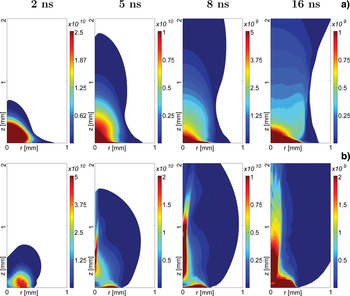
(Color online) Pressure profiles in the same simulations as above. Silver target, and Gaussian (a) and “r 2” (b) profiles of laser beam of energy 10 J.

For the Gaussian beam, the induced plasma outflow is smooth and its radius is approximately equal to the laser beam diameter near the target up to the distance equal to the laser beam diameter. The outflow radius then grows slowly with the distance from the target. The density profile in the transverse (r) direction is smooth with a bell like form. Only after relatively long time of 8 ns small collimated flow starts to form at the edge of the laser spot near to the target original surface. Small short filaments at the edge of the laser spot have been observed in various experiments (Willi et al., Reference Willi, Rumsby and Sartang1981).
For the annular laser beam, a density hole is formed shortly after the laser pulse at the beam axis, as the plasma outflow is faster from the hotter region at the radius of the laser beam intensity maximum. This hot outflowing plasma expands not only outwards, but also inward to the cylindrical axis. The inward velocity is driven by the radial component of a pressure gradient directed toward the axis. The direction of the pressure gradient (see Figure 3b at 2 ns) is a direct consequence of the annular profile of the laser beam. Cone like structure visible in the density in Figure 2b and in the pressure in Figure 3b at 2 ns is formed soon after the laser pulse and it collides on the axis. At later times 5 ns and 8 ns displayed in Figure 2b and Figure 3b, the cone structure still exists, however, it is significantly narrower than at 2 ns and its tip is moving up along the z beam axis (being in the neighborhood of z = 0.1 mm at 2 ns, near to z = 0.6 mm at 5 ns and at z = 1 mm at 8 ns). The pressure maximum is at the edge of the jet and thus pressure gradient prevents the plasma at the cylindrical axis from radial expansion. The radial velocity component is negative just outside the pressure step and is approximately zero inside the jet. No apparent shear is observed at the pressure step and the jet diameter grows slowly with time. Thus, cylindrical cumulation is formed in the plasma outflow. The density is increased on the axis and a long narrow collimated jet is formed near the axis. The jet diameter is significantly less than that of the laser beam and the jet length approximately 8.8 and 6 times greater than its diameter at 8 and 16 ns, respectively. The formed jet-like flow is preserved for times more than 50× the laser pulse duration. The plasma density profile is not necessarily monotonous at the axis and density minimum in the direction along the axis may be formed between the region of the plasma cumulation and the target.
The qualitative difference has been demonstrated in the plasma outflows when a plane target is irradiated with laser beams with an intensity maximum or minimum on the axis. The formation of a long-lasting collimated flow for annular laser beams has been observed. The duration of the collimated flow decreases with increasing laser intensity when radiative cooling is omitted. However, it is expected that the radiative cooling will improve the jet collimation for high-Z materials significantly.
4. DEPENDENCE OF COLLIMATED PLASMA OUTFLOWS ON LASER AND TARGET PARAMETERS
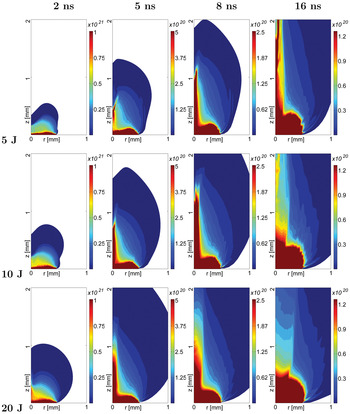
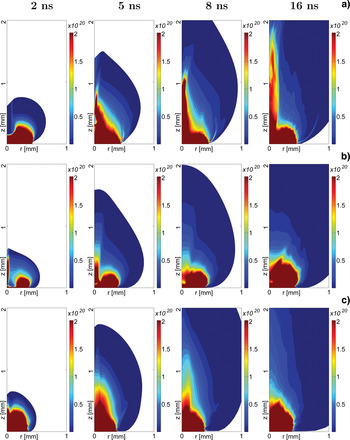
This section is devoted to the influence of the target material, laser energy and of the spatial intensity profile in the laser spot on the jet formation. Electron density profiles are plotted in Figure 4 for aluminum target, “r 2” intensity profile and various laser energies. The panel (b) of this figure differs from the panel (b) of Figure 2 only by the target material. The comparison shows that for lighter elements, the jet is less pronounced and broader, the collimation is less stable and it exists for a shorter time interval. When the laser energy is decreased, the outflow collimation is improved. When the laser energy for aluminum is approximately one-half of that for the silver target, the jet aspects (ratios of the jet length to the jet diameter) are approximately the same. We do not include radiative cooling here, and thus the difference is mainly due to a different ratio of the mean ion charge Z to the ion mass number A. Smaller relative ionization for the heavier elements leads to smaller thermal energy controlled by the electron density compared to the kinetic energy of the outflow controlled by the ion inertia, and thus the trend to the lateral expansion is weaker. In the experiment, this difference is even strengthened by the radiative cooling of high Z plasmas, and thus very sharp collimation is observed at PALS for targets of heavy elements (Kasperczuk et al., Reference Kasperczuk, Pisarczyk, Borodziuk, Ullschmied, Krousky, Masek, Rohlena, Skala and Hora2006) like silver and tantalum, but not for aluminum.
(Color online) Electron densities at 2, 5, 8, and 16 ns after the laser pulse for aluminum target, “r 2” laser beam profile, and laser energies 5, 10, and 20 J.

The impact of the spatial intensity profile in the laser spot with a central intensity minimum is demonstrated in Figure 5. When the plotted electron density profiles are compared with the plasma outflow for the “r 2” laser profile plotted in the panel (b) of Figure 2, the best collimation of the plasma outflow is observed for “r 2” profile. It is demonstrated via “delta” and “hole” intensity profile that very deep intensity minimum is detrimental for the cumulative jet formation. Even though cumulative outflow is formed for “r 4” profile, it is still clear that the intensity minimum in the beam center is less than optimal for stable jet formation. We have not tried to find optimum profile, but our comparison of various beam profiles clearly depicts that the spatial intensity distribution in the laser spot is critical for the jet formation, and the existence of an intensity minimum in a laser beam need not be sufficient for a reliable formation of a cumulative outflow with a high aspect ratio.

5. PALS LASER INTENSITY PROFILE IN THE INTERACTION REGION
PALS is a high-power pulsed iodine photo-dissociative laser operating at 1315 nm. During the jet experimental campaign (Kasperczuk et al., Reference Kasperczuk, Pisarczyk, Borodziuk, Ullschmied, Krousky, Masek, Rohlena, Skala and Hora2006), laser was operated at 50–200 J level with pulse width of 300 ps followed by a conversion to the third harmonic (3ω0). Third harmonic beam was focused on targets placed in the vacuum chamber by means of an f/2 large size aspheric lens of the aperture 30 cm with a central obscuration of 4 cm in diameter. In order to produce plasma jets, the surface of a massive metal target was placed slightly ahead of the best focus. Thus, laser spot diameter at the target surface was varied in the range 400–1400 µm.
The reported near-field pattern and the measured profile of PALS output beam is flat, hence a similar uniform profile on the target was considered during early jet experiments. In the course of progressing research, an indirect evidence such as craters in targets (Borodziuk et al., Reference Borodziuk, Doskach, Gus'kov, Jungwirth, Kalal, Kasperczuk, Kralikova, Krousky, Limpouch, Masek, Pfeifer, Pisarczyk, Pisarczyk, Rohlena, Rozanov, Skala and Ullschmied2004) and X-ray pinhole images (Kasperczuk et al., Reference Kasperczuk, Pisarczyk, Demchenko, Gus'kov, Kalal, Ullschmied, Krousky, Masek, Pfeifer, Rohlena, Skala and Pisarczyk2009) indicated modulation of an interaction beam. These signs strongly support the idea of a ring shaped beam profile, and the laser beam should produce a plasma jet via plasma cumulation at the axis (Gribkov et al., Reference Gribkov, Krokhin, Nikulin, Semenov and Sklizkov1975).
In order to explore the details of the PALS interaction beam profile, we have modeled the PALS beam propagation in the laser system and in the interaction chamber optics. A physical optic simulation with complex amplitude representation of the beam wavefront and intensity was selected for our calculation of the interaction beam profile (Lawrence, Reference Lawrence, Shannon and Wyant1992). It enables a full diffraction treatment of a laser beam along a propagation path and it permits an accurate modeling of regular laser components.
We have used General Laser Analysis and Design (GLAD) ver. 5.3 by Applied Optics Research (Lawrence, Reference Lawrence2010) for the PALS beam simulation. GLAD is a 2D + 1 sequential propagation code appropriate for simulations of high power laser systems. The PALS laser, historically Asterix IV from MPQ, has been used for laser plasma research for an extended period. Hence, the input data for our simulation originate from several resources. The basic data are from the current laser layout. Figures of the optical elements in the laser chain are from the original Asterix production and testing database. Updated information on the substituted and new optics is amended. The input and the calculated data are supported by the typical operational parameters obtained from the diagnostics whenever possible.
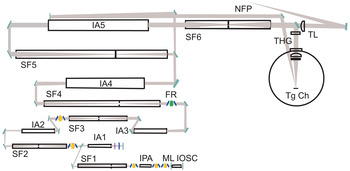
Due to its classical architecture, PALS laser allows for a straightforward laser modeling. Simulations include the amplification chain, the diagnostic branch and the interaction chamber optics shown in Figure 6. The amplification chain consists of iodine gas amplifiers and beam magnification telescopes—spatial filters. The diagnostic branch for NFP and FFP is simplified to a single transform lens and a corresponding propagation path. On the output of laser, the main 1315 nm beam is converted to 3ω0 by a THG unit. The interaction chamber optics includes an entrance window, a large-size aspheric lens and a blast-shield.
(Color online) Simplified layout of laser, diagnostics and target chamber optics. ML IOSC = mode-locked iodine oscillator, IPA = iodine preamplifier, SFn = n-th spatial filter, IAn = n-th iodine amplifier, FR = Faraday rotator, NFP = near field pattern, TL = thick lens, THG = third harmonic generation, Tg Ch = target chamber.

All optical elements are modeled as real thick optics with true aberrations accounted. Laser propagation and amplification in boosters is calculated with a radial inhomogeneous saturation profile due to an inhomogeneous pumping at higher energies. The perturbations of the laser beam by the refractive index fluctuations of the transport media during the long propagation path in the laboratory air and in the pressurized gas amplifiers are included.
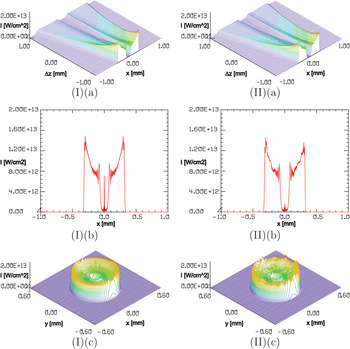
Plasma jets were produced in the proximity of the laser focus, hence we have simulated 3ω0 interaction beam profiles up to an intermediate zone before the laser focus. The calculation results are presented in Figure 7. The beam horizontal cross-section is plotted as the interaction plane approaches the geometrical focus from 3.2 to 1.2 mm. The beam size decreases from about D = 1600 µm to D = 600 µm. A deep central hole and circular interference fringes are caused by the protective obscuration on the chamber window and by the opening in the focusing lens. In contrast to a perfectly spherical wavefront converging to the focus, the calculated beam intensity decreases around the center, while the intensity at the beam edges rises up. This is an effect typical for a low level spherical aberration introduced by common optics. It can be attributed to a residual aberration accumulated in both the laser and chamber optics. At higher operation energies of about EL > 250 J, a reduction of the central intensity due to nonuniform pumping of the large aperture boosters becomes apparent, in addition to the spherical aberration. In order to see the details of the beam at the position 1200 µm ahead of the focus, the full beam profile and the horizontal profile are plotted separately. A comparison of the ideal beam passing through a static atmosphere and a homogeneous gas laser medium, with a realistic beam passing through a low-level turbulent atmosphere and perturbed gas laser amplifiers is also shown.
(Color online) Calculated intensity profiles of a PALS 3ω0 interaction beam in an intermediate zone in front of the focus: (I) An ideal beam passing a static atmosphere and a homogeneous gas laser medium, (II) a realistic beam passing a low-level turbulent atmosphere and perturbed gas laser amplifiers, (a) propagation close to the focus with a sequence of horizontal cross-section profiles plotted, (b) an enlarged horizontal cross-section profile at 1200 µm ahead of focus, (c) a full beam profile at 1200 µm ahead of focus.

Deep concave interaction profiles are responsible for the generation of plasma jets from thick planar targets. Smoothed patterns are approximating the ideal profiles that generate narrow, uniform plasma jets. Irregularities and any deviation of the interaction profile from a perfectly symmetric shape would create deformations of the jet. This could lead either to the jet direction other than normal to the target plane, or to bending and twisting of the jet, or to jet broadening, appearance of isolated hot-spots and filaments, and also to an early breakup and other instabilities corresponding to the perturbation type.
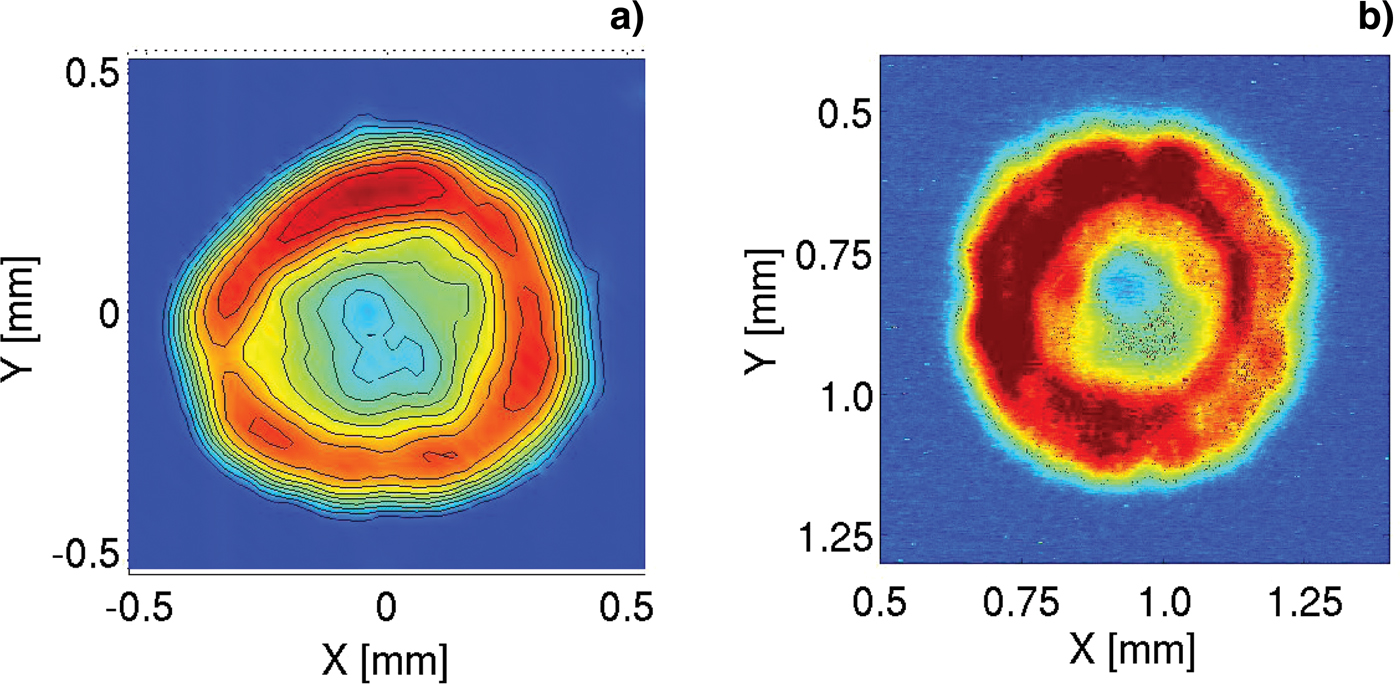
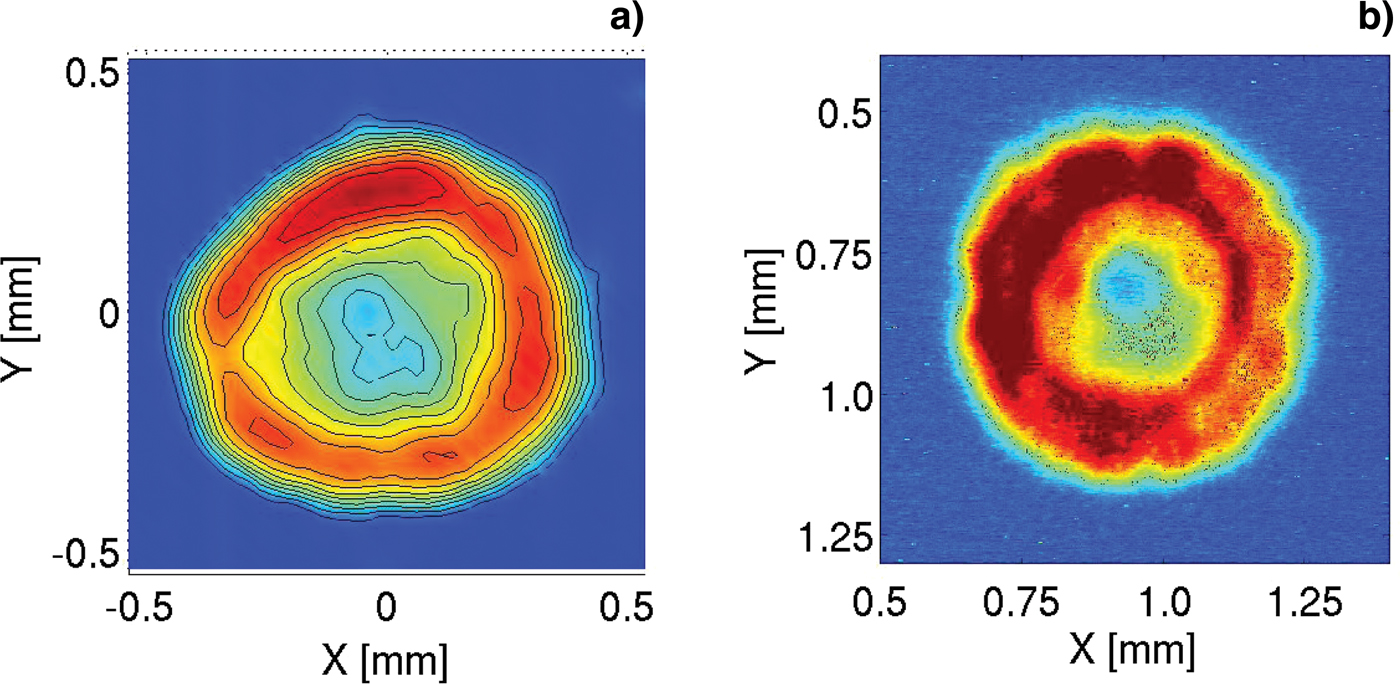
The exact laser intensity profile on the target may differ from the calculated one, because of a few less accurate input data and also due to the fluctuating parameters. It is important to note imperfect and aged optics and hardware of the PALS system. In addition, misalignment of optics and uncontrollable changes in the gaseous transport media lead to unaccounted errors along the propagation path. Nevertheless, the existence of a deep concave profile that is the characteristic feature of the calculation result is also supported by the laser diagnostics. A measurement at the fundamental wavelength in the diagnostic branch shows a detectable spherical aberration in the laser beam. According to the propagation analysis, approximately one-half of the aberration may originate at the final spatial filter, while the other half can be accumulated in the rest of the laser chain. Picture of the beam profile in the diagnostic branch is presented in the panel (a) of Figure 8. The intensity profile in the laser spot affects X-ray emission from targets as depicted in the panel (b) of Figure 8.
(Color online) (a) PALS beam profile measured by far field laser diagnostics after last spatial filter. (b) X-ray emission (filtered by 5 µm-thick Al foil) from 10 µm-thick copper foil placed 1.2 mm ahead of the best focus of third harmonic laser beam of energy 78 J recorded by pinhole camera looking at the angle of 30o at the target front side (courtesy Dr. Karel Masek).
An accurate calculation of the interaction profile can be accomplished with the final optics data updated to higher precision and verified by a regular beam diagnostics. The current laser profile in the interaction region can be further optimized for the jet production by additional optics and tailored to a specific interaction experiment.
6. FLUID SIMULATIONS OF JET FORMATION AT PALS LASER
Laser beam profile (Fig. 7 panel II.b) from the above laser simulation of the PALS beam propagation was smoothed by damping out fine-scale inhomogeneities of widths below 15 µm and then the smoothed intensity profile was used as the input for the fluid code PALE. We have calculated the plasma outflow for aluminum and silver targets, and various laser energies.
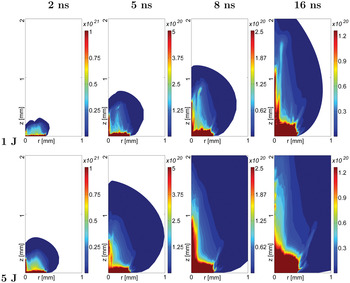
The jet formation on aluminum target is presented in Figure 9 as an example of light material. Here, stable jet formation is observed only for low laser energies. For laser energy of order 1 J, the jet with the aspect ratio of about 11 is apparent up to the simulation end (16 ns). For higher laser energy of 5 J, formation of jet with aspect ~8 is observed up to 8 ns, but later the jet is unstable, it widens and the central feature disappears. Cumulation is not observed for laser energy 10 J and higher.
(Color online) Electron density for Al target irradiated by laser beam energies of 1 and 5 J and with the spatial profile calculated above for PALS conditions.

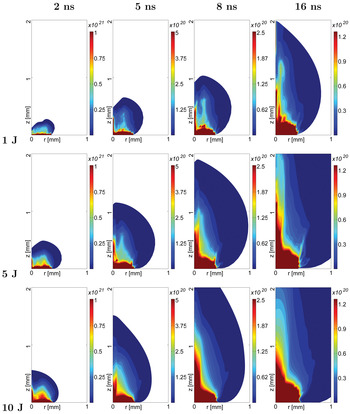
Jet formation is considerably more stable and persistent for targets of heavier materials like silver in Figure 10. Narrow cumulative jet of length >1.5 mm with aspect ~13 is observed for the laser energy of 5 J at the simulation end (16 ns). This jet is longer, of similar width and of smoother density profile than cumulative jet of low laser energy of 1 J. On the other hand, at higher laser energy of 10 J, the cumulative flow is shorter and wider with aspect ratio of 5. Thus, the existence of optimum energy of laser beam with a particular spatial profile is indicated for formation of a long, narrow and stable jet.
(Color online) Electron density for Ag target irradiated by laser beam energies of 1, 5 and 10 J and with the spatial profile calculated above for PALS conditions.

This is in agreement with experiments at PALS laser (Kasperczuk et al., Reference Kasperczuk, Pisarczyk, Borodziuk, Ullschmied, Krousky, Masek, Rohlena, Skala and Hora2006) where plasma outflows of width comparable with the laser spot are formed for aluminum while considerably narrower jets are formed for silver, tantalum and lead. When the plasma outflow is simulated with the assumption of Gaussian laser beam profile, radiative cooling leads to a considerable decrease of the lateral spread of the outflow for high Z materials (Nicolai et al., Reference Nicolai, Tikhonchuk, Kasperczuk, Pisarczyk, Borodziuk, Rohlena and Ullschmied2006) but the outflow diameter is still comparable with the laser spot diameter, and thus it is several times greater than in the experiment. Thus, according to our opinion, radiative cooling alone cannot explain the experiment. Therefore, tentative explanation of the experiment by the intensity profile in the laser spot was proposed (Kasperczuk et al., Reference Kasperczuk, Pisarczyk, Demchenko, Gus'kov, Kalal, Ullschmied, Krousky, Masek, Pfeifer, Rohlena, Skala and Pisarczyk2009), however, without a detailed analysis. Our simulations show that laser beam profile at PALS laser is indeed suitable for the formation of jets with high aspect ratios. Recently, cumulation enhancement has been reported (Kasperczuk et al., Reference Kasperczuk, Pisarczyk, Chodukowski, Kalinowska, Gus'kov, Demchenko, Klir, Kravarik, Kubes, Rezac, Ullschmied, Krousky, Pfeifer, Rohlena, Skala and Pisarczyk2012), when a heavier material in the central part of the target was encircled by an outer plastic material acting like a plasma piston.
7. CONCLUSIONS
Our simulations analyze the impact of the spatial intensity profile in the laser spot on the plasma outflow from bulk solid targets. The main aim is to find conditions when cumulative jets suitable for laboratory studies of astrophysically relevant phenomena may be produced easily and reliably.
The qualitative difference of the outflow for Gaussian (as a representative of profile with central intensity maximum) and for profiles with central intensity minimum (annular beams) has been demonstrated. Cumulative jets with high aspect ratio (~10) may be formed in the outflow when a laser beam with a central intensity minimum is incident on a bulk planar solid target. The jet formation is dependent on the particular shape of the intensity profile and too deep broad central intensity minimum may preclude jet formation. The jet formation is more reliable and stable for high Z target even when radiative losses are omitted. This is due to a higher ratio of ion mass to average ion charge leading to a higher ratio of the plasma kinetic energy to the thermal pressure in the outflow. The jet stability will be even enhanced by radiative losses for high Z targets. The jet formation is less stable and durable for higher laser energies, and thus for given intensity profile, the existence of optimum laser energy for the formation of a jet with a high aspect ratio is indicated.
We have analyzed the intensity profile of laser spot at PALS laser by physical beam propagation modeling in the laser system. Our simulations show that outside of the best focus, PALS laser beam has an annular intensity profile and this profile is suitable for formation of cumulative jets in the outflow. The aim of this paper is to demonstrate the grave significance of the laser beam profile for the jet formation. Future simulations will include a detailed model of radiative losses in order to reach quantitative agreement with the PALS experiment.
ACKNOWLEDGMENTS
Authors express their gratitude to Dr. Karel Masek for the possibility to use yet unpublished pinhole picture from experiment in 2007. Partial support by the Czech Science Foundation (project P205/10/0814) and by the Ministry of Education, Youth and Sports of the Czech Republic (projects LC528 and MSM6840770022) is gratefully acknowledged.