I. INTRODUCTION
Magnesium and magnesium alloys are well identified for their significant properties like light weight, electromagnetic shielding, good castability, damping, and high specific strength which make their widespread industrial applications and considered as a green material of resources. Reference Chen, Wang, Peng, Zhai and Ding1–Reference Kojima4 Nowadays cast magnesium alloys are used in structural applications due to their good surface quality, dimensional accuracy, and high productivity. Reference Gong, Li, Kang, Cho and Li5,Reference Gong, Kang, Li and Cho6 But, few limitations like low wear behavior and corrosion properties restrict the usage of magnesium alloys in many industrial applications. Reference Hoche, Blawert, Broszeit and Berger7,Reference Wang, Eliezer and Gutman8 Equal channel angular pressing (ECAP) process Reference Du, Yin, Liu, Wang and Guo9–Reference Zhao, Liao, Zhu and Valiev11 is one of the effective tools among several severe plastic deformation (SPD) techniques in achieving ultrafine grained microstructure without much change in dimensional features. Reference Valiev, Estrin, Horita, Langdon, Zechetbauer and Zhu12,Reference Yang and Ghosh13 Limited literature is available on wear behavior and corrosion studies of magnesium and its alloys processed by ECAP process. Hu et al. Reference Hu, Fan, Wang, Zhai, Li and Ou14 conducted wear studies on extrusion shear (ES) processed AZ31B magnesium alloy by dry sliding test and showed that wear resistance was increased due to refined microstructure. Xu et al. Reference Xu, Wang, Zhu, Shirooyeh, Wongsa-Ngam, Shan, Guo and Langdon15 reported that ECAP processed sample showed lower fluctuations in coefficient of friction (COF) due to increment in their mechanical properties and reduced wear mass loss. Orlov et al. Reference Orlov, Ralston, Birbilis and Estrin16 conducted corrosion test on ECAP processed ZK60 magnesium alloy and showed improved corrosion resistance due to refined grain structure and distribution of intermetallic Zn and Zr. Minarik et al. Reference Minarik, Kral and Janecek17 investigated AE21 and AE42 magnesium alloys by electrochemical impedance spectroscopy (EIS) to study the corrosion resistance using 0.1 M NaCl electrolyte and found that Al-rich Al11RE3 dispersed particles strongly enhanced the corrosion resistance. Hadzima et al. Reference Hadzima, Janecek, Bukovina and Kral18 observed that ECAP processed AZ31 magnesium alloy showed higher charge transfer resistance compared to cast material by conducting EIS and found that refined microstructure influenced the corrosion properties. Pardo et al. Reference Pardo, Merino, Coy, Arrabal, Viejo and Matykina19,Reference Pardo, Merino, Coy, Viejo, Arrabal and Feliu20 studied the corrosion behavior of AZ31, AZ80, and AZ91D alloys and reported that the secondary phase (Mg17Al12) network controlled the corrosion attack on the surface. Kral et al. Reference Kral, Minarik, Lesna, Skublova, Harcuba, Hadzima and Janecek21 found that the ECAP processed AE42 magnesium alloy possesses higher charge transfer resistance in comparison to as-extruded condition which represented higher corrosion resistance properties of ECAP processed samples. Jiang et al. Reference Jiang, Aibin, Saito, Zhixin, Dan, Fumin, Nishida, Donghui and Pinghua22 reported the increased corrosion resistance of ECAP processed ZE41A magnesium alloy in aqueous NaCl solution due to grain refinement.
In the current work, wear and corrosion behaviors of ECAP processed AM70 magnesium alloy have been investigated. Worn surfaces were subjected to scanning electron microscopy (SEM) and energy dispersive X-ray spectrometer (EDS) to identify the wear mechanism, and corroded surfaces were subjected to EIS test and SEM to study the corrosion behavior.
II. MATERIALS AND METHODS
The chemical composition of cast AM70 alloy is mentioned in Table I. Magnesium cast ingots were machined using lathe to prepare the samples of dimension 15.8 mm in diameter and 95 mm in length for ECAP processing. Die used for ECAP process was made up of hot die steel material which had two plates of equal dimension. The die was designed to process the material through two channels and the channels intersected at channel die angle (Φ) of 110° and outer radial angle (ψ) of 20°.
Chemical composition of AM70 alloy in wt%.

Earlier to ECAP process, the samples were subjected to homogenization treatment at 400 °C temperature by placing them in a furnace for a period of 24 h to have a uniform distribution of constituents in the matrix. ECAP process was conducted at a temperature of 275 °C using processing route B C at a ram speed of 1 mm/s. The samples were placed by rotating them by 90° in the same direction either clockwise or anticlockwise during each pass along the longitudinal axis. Initially, ECAP die was heated to 275 °C using resistance coils and was monitored till the die reached the required temperature. Homogenized samples were placed in the die channel and allowed to heat for 15 min to reach the required temperature same as die temperature prior to pressing. Ram was pressed using universal testing machine, and molybdenum disulfide was applied on the channel surface and sample surface to prevent friction between the die and the sample; and the process was carried up to ECAP 4 passes using route B C.
For microstructural analysis, the samples were subjected to mechanical polishing by SiC papers (800–2000 grit size) and cloth polishing using diamond paste (0.25 µm) and finally, cleaning with acetone in an ultrasonicator. Samples after polishing were etched using picral and dried with blower. Microstructural analysis was carried out with SEM (JSM-6380LA, JEOL USA Ltd., Peabody, Massachusetts). Microhardness test was carried out using Omni-tech (MVH-S-AUTO, Omni-tech, Maharashtra, India) Vickers microhardness equipment. Measurements were recorded across the central area of sliced section at equal intervals with a load of 0.25 N and for a period of 15 s.
Wear test specimens were prepared by machining the unprocessed and ECAP processed samples. Wear specimens were prepared as per ASTMG99-05 standard with dimension 6 mm in diameter and 28 mm in length. Wear tests were performed at room temperature using pin-on-disc (DUCOM-TR-20LE-PHM 400-CHM 600, Ducom Instruments, Bangalore, India) wear test machine. Test was carried out on hard and polished disc (EN31 steel, Ducom Instruments) with HRC 65 hardness. Prior to wear test, the samples were polished with SiC papers (1500 and 2000 grit), followed by cleaning using ultrasonicator for 5–10 min and finally dried. The wear resistance was measured by a weight loss technique. Experimental optimization was carried out to select the load for wear test and initial tests were conducted at 20, 30, 40, and 50 N load. At 20 N load, the frictional force was very low between the disc and the sample with negligible wear mass loss and it was considered as lower condition. Under 50 N load, the generated wear plot exceeded the limit of the computer interface of wear test machine and the wear rate was too high with 50 N load and it was considered as higher condition. Based on the above experimental criteria, 30 and 40 N were considered for wear test. Samples were subjected to 30 and 40 N load with sliding distance of 5000 m at a sliding speed of 3 m/s with track diameter of 110 mm. Initial and final weight of the samples were measured to calculate the wear mass loss. Prior to each test, the disc surface was cleaned with 1000 grit SiC paper and wiped with acetone to remove the debris on the surface. Worn surfaces of unprocessed and ECAP processed samples were analyzed using SEM attached with EDS to study the wear mechanism.
Samples used for electrochemical corrosion studies were mirror-finished by polishing using SiC papers and proper cleaning. EIS was conducted using electrochemical workstation (EC Lab-BioLogic SP-150, BioLogic Science Instruments, Seyssinet-Pariset, France) with a standard three-electrode system containing a saturated calomel electrode (SCE) which was a reference electrode. The second electrode was the platinum wire which acted as a counter electrode and third was the test sample with exposed surface area (1 cm2) which acted as the working electrode. The aqueous solution of 0.1 M NaCl was used as an electrolyte and the pH of solution was kept 7.5. Dilute electrolyte was selected as test electrolyte, because it is a standard electrolyte which imitates corrosion environments that are encountered by magnesium components. Reference Orlov, Ralston, Birbilis and Estrin16 During each experiment, samples were polished using SiC paper (400–2000 grit). EIS tests were conducted in 0.1 M wt% NaCl electrolyte solution at room temperature to compare the corrosion behavior of unprocessed and ECAP processed samples. EIS test was carried out with a frequency of 100 kHz to 10 mHz and amplitude potential signal of 5 mV. X-Ray diffraction (XRD) was conducted on corroded samples with diffractometer using diffraction angle (2θ) from 20° to 90° at a scan speed of 2° per minute. Surface morphology of the tested samples was examined by SEM.
III. RESULTS AND DISCUSSION
A. Microstructural studies and hardness properties
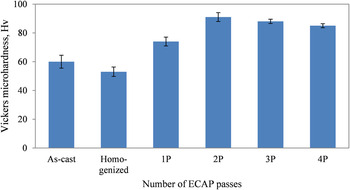
Micrographs of unprocessed (as-cast and homogenized) and processed (ECAP 1 to 4 pass) samples are shown in the previous publication. Reference Gopi, Nayaka and Sahu23 Grain sizes of as-cast and homogenized samples were found to be an average of 45 and 100 µm. During initial ECAP pass, larger grains were divided into smaller grains, which looked bimodal in microstructure. The average grain size of 1 and 2 pass samples were 60 and 25 µm, respectively. Homogeneous and equiaxed microstructures were noticed after 2 ECAP passes and this may be due to dynamic recrystallization or static recrystallization during ECAP process. Reference Akbaripanah, Fereshteh-Saniee, Mahmudi and Kim24 Average grain size of 3 and 4 pass samples were found to be ∼8 and 1 µm, respectively. Variation of grain size with ECAP 1 to 4 passes and their microstructures with the detailed discussion can be found in the previous publication. Reference Gopi, Nayaka and Sahu23 Microhardness values for different ECAP passes are shown in Fig. 1. Increase in hardness was observed with increase in ECAP passes because of grain refinement compared to initial condition. Decrease in hardness after ECAP 2 passes is because of the development and nucleation of new grains with higher ECAP passes which hindered the strain hardening effect and also, due to texture softening where the processed samples did not possess same texture within the material. Reference Gopi, Nayaka and Sahu23
Hardness values of unprocessed and ECAP processed samples.

B. Wear analysis
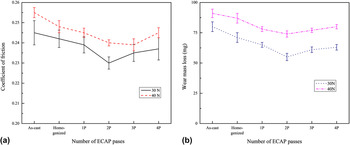
Unprocessed and ECAP processed samples were subjected to wear test under two different loads (30 and 40 N) with sliding distance of 5000 m. Figure 2(a) shows the COF for unprocessed and ECAP processed samples. More fluctuation in COF was seen in case of samples subjected to 30 N load but when samples were subjected to 40 N load, fluctuation got reduced due to increased surface contact between sample and steel disc during wear test. Reference Li, Lei and Zhu25 Lower load or applied force leads to higher fluctuations in COF. Improved COF values were obtained for ECAP processed samples compared to unprocessed condition for both 30 and 40 N loads as shown in Fig. 2(a). Among ECAP processed samples, ECAP 2 pass sample indicated lower COF as compared to other ECAP processed samples. With the above discussion, it can be concluded that the ECAP process led to the decrement of COF values due to their hardness properties and COF values showed similar trend as hardness values (Fig. 1) and exhibited wear resistance properties. Above mentioned results are consistent with the reported results for AZ31 magnesium alloy. Reference Xu, Wang, Zhu, Shirooyeh, Wongsa-Ngam, Shan, Guo and Langdon15,Reference Li, Lei and Zhu25
(a) COF values and (b) wear mass loss under 30 and 40 N.

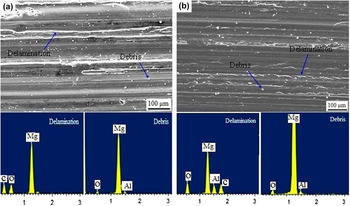
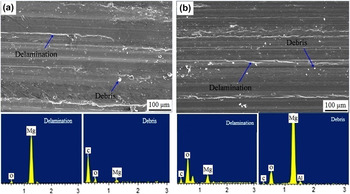
Figure 2(b) shows the relationship between wear mass loss and number of ECAP passes for different load conditions. ECAP processed samples showed decreased wear mass loss in comparison to unprocessed condition and this shows wear resistance property of the processed samples. With increase in load, the wear rate increases for unprocessed and processed samples as shown in Fig. 2(b). As ECAP passes increases, the wear mass loss reduces up to 2 pass but increases with 3 and 4 ECAP passes due to decrease in hardness of the sample. Increase in wear mass loss after ECAP 2 pass is related to the hardness of the processed samples and is related by Archard equation. Reference Archard26 The variation in wear mass loss is because of the ECAP process which provides better hardness results because of grain refinement. Decrease in hardness of the ECAP processed sample after 2 pass is due to nucleation of new grains during higher ECAP passes. Reference Gopi, Nayaka and Sahu23 Worn surfaces showed delamination, plowing, and wear debris in the sliding direction due to formation of subsurface cracks which resulted in removal of material in the form of flakes or wear debris as shown in Figs. 3 and 4. Plowing is caused due to the interaction of hard particles between disc and the sample surfaces, which cause wear by removing material in the form of small fragments. It can be observed that the delamination, plowing, and wear debris are reduced on the samples processed by ECAP up to two passes. Wear surfaces are smooth in case of ECAP processed samples due to the improved microhardness distribution which hinders the formation of fatigue cracks. During cyclic sliding process, ECAP processed samples avoid the formation of wear debris and delamination, where the material get detached due to crack formation in a direction perpendicular to sliding. Reference Xu, Wang, Zhu, Shirooyeh, Wongsa-Ngam, Shan, Guo and Langdon15 Variation of load has not shown much change in the surface morphology. The above mentioned results showed that the wear mechanism may be the abrasive wear due to formation of delamination and wear debris. EDS was conducted on wear surfaces of homogenized and ECAP 2 pass samples for loads 30 and 40 N as shown in Figs. 3 and 4, respectively. Delamination, plowing, and debris region were subjected to EDS analysis and it was observed that oxygen peaks were visible in the region of delamination, debris, and plowing along with magnesium peaks. Surface oxidation was found on the samples in both conditions, that is, under 30 and 40 N load. Since magnesium and its alloys possess high affinity to oxidation, it results in the wear mechanism as oxidation wear. Wear test results revealed that the ECAP processed samples have better wear resistance. Reference Taltavull, Rodrigo, Torres, Lopez and Rams27 These results are supported with reported data on AZ31 magnesium alloy. Reference Xu, Wang, Zhu, Shirooyeh, Wongsa-Ngam, Shan, Guo and Langdon15
SEM and EDS of worn surfaces of (a) homogenized and (b) ECAP 2P for 30 N load.

SEM and EDS of worn surfaces of (a) homogenized and (b) ECAP 2P for 40 N load.

C. Corrosion studies by EIS
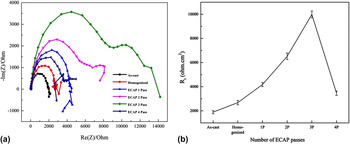
Unprocessed and ECAP processed samples were subjected to EIS test to study the corrosion behavior. Figure 5(a) displays the Nyquist plots of samples which are immersed in 0.1 M NaCl electrolyte solution. The arc signifies the dissolution of metal during corrosion process, where diameter of the arc is related to the corrosion resistance of the samples. Reference Pardo, Merino, Coy, Viejo, Arrabal and Feliu20,Reference Cao28 From Fig. 5(a), it can be observed that there is a second arc in the tail of every arc in the plot which shows an inductive mode caused due to the rupture of protective corrosion layer. As shown in Fig. 5(a), the diameters of capacitive arcs of the ECAP processed samples are increasing with increase in number of ECAP passes compared to unprocessed condition. Increase in diameter of capacitive arcs corresponds to the increased corrosion resistance. Reference Song, Ma, Jiang, Lin, Yang and Fan29 The first loop represents the protective layer in the interface and the second loop, that is the tail region or second arc represents the point where protective layer is damaged or cracked or separated from the surface and the interface is filled with electrolyte solution. Reference Kral, Minarik, Lesna, Skublova, Harcuba, Hadzima and Janecek21 For better exploitation of corrosion behavior, inset of Fig. 5(b) shows the equivalent circuit (Radles circuit) of EIS characteristics.
(a) Nyquist plots and (b) R t values of unprocessed and ECAP processed samples.

Radles circuit shows metal surface/oxide layer/electrolyte system, where R t, R s, and C represent the charge-transfer resistance, electrolyte resistance, and capacitance of the protective layer, respectively. Since the inductance behavior is detected in lower occurrences or tail region of the arc, an inductive element is considered in the Radles circuit. R L represents the resistance of adsorbed intermediate products and L is the inductance. The inductive part is difficult and irrelevant in electrochemical corrosion studies and the corrosion behavior is assessed with the capacitive arc. Reference Song, Ma, Jiang, Lin, Yang and Fan30 Decrease in corrosion rate was observed for ECAP processed samples due to presence of equiaxed ultrafine grains and homogeneously distributed secondary particles. Reference Jiang, Aibin, Saito, Zhixin, Dan, Fumin, Nishida, Donghui and Pinghua22 The main reason for enhancement in corrosion resistance of grain-refined materials is attributed to an improvement in protective layer formation and adhesion because of increased grain boundary density. Reference Ralston and Birbilis31
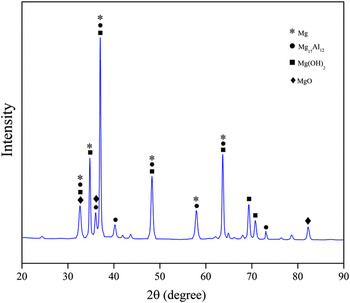
Ultrafine grains provide better surface coverage which inhibits the rupture of outer Mg(OH)2 surface which reduces the corrosion rate Reference Orlov, Ralston, Birbilis and Estrin16 and also the formation of β phases (Mg17Al12) which acts as a barrier for corrosion occurrence and it improves the corrosion resistance of the material. Reference Pardo, Merino, Coy, Viejo, Arrabal and Feliu20,Reference Song32 ECAP 4 pass sample showed decreased corrosion resistance due to increase in dislocation density Reference Gopi, Nayaka and Sahu23 with more ECAP passes which resulted in dislocations accumulation and consequently, storing abundant internal energy like energetic grain boundaries. The passive protective films are more prone to nucleation at the crystalline defect regions which lead to corrosion. Reference Song, Ma, Jiang, Lin, Yang and Fan29,Reference Johansen, Adams and Van Rysselberghe33 X-Ray diffraction of ECAP processed sample is shown in Fig. 6 to identify Mg(OH)2, MgO, and β phases (Mg17Al12). Presence of Mg(OH)2 and MgO shows the formation of passivation layer which reduces the corrosion process Reference Wang, Shinohara and Zhang34 and also Mg17Al12 phase acts as barrier for the occurrence of corrosion.
XRD of ECAP processed 3 pass sample.

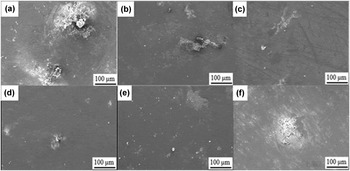
Radles circuit fits the Nyquist plots by ZSimpwin software to extract the parameters of the capacitive arc which provides R t values of the samples. Figure 5(b) shows the variation of R t values with different conditions. The obtained R t values of ECAP processed samples are larger than the R t values of unprocessed samples and this implies that the corrosion resistance of processed samples was better than unprocessed samples. Reference Minarik, Kral and Janecek17 R t value for ECAP 4 pass is reduced because more dislocations are introduced into the materials with increase in ECAP passes and these dislocations get accumulated and act as energetic sites which are more prone to corrosion. The porosity and stability of Mg(OH)2 protective film could not prevent the diffusion of chloride ions with water molecules into the magnesium matrix which cause severe corrosion reactions because of the presence of a large number of crystalline defects in higher ECAP pass samples. Hydrogen evolved by corrosion reaction further damages the Mg(OH)2 protective layer to a larger extent and more chloride and water molecules diffuse and further corrosion process takes place. Reference Song, Ma, Jiang, Lin, Yang and Fan29 SEM images of the corroded surfaces are as shown in Fig. 7. It can be observed that pits are increased in case of unprocessed samples (as-cast and homogenized) and also, these pits are deep. ECAP processed samples constitute of less number and comparatively, shallow pits. With higher ECAP passes, the number of pits reduces as shown in Fig. 7.
SEM images of corrosion samples of (a) as-cast (b) homogenized and ECAP processed (c) 1P, (d) 2P, (e) 3P, and (f) 4P.

IV. CONCLUSIONS
Wear and corrosion properties of ECAP processed AM70 magnesium alloy were investigated and the obtained results are summarized as below:
-
(1) Coefficient of friction (COF) decreased for ECAP 2 pass sample as compared to unprocessed condition and lower fluctuation in COF values was found at 40 N load in comparison to 30 N load. Reduced COF values showed better wear resistance property for ECAP 2 pass sample.
-
(2) ECAP 2 pass sample showed increased wear resistance properties as compared to unprocessed samples. Wear mass loss reduced by ∼1.45 and ∼1.29 times under 30 N load and ∼1.22 and ∼1.17 times under 40 N load than that of as-cast and homogenized condition, respectively. Reduced wear mass loss is due to increased hardness of the ECAP processed samples.
-
(3) SEM micrographs showed the occurrence of delamination, plowing, and wear debris on the wear surface. ECAP 2 pass sample exhibited smoother wear surface as compared to unprocessed condition due to uniform hardness distribution throughout the sample surface. EDS analysis identified the presence of oxygen peaks along with magnesium peaks on the sliding surface, and wear mechanism was identified as abrasion and oxidation wear.
-
(4) EIS plots showed better corrosion resistance properties of ECAP 3 pass sample and R t values improved by ∼5.28 and ∼3.72 times in comparison to as-cast and homogenized samples due to refined microstructure and formation of β phases.